
EB Daily Market Report - Wednesday, September 1, 2021
Executive Market Summary
- Futures pointed to a higher open, which is what we've seen
- The NASDAQ continues to show relative strength vs. the S&P 500 - see chart below
- Growth is the trade of choice right now - see the growth vs. value charts below
- Cryptocurrencies are higher today, especially etherium ($ETHUSD, +4.21%), which is the best of the best, in my opinion
- Commodities are mostly lower today, led by crude oil ($WTIC, -1.30%), which has fallen below $68 per barrel
- The 10-year treasury yield ($TNX) is flat and currently showing no signs of an uptrend or downtrend
- The U.S. dollar (UUP, -0.24%) is adding to its recent weakness and has moved to its lowest level since August 5th
- PVH Corp (PVH, +14.70%) is easily the best-performing S&P 500 company today after easily beating revenue & EPS expectations
- Meanwhile, CrowdStrike Holdings (CRWD, -3.25%) has been incredibly volatile and is currently lower, though its quarterly numbers beat forecasts
- Real estate (XLRE, +1.32%) and utilities (XLU, +1.08%) are leading bifurcated sector action, while energy (XLE, -1.43%) suffers from the lower crude prices
Market Outlook
The rotation that has so wickedly run its course throughout the market since the pandemic began is now favoring the NASDAQ. The easiest way to visualize this is via a price relative chart:
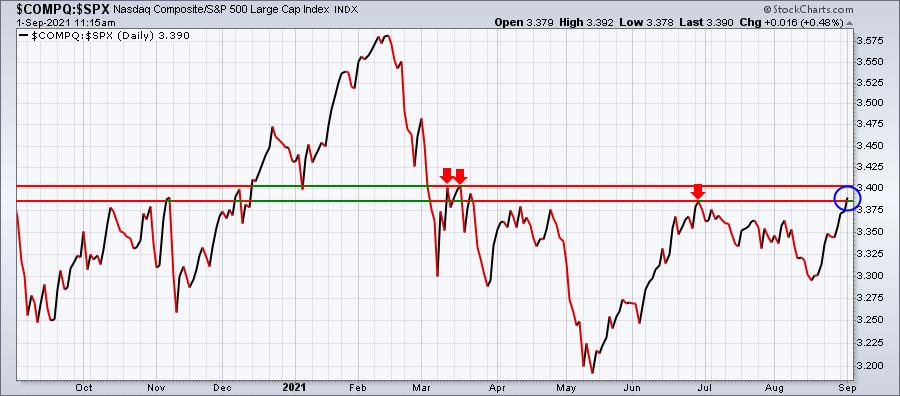
You might look at this chart and think, "well, aren't we up against key price relative resistance?" The answer is yes, but just remember that during secular bull markets, this ratio tends to move higher. Therefore, I'm not expecting resistance to continue holding. Instead, I'm fully expecting a breakout to occur and this ratio to "run" again.
Sector/Industry Focus
Growth or value? We always have that choice, so which should we choose? Well, growth stocks absolutely produce greater returns over time, but they also present the higher risk. So the choice becomes a personal one, and unfortunately it's a choice that I cannot make for members. It's truly up to each of you. I believe we're in a secular bull market and that we're heading higher. I've been firm in that belief since the April 2013 breakout on the S&P 500. I don't look for reasons to sell. I look for reasons to buy. I tend to ignore those who continually are searching for a top and an ensuing bear market. Yes, we'll eventually get one, but do you want to sit on cash until it happens? Look at where the market was a year ago. 2 years ago. 5 years ago. If you don't participate during a secular bull market and then begin buying in earnest when prices first begin to drop in a secular bear market, you'll quickly find that strategy doesn't work. DO NOT FIGHT THE TREND.
So let's get back to that growth ($DJUSGS) vs. value ($DJUSVS) proposition. Here's the current look:
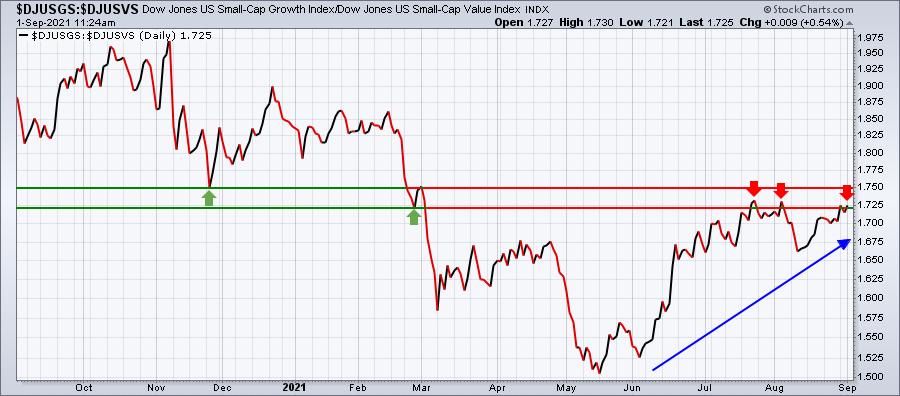
Clearly, growth is now outperforming value. But has it run its course? It appears to be hitting a key area of relative price resistance, right? Well, let's step back and take an objective look at the long-term chart that dates back to April 2013 to see how growth stocks typically perform vs. value stocks in a secular bull market:
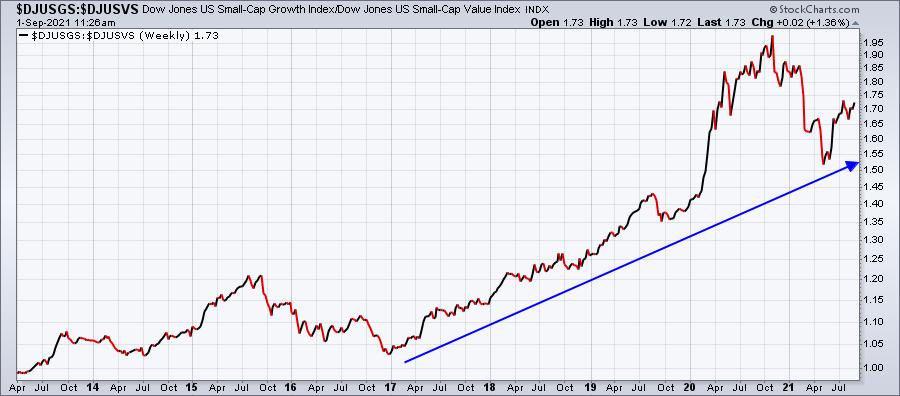
I'd view selloffs in growth stocks as an opportunity more than a problem. The pandemic led to a surge in growth stocks that we later realized was unsustainable, but note the "growthstockmageddon" earlier in 2021 simply returned us to that longer-term relative uptrend.
I've stated this on many occasions, but one advantage that I have over most technicians - in my humble view - is my fundamental background as a practicing CPA. I valued companies. I know what the combination of high growth and ridiculously low interest rates means to the valuation of publicly-traded companies. Earnings continue to CRUSH estimates for the most part and interest rates remain stubbornly low, despite all the claims of "hyper-inflation" on the way.
I believe we're in the midst of one of the greatest bull markets of our lifetime - one that may eventually challenge those crazy gains in the late-1990s. Running for cover every time the media yells "FIRE!" is not a great investing strategy. All of this is must my opinion, of course.
ChartLists/Strategies
I ran a "high volume" scan, looking to see which stocks might be making moves that we should be aware of simply because those moves are being corroborated by heavy volume. I ran this scan against the "Bullish Trifecta" ChartList that I provided in Tuesday's DMR. This ChartList represents the 83 stocks that are included on 3 of our key ChartLists - the SECL, SADCL, and RGCL. The first image below is the actual scan syntax used and the second image is the list of results from this scan:

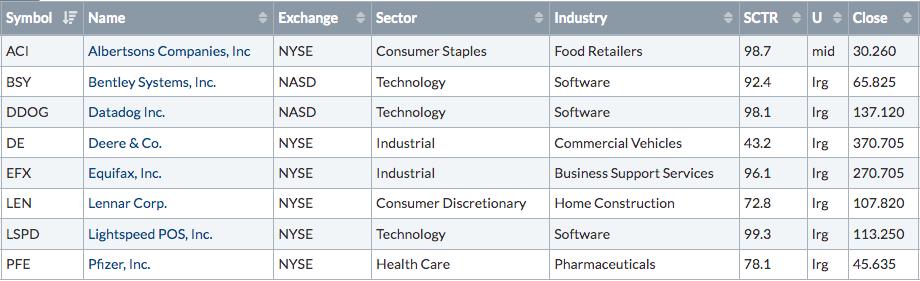
So we know the volume is at least above average this morning on these 8 stocks. We also know they've reported great earnings results, have raised guidance, and appear to be under accumulation (strong AD lines). The next thing I'd do is see if there are any stocks that are either breaking out from recent consolidation, or threatening to do so. Here are the 2 charts that I believe fit this criteria:
BSY:
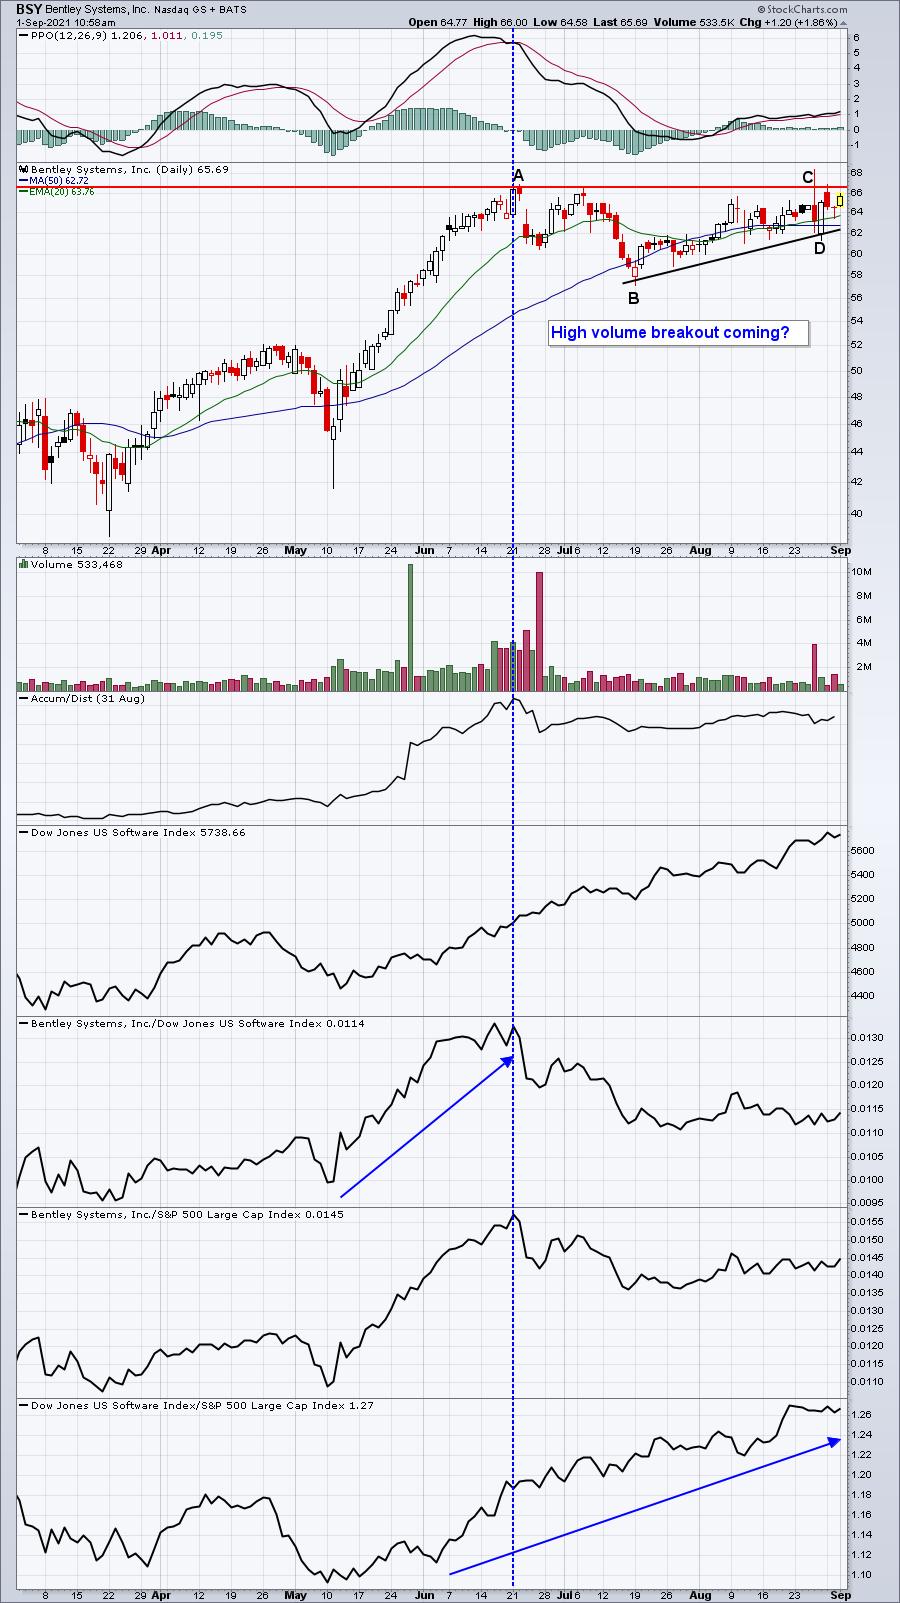
Bullish ascending triangle here? Certainly appears so. A heavy volume breakout would be extremely bullish.
LEN:
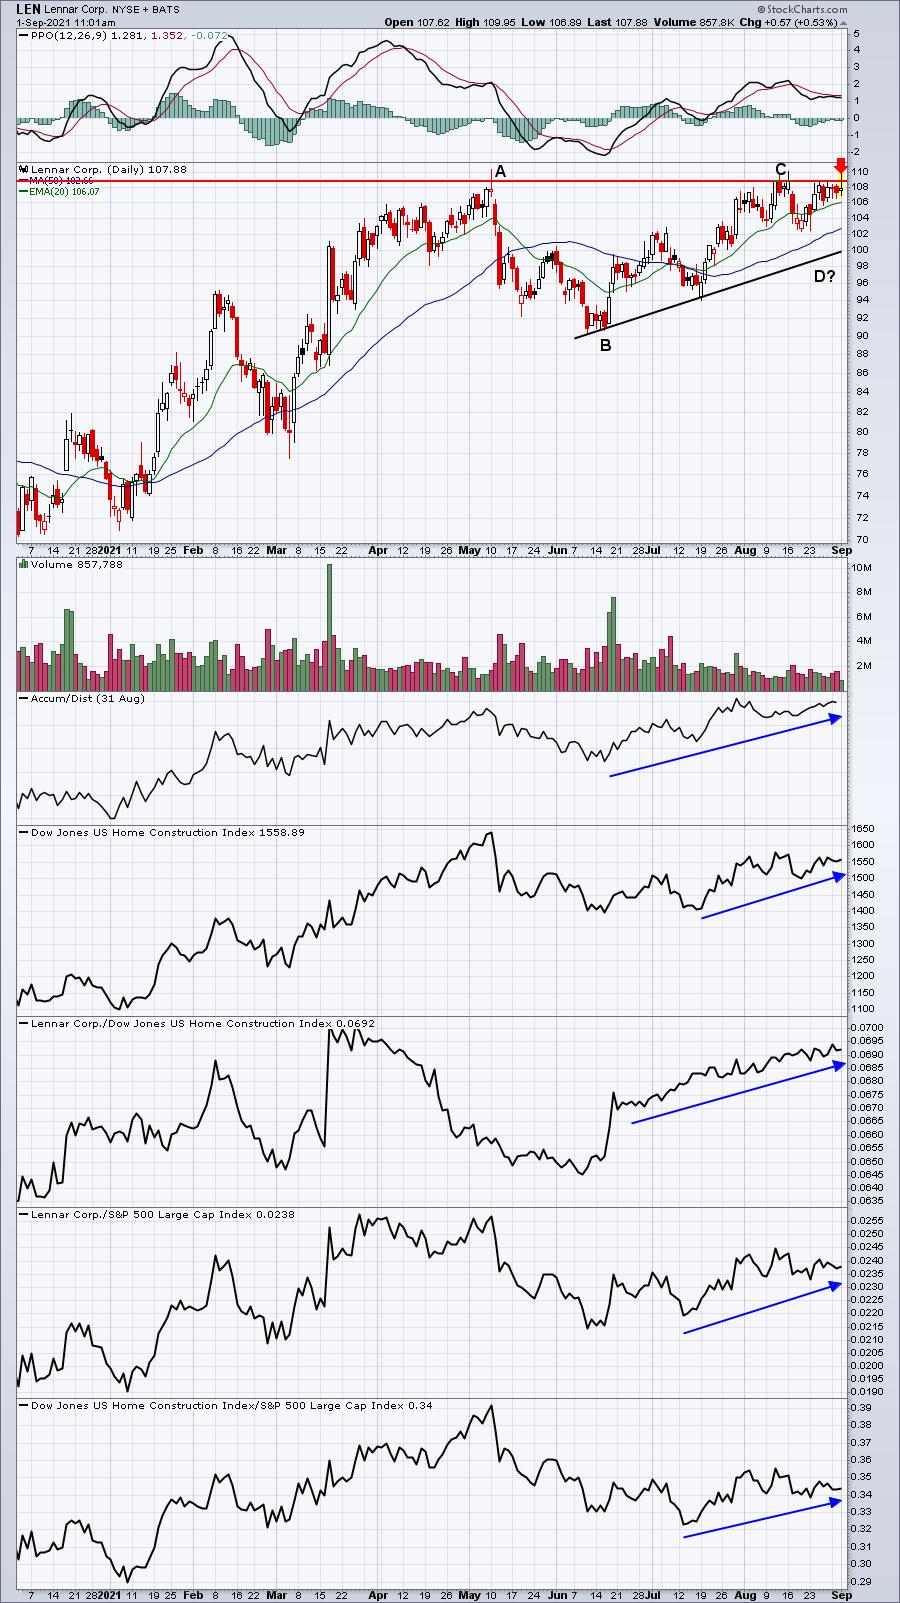
You don't have to have a pattern before a breakout, so today's volume could accompany a breakout. HOWEVER, if LEN fails after a false breakout, we could see a potential "D" point print in an A-B-C-D-E ascending triangle pattern. That would mean an initial drop before a later breakout. Just food for thought.
Earnings Reports
Here are the key earnings reports for the next two days, featuring stocks with market caps of more than $10 billion. I also include a few select companies with market caps below $10 billion. Finally, any portfolio stocks that will be reporting results are highlighted in BOLD. If you decide to hold a stock into earnings, please understand the significant short-term risk that you are taking. Please be sure to check for earnings dates for any companies you own or are considering owning.
Wednesday, September 1:
VEEV, CHWY, OKTA, ASAN, CPB, FIVE, NTNX, AI, SMTC, PHR
Thursday, September 2:
AVGO, DOCU, MDB, HRL, COO, HPE, TTC, GWRE, CIEN, DCI, DOOO, AEO, SAIC, SIG, SCWX, GIII
Economic Reports
August ADP employment report: 374,000 (actual) vs. 500,000 (estimate)
August PMI manufacturing: 61.1 (actual) vs. 61.2 (estimate)
August ISM manufacturing: 59.9 (actual) vs. 59.0 (estimate)
July construction spending: +0.3% (actual) vs. +0.3% (estimate)
Happy trading!
Tom