
EB Daily Market Report - Tuesday, September 7, 2021
Executive Market Summary
- Futures were mixed this morning, but mostly lower
- The NASDAQ has shown leadership today, while mid caps ($MID) and small caps ($SML) have mostly lagged
- The only four sectors higher today are all aggressive, led by consumer discretionary (XLY, +0.45%) and communication services (XLC, +0.34%)
- Gambling ($DJUSCA, +2.93%) and automobiles ($DJUSAU, +1.97%) are providing strength in the XLY; Tesla (TSLA, +2.48%) is trading at a 4 1/2 month high
- Apple (AAPL, +1.67%) continues to show leadership as computer hardware ($DJUSCR, +1.44%) paves the way higher for technology (XLK, +0.17%)
- Industrials (XLI, -1.31%) and real estate (XLRE, -1.27%) are putting pressure on the Dow Jones and S&P 500
- 3M Company (MMM, -3.61%) is the worst performing Dow component, while both Honeywell (HON, -1.80%) and Boeing (BA, -1.76%) are among the top 5 worst performers
- The 10-year treasury yield ($TNX) is up 5 basis points to 1.37% and the dollar (UUP) is also rising
- Commodities are weakening as gold ($GOLD, -1.89%) is attempting to hold onto $1800 per ounce
Market Outlook
Gold ($GOLD) is down close to 2% and threatening to break back below $1800 per ounce today. The dollar is rising as treasuries are selling off with yields rising. I'm not a fan of gold, despite the recent uptrend. If you compare gold's performance to the benchmark S&P 500, you'll see that it remains a horrible relative investment:
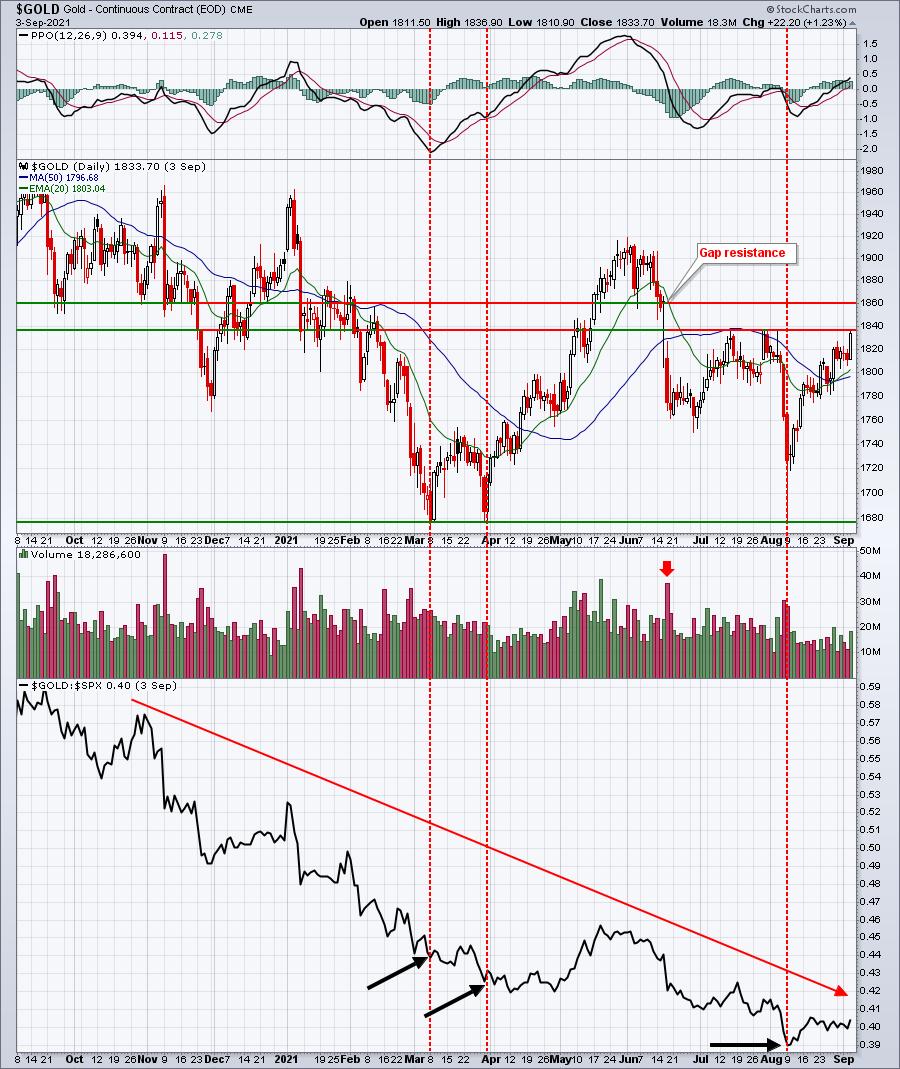
On the absolute chart, you can see that gold is in a trading range between the horizontal lines provided. However, note that at each comparable price low (twice in March and then again in August), relative strength is deteriorating. I'd continue to avoid gold.
Sector/Industry Focus
Gambling stocks ($DJUSCA), after failing at long-term price resistance and being beaten to pulp more recently, now appear to be uptrending again. The following daily and weekly charts both seem to indicate there's going to be more strength ahead:
DJUSCA (daily):
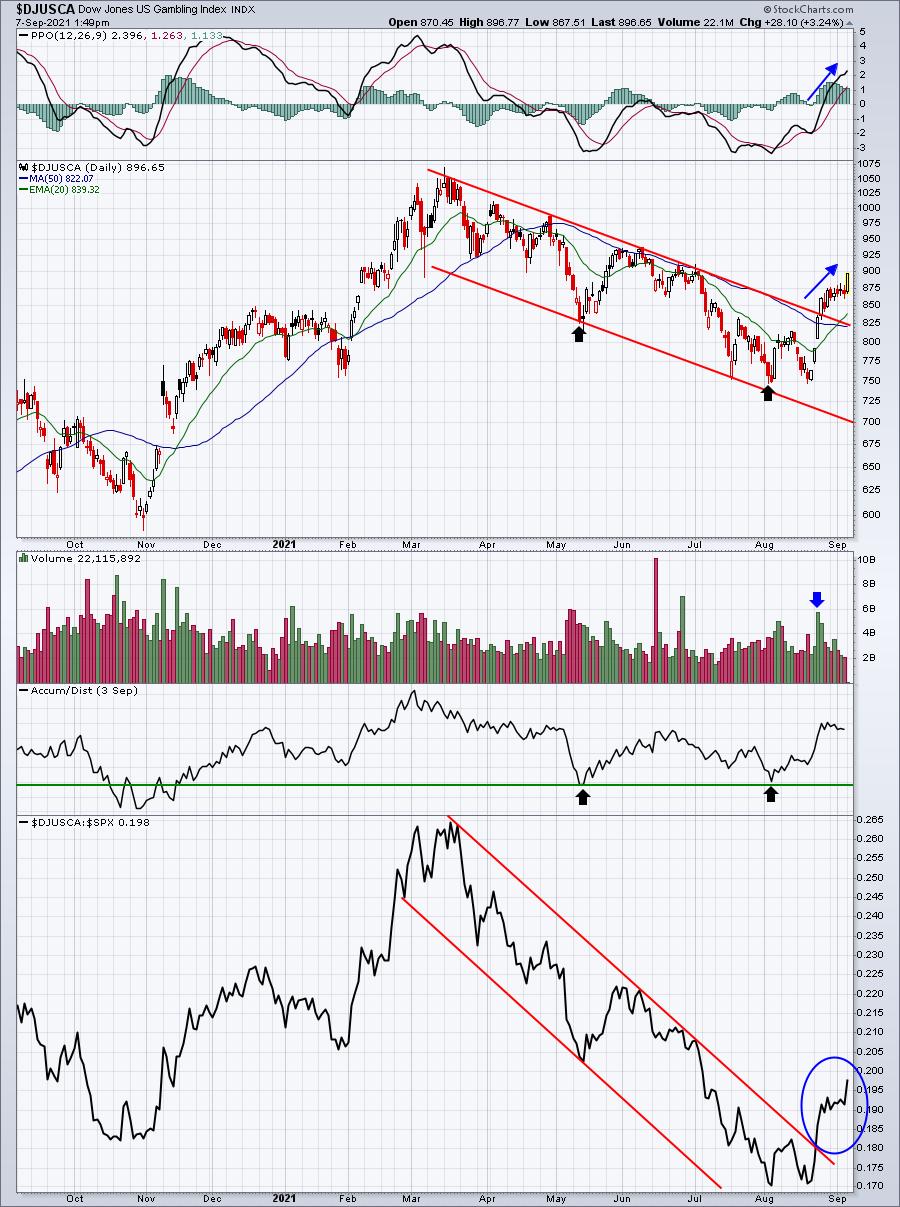
Both the absolute and relative downtrends appear to have ended. Also, note the volume that accompanied price breaking out of the downtrend.
DJUSCA (weekly):
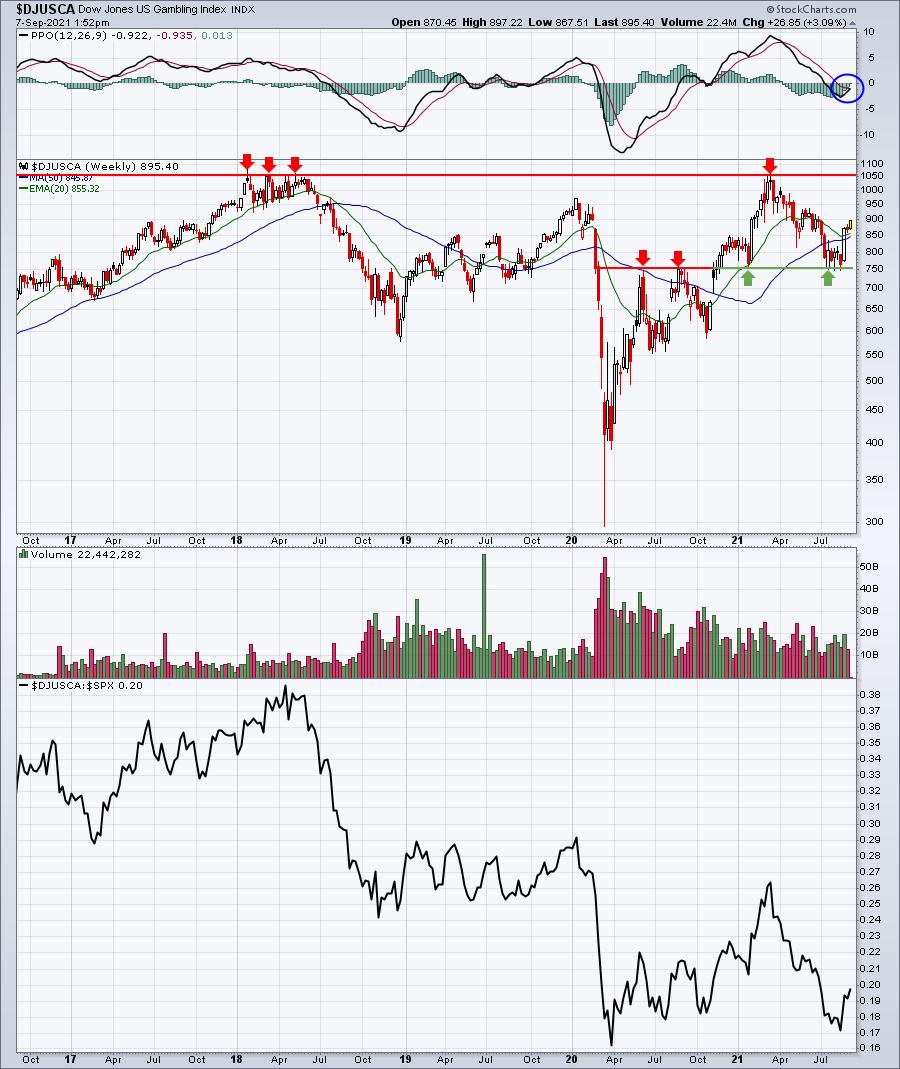
The long-term price resistance at 1050 is rather clear. But the DJUSCA still has another 150 points before it reaches that level. In the meantime, I'd follow the now-rising 20-week EMA.
ChartLists/Strategies
We provide a number of ChartLists for trading opportunities, but we also want to stress education in our product offerings. Over this past weekend, I reviewed hundreds of stocks that showed strong accumulation the day after earnings were reported and put together a ChartList of what I believe are the 57 strongest. I also annotated the key gap support level on each chart, created by the opening price the day after earnings. This ChartList is different from our Strong Earnings ChartList (SECL) in that it doesn't matter if the company beat revenues or earnings estimates. I also didn't care about relative strength or the long-term AD line. It's also different from our Strong AD ChartList (SADCL) as I'm not interested in what the AD line looks like over a long period of time. Instead, I looked for two things in putting together this "Earnings AD ChartList". First, there needed to be a hollow candle (close above the open). The extent of that hollow candle was also important. The closing price must have been at least 4% higher than the opening price. Second, volume had to be well-above average.
The purpose of this ChartList is to track those companies appearing to be under heavy accumulation after reporting its results - whether good or bad. Keep in mind that two things drive stock prices over time - Fed policy and earnings. While Fed policy affects all stocks, earnings reports are company-specific news. I think it would be a good use of time to simply flip through the 57 annotated charts that I've provided to get a clear visual of not only what these hollow earnings-related candles look like, but also to get a feel for how these earnings reports affect trading in the days and weeks after earnings.
If you're a StockCharts.com Extra or Pro member, you can click on the link below and enter the password provided to download this ChartList directly into your StockCharts.com account (if you're not a StockCharts.com member or a Basic member, you can still click on this link and review the charts):
Password: EADCL3928
If the above link and/or password doesn't work, we should have it updated on our website later this afternoon. Try to download it from there. If you're still having problems, please contact us at "[email protected]".
Earnings Reports
Here are the key earnings reports for the next two days, featuring stocks with market caps of more than $10 billion. I also include a few select companies with market caps below $10 billion. Finally, any portfolio stocks that will be reporting results are highlighted in BOLD. If you decide to hold a stock into earnings, please understand the significant short-term risk that you are taking. Please be sure to check for earnings dates for any companies you own or are considering owning.
Tuesday, September 7:
PATH, COUP, SMAR, CASY
Wednesday, September 8:
LULU, CPRT, S, GME, RH, WDH, HQY, KFY, ABM, AVAV
Economic Reports
None
Happy trading!
Tom