
EB Daily Market Report - Tuesday, September 14, 2021
Today's Event
Later today, at 4:30pm ET, I'll be hosting our monthly "September Max Pain" webinar, where we'll dive into possible market maker motives as they relate to September options expiration. Here is the room link:
https://earningsbeats.zoom.us/j/82041726934
The room should be open by 4:00pm ET. Hope to see you there!
Executive Market Summary
- Futures were a bit volatile as traders awaiting the latest CPI report from August
- Core CPI came in below expectations, rising just 0.1% vs. the 0.3% expected; the headline number was also lower than expected
- Futures turned higher after that lack of inflation, but then selling kicked in during the hour of trading
- It's been a back and forth session with the 10-year treasury yield ($TNX) tumbling from the 1.35% open to the 1.27% low reached just two hours later
- Falling yields are wearing on financials (XLF, -0.97%), today's worst performing sector; banks ($DJUSBK, -1.42%) are leading financials to the downside
- Technology (XLK, +0.33%) are performing best as renewable energy ($DWCREE, +1.64%) extends its Monday advance; software ($DJUSSW, +0.87%) is also strong
- Oracle Corp (ORCL, -4.01%) is a drag on the S&P 500, after reporting revenues below expectations
- Gambling stocks ($DJUSCA, -6.16%), a volatile industry, is under pressure today as China looks at tighter rules for Macau casino operators; the entire group is getting blitzed on the development
Market Outlook
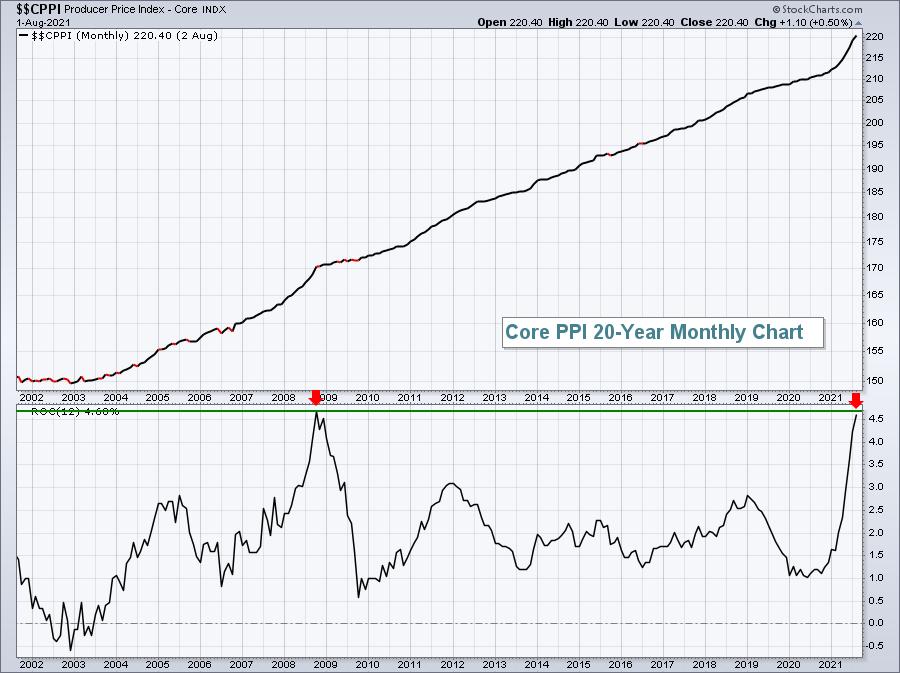
Inflation at the consumer level slowed this morning and came in below expectations, cooling all the hyper-inflation talk. On StockCharts, it's easy to chart inflation. Below are 20-year monthly charts for both core producer prices ($$CPPI) and core consumer prices ($$CCPI). A monthly chart should be used as the data is released on a monthly basis. I also use a line chart as candlestick charts are worthless when there's no intraday, intraweek, or intramonth activity. Finally, I add a "12 period" rate of chart indicator window at the bottom to track inflation on an annual basis. Here's what these two charts look like:
$$CPPI:
$$CCPI:
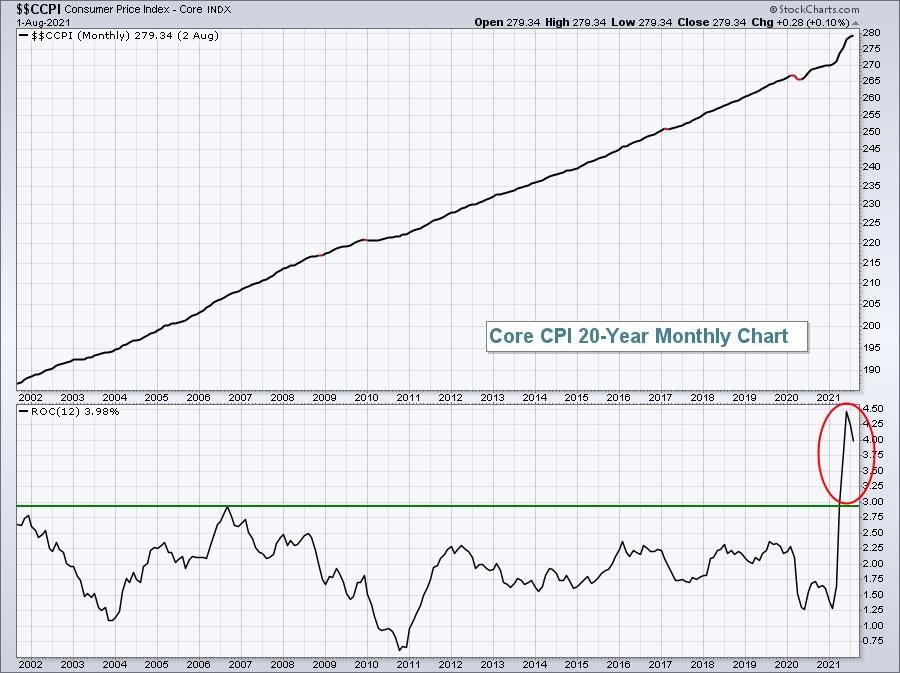
From the above, you can see that the core PPI has reached a level not seen since 2009. Core CPI, however, has exceeded any level this century and is triggering the inflation talk. But the rate of change (ROC) of the Core CPI has begun to turn lower and this morning's reading came in at just +0.1% - a nominal rate.
I don't believe inflation is problematic at either level and I fully expect that we'll see both return to the Fed's 2% target levels. If you look at both charts, that 2% level has been straddled for 20 years. Obviously, a return to a highly inflationary period would have dramatic consequences for U.S. equities. I just don't see it happening and this morning's lower-than-expected Core CPI just might have been the beginning of the end of the inflation talk.
Sector/Industry Focus
Despite a history of performing extremely well in September, transports ($TRAN) have yet to show any strength whatsoever in 2021. Here's the seasonality chart from 2013-2020 (current secular bull market):
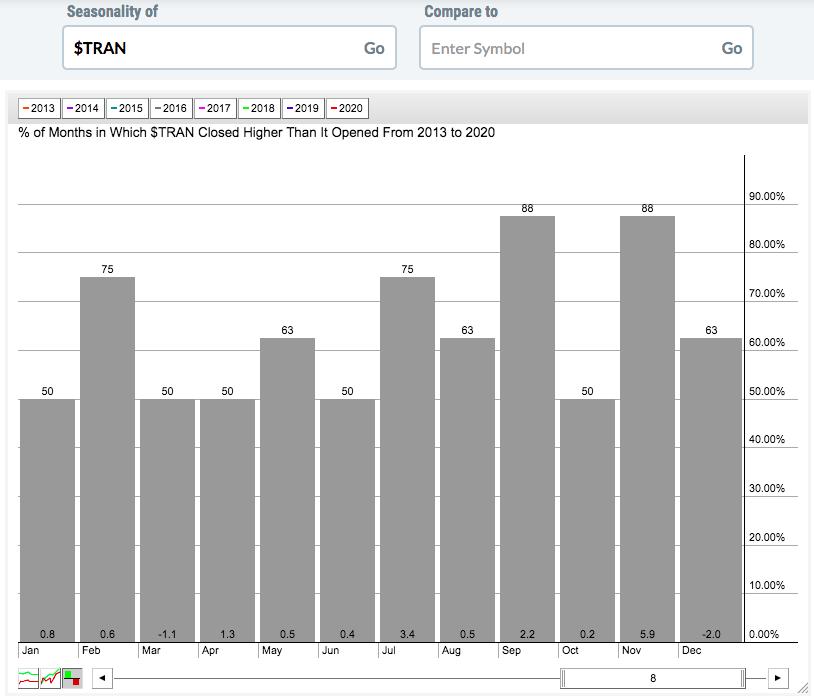
The TRAN has been lower during just one September in the past eight. September 2021, unless things change rather dramatically in the second half of the month, could be #2 out of 9:
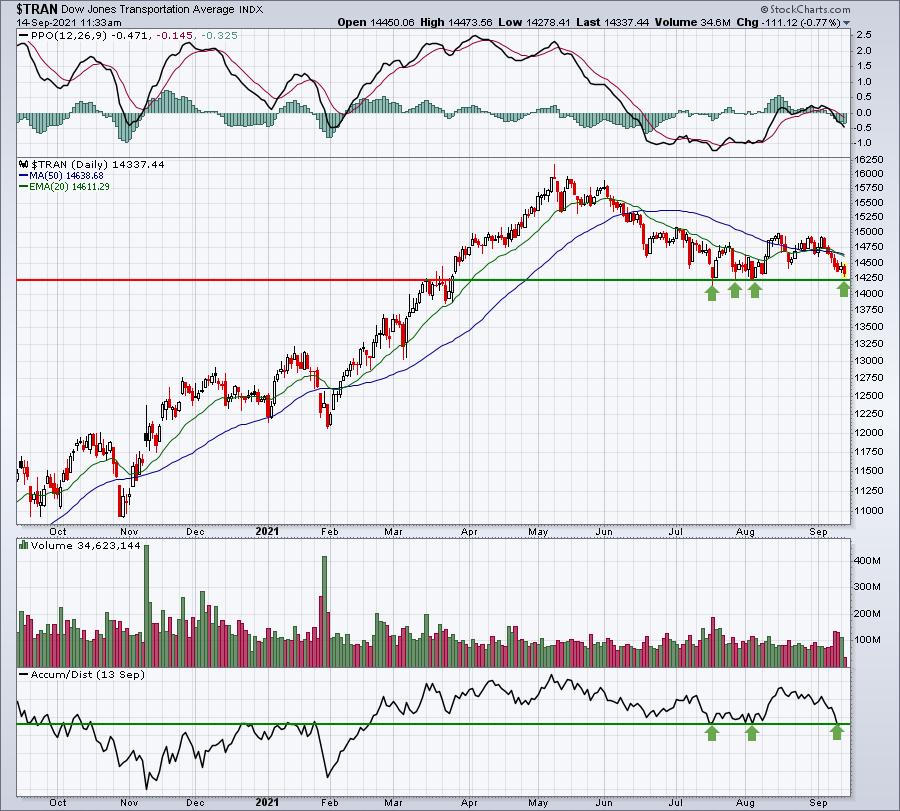
It sure seems like the TRAN needs to turn here from a technical perspective. The group is at a major price support level that's held on three prior occasions. The AD line also has seen recent support at its current level. Transports have a tendency to struggle more in the second half of September, so be very careful with the group if the support levels identified above are violated.
ChartLists/Strategies
Will transportation stocks hold, based on the chart above? If so, I wanted to peruse our various ChartLists to see stocks that we might want to consider on the long side - with a fairly tight stop in place, of course. Here's the scan syntax that I used:
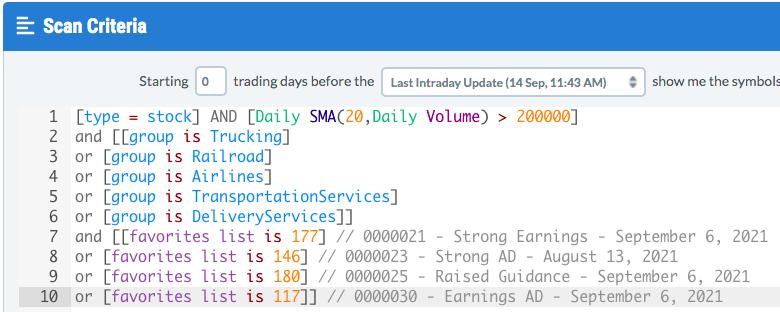
I added both transportation services ($DJUSTS) and delivery services ($DJUSAF) to the standard trio of transportation stocks. Also, if you copy this syntax into your SC account, it will NOT work. The "favorites list" comes from my StockCharts account. Your account won't recognize it. You need to select each of these ChartLists from your own drop-down menu.
Here are the results to the scan:
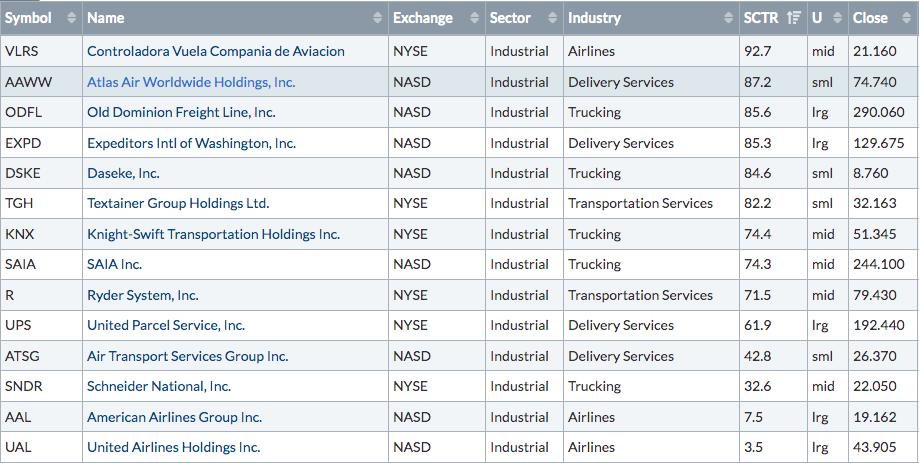
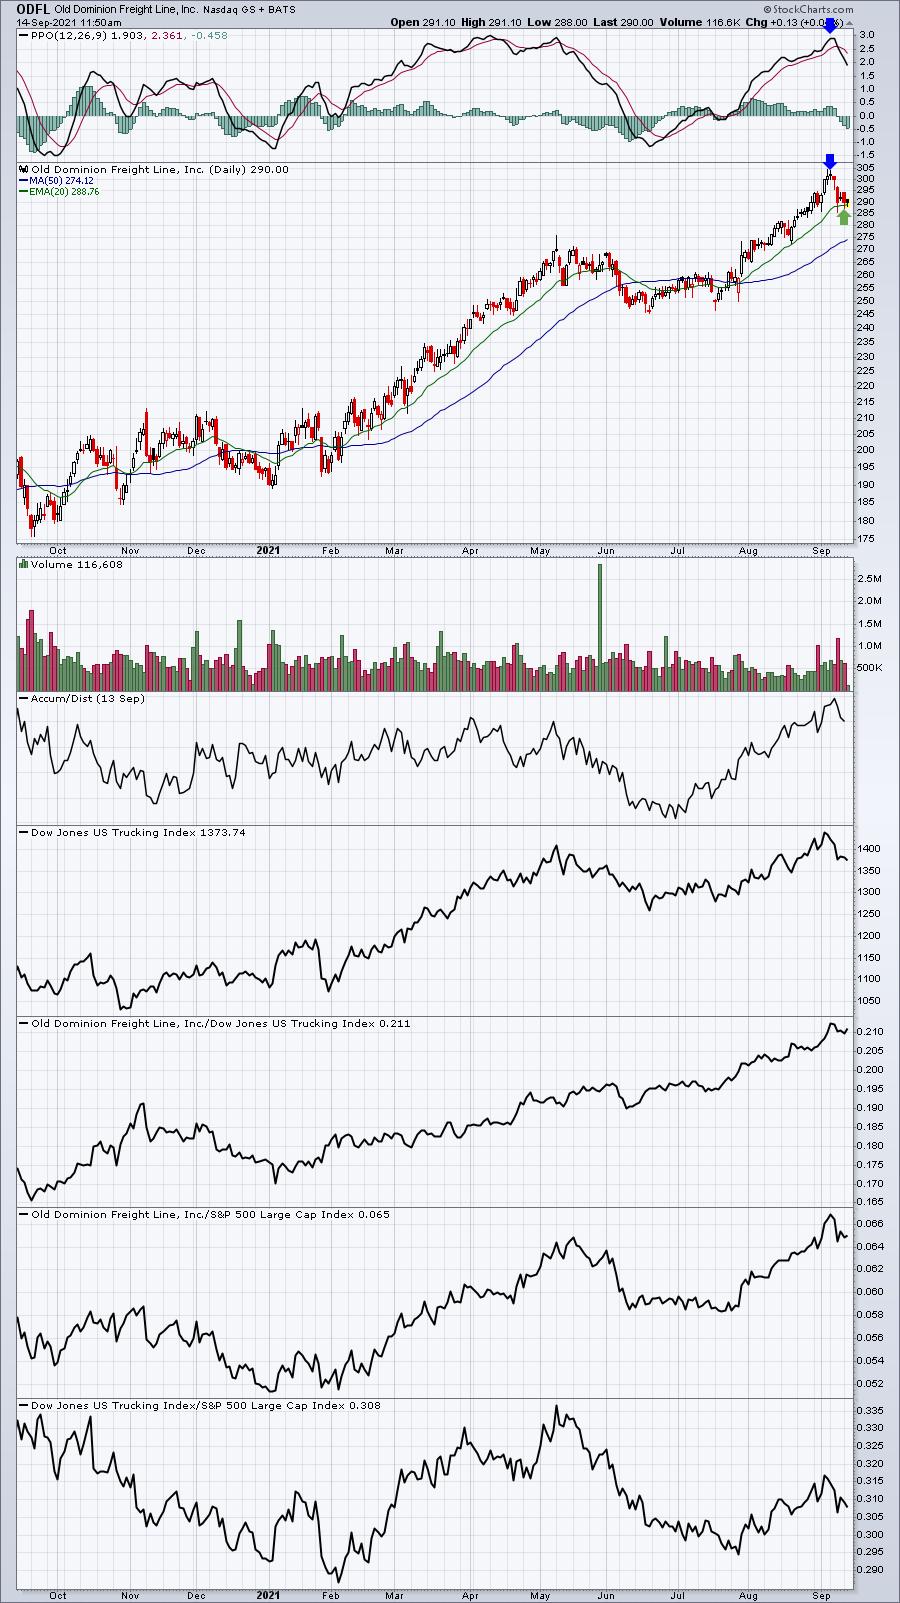
Here are the 3 stocks from the above list that are at or near key price or moving average support:
ODFL:
KNX:
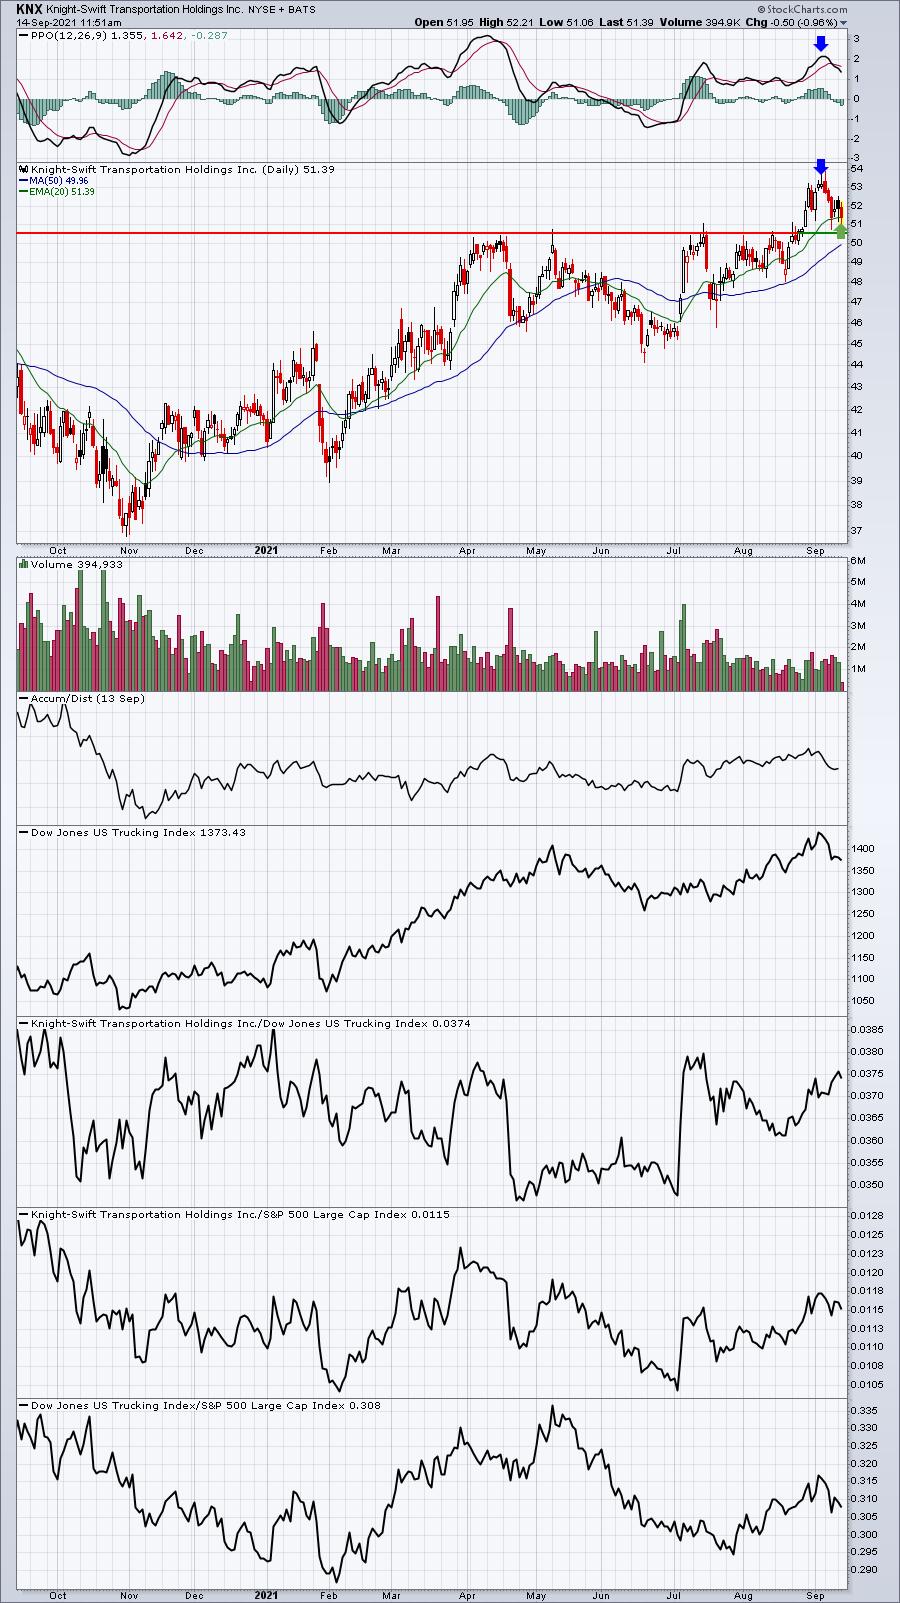
ODFL and KNX both had excellent PPOs at new highs at the time of their latest price highs. That suggests solid momentum, which is usually followed by successful 20-day EMA tests. If the TRAN is able to hold price support and rebound, I'd look for both ODFL and KNX to participate. If there is no rebound, consider keeping a closing stop just below the 20-day EMAs.
UAL:
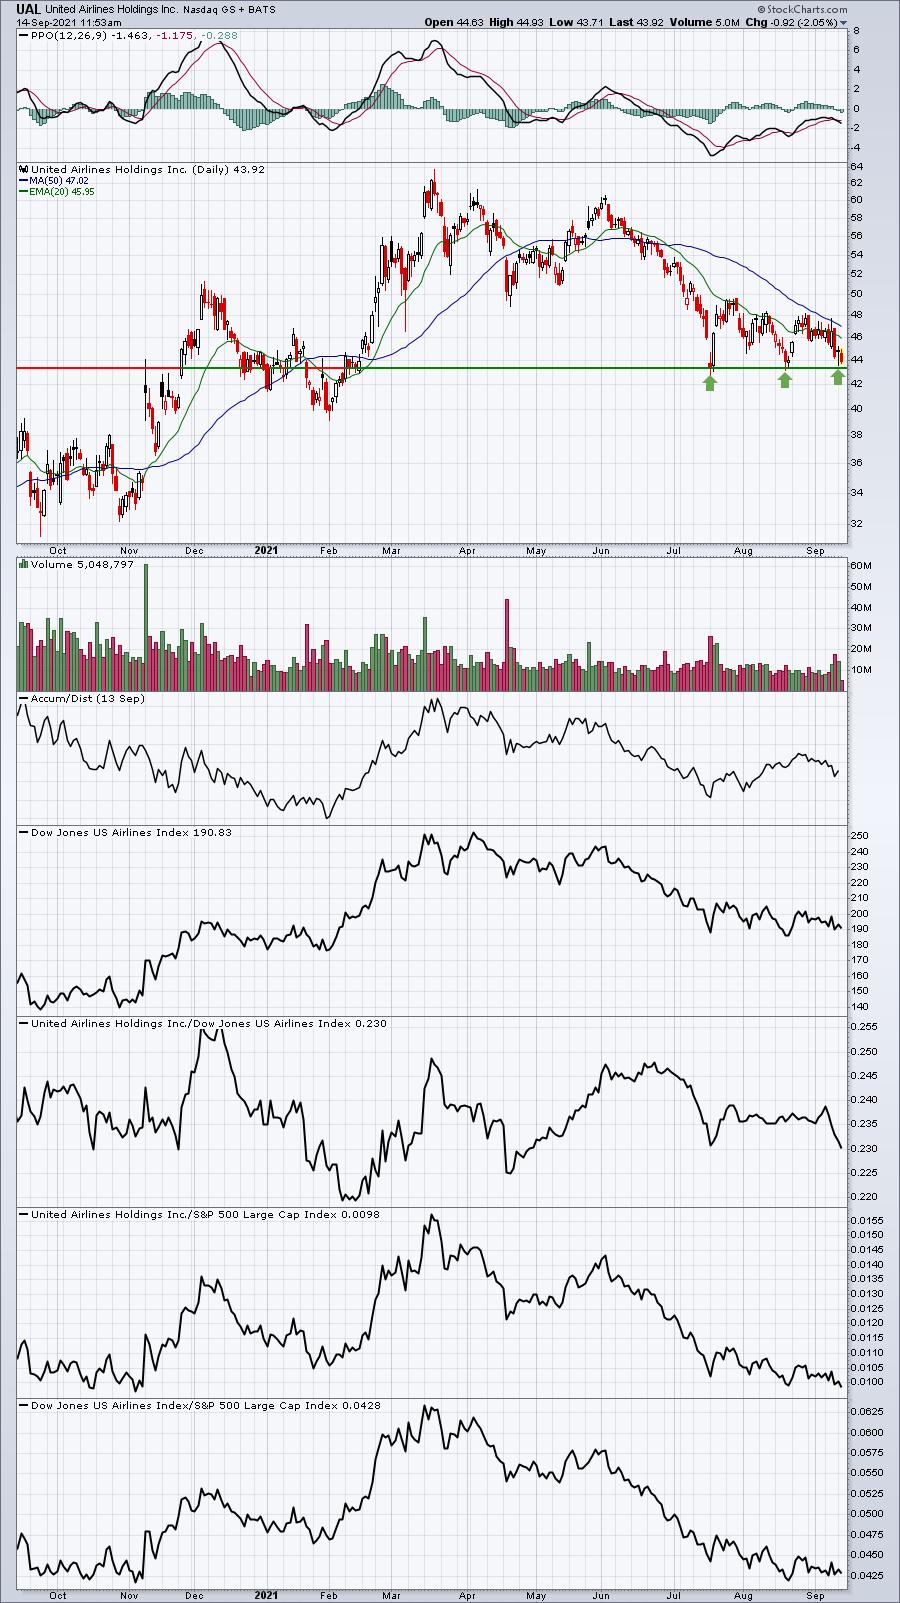
UAL has not been a good performer, but it has seen buyers return at 43.46, which is the closing stop I'd consider. Failure to hold that support level could easily result in a trip down to 40 to test the late-January price low.
Earnings Reports
Here are the key earnings reports for the next two days, featuring stocks with market caps of more than $10 billion. I also include a few select companies with market caps below $10 billion. Finally, any portfolio stocks that will be reporting results are highlighted in BOLD. If you decide to hold a stock into earnings, please understand the significant short-term risk that you are taking. Please be sure to check for earnings dates for any companies you own or are considering owning.
Tuesday, September 14:
FCEL
Wednesday, September 15:
JKS
Economic Reports
August CPI: +0.3% (actual) vs. +0.4% (estimate)
August Core CPI: +0.1% (actual) vs. +0.3% (estimate)
Happy trading!
Tom