
EB Daily Market Report - Wednesday, September 15, 2021
Executive Market Summary
- Futures were mostly flat with a bit of relative weakness on the Dow Jones
- Our major indices have all turned much more positive as the day has progressed
- Crude oil ($WTIC) is up nearly 3% to $72.50 per barrel; energy (XLE, +3.10%) is the leading sector as a result
- Industrials (XLI, +1.08%) and financials (XLF, +1.01%) are also strong as the 10-year treasury yield ($TNX) has jumped 4 basis points to 1.31%
- Communication services (XLC, -0.04%) is the only sector losing ground at the moment
- Gambling ($DJUSCA, -2.04%) is the weakest consumer discretionary group, extending Tuesday's decline
- Many energy names litter the top of the S&P 500 leaderboard; meanwhile, gambling stocks and Starbucks (SBUX, -4.40%) are weak
Market Outlook
I discuss transportation stocks ($TRAN) a lot and recently have talked about how September is typically kind to the group. It's also important to note that when the TRAN does well, so too does the S&P 500. There's a very strong positive correlation between the two and it makes perfect sense. When the U.S. economy is strengthening, or expected to strengthen, both transports and the S&P 500 should do well. More goods will be shipped and profits should grow.
Right now, however, the TRAN and the S&P 500 (on a weekly basis) is at its most INVERSE correlation as at any point in the past 100 years. That's a long time:
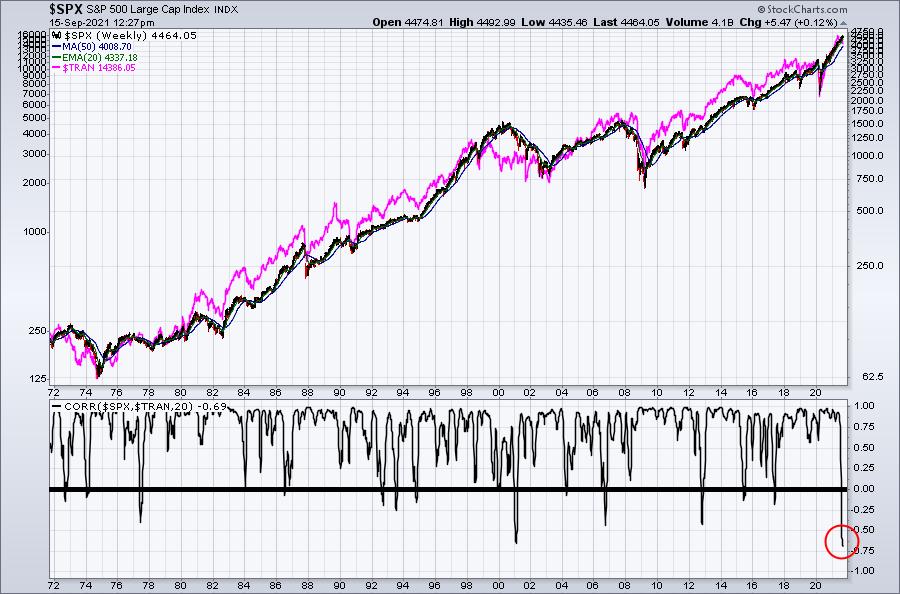
First, note that it is extremely RARE to see the SPX and the TRAN diverge for an extended period of time. Over the past 50 years, we have never seen another 20 week period where the correlation between these two have been more negative. Right now, though, it is a very short-term issue. The best way for me to illustrate the short-term nature is to bring up the same chart, but this time using a monthly chart. This way, the correlation will be measured over 20 months rather than 20 weeks. Check this out:
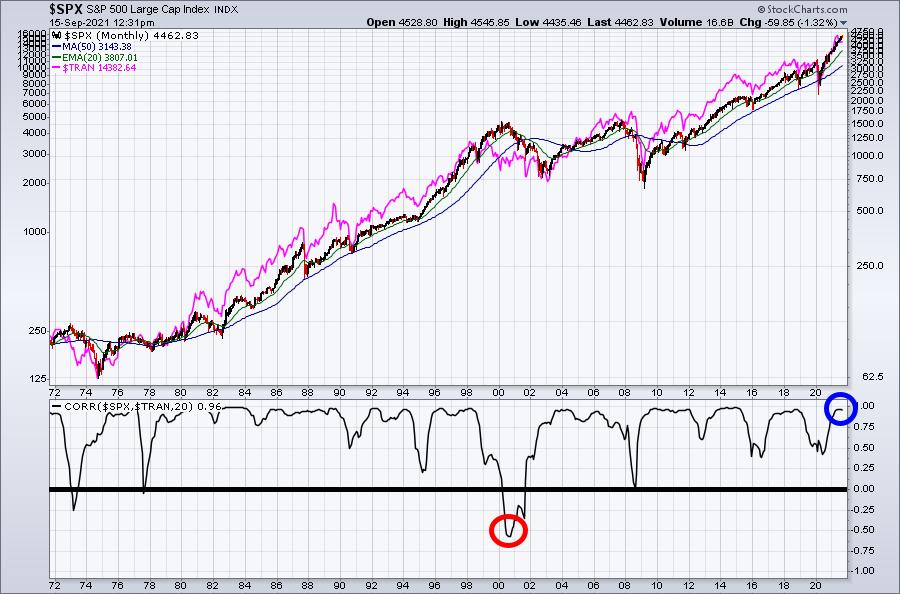
Monthly correlation is extremely POSITIVE. It's kind of strange, isn't it? But then I started thinking about it more. I believe the inverse correlation in 2000, which lasted much longer, was a MAJOR warning signal from the transport group. Currently, while transports are diverging from the S&P 500, it hasn't lasted long enough to impact the monthly chart. Should this "divergence" between transports and the S&P 500 continue for the next several months, it could certainly trigger a major warning sign for 2022. I've saved this chart and will revisit it at least monthly for the next several months.
I believe transportation, from a common sense perspective, is a group worth watching, because the performance here SHOULD BE highly correlated to the S&P 500. Anyway, while I don't have any earth-shattering predictions to be made at this point, I do believe this is a chart that we'll want to revisit.
Sector/Industry Focus
As a technical analyst, I have to enjoy humble pie, because it's served quite often. In 2021, humble pie has been routinely served for large parties. There's no such thing as a personal pan humble pie. Market rotation has played havoc throughout this year as charts look bullish one week, then bearish the next. I've said often it's been the most difficult year for trading that I can recall, unless your time frame is extremely short and your timing is impeccable. Humble pie was once again served the past two days. On Tuesday morning, on my Trading Places LIVE show at StockCharts.com, I discussed the improving look of the gambling index ($DJUSCA). Between yesterday and this morning, the DJUSCA has dropped in the neighborhood of 7-8%, yet another reminder of the extreme rotation that we're witnessing. Check out the chart:
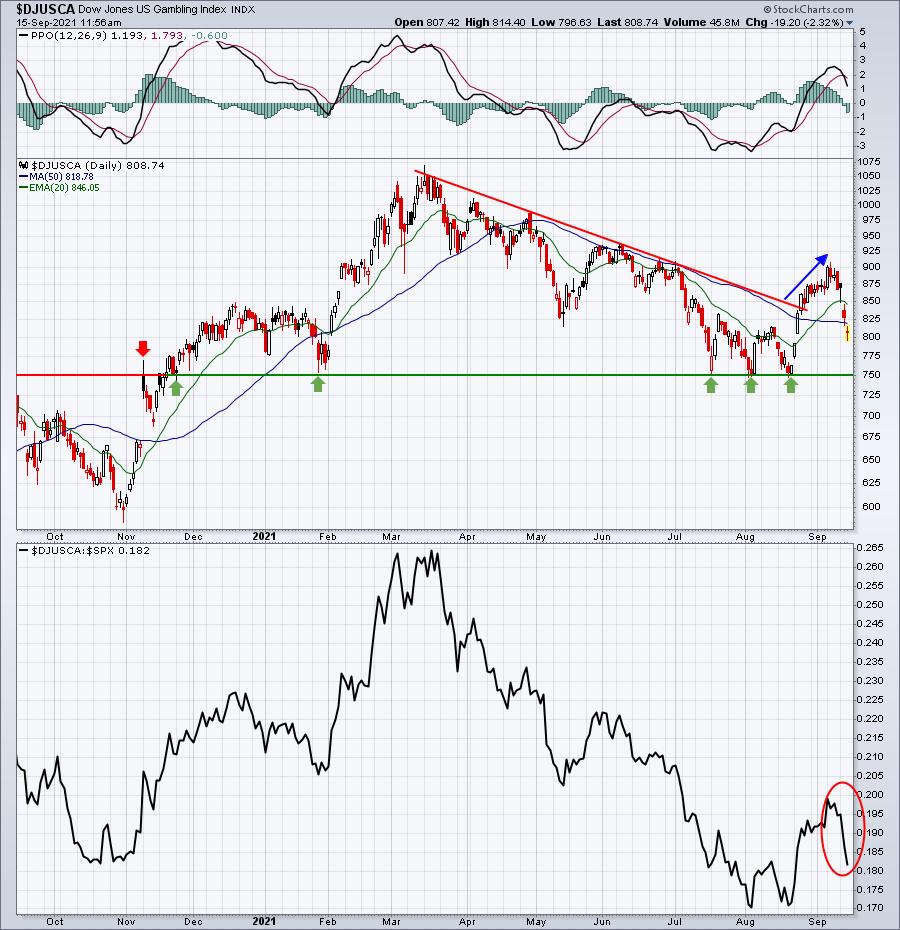
The bottom panel shows the improving relative strength of the group......and then the bottom fell out! 750 remains the most important price support level on the chart, but Monday's action was SO bullish. The daily PPO has been rising steadily, suggesting that the bulls were in total control of the short-term action. Monday's low tested the rising 20-day EMA and bounced perfectly. That's exactly what I expect to see when bullish momentum is positive and accelerating. But then Tuesday and this morning happened. We not only lost the 20-day EMA, but also the 50-day SMA. We've gone from an improving and increasingly bullish chart to a chart with multiple breakdowns in a little more than 24 hours. It's crazy and it underscores the dangers we continue to face.
False breakdowns occur in all market periods. It just seems as though these reckless moves are occurring with much more frequency in 2021.
ChartLists/Strategies
Here are two charts that could be suggesting bottoms have finally been found. We'll probably know by later this afternoon.
DOCU:
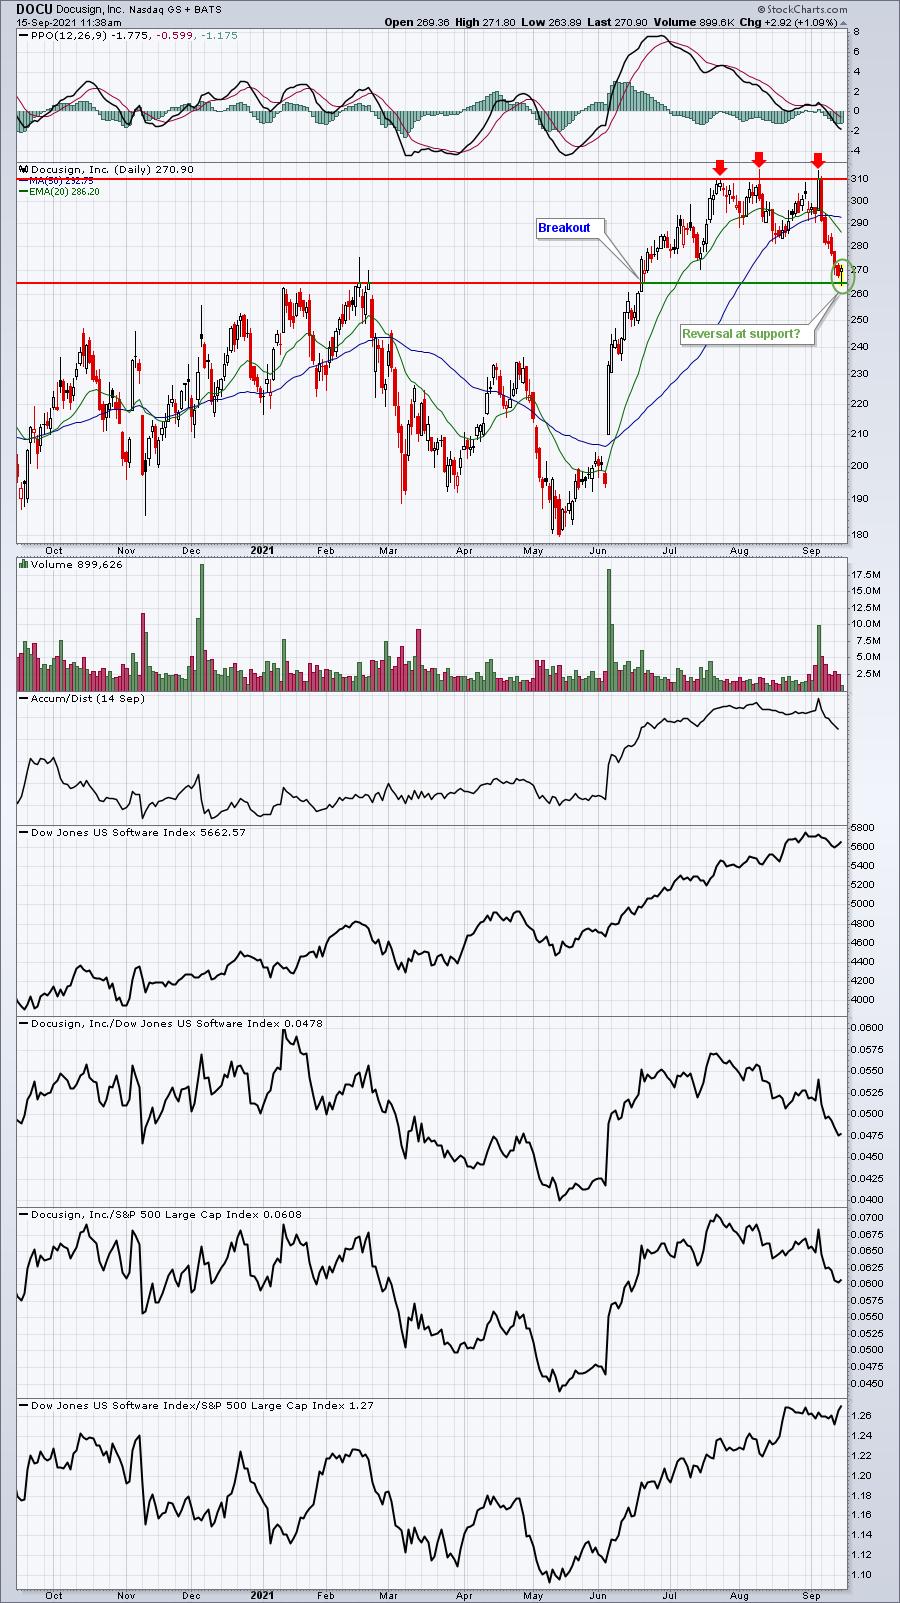
Since reporting solid quarterly results and shooting higher initially, DOCU hasn't been able to catch a bid over the past week, falling 14-15% in the process. But is today's intraday reversal signaling the start of a new uptrend?
(Disclosure: I own DOCU shares)
DVAX:
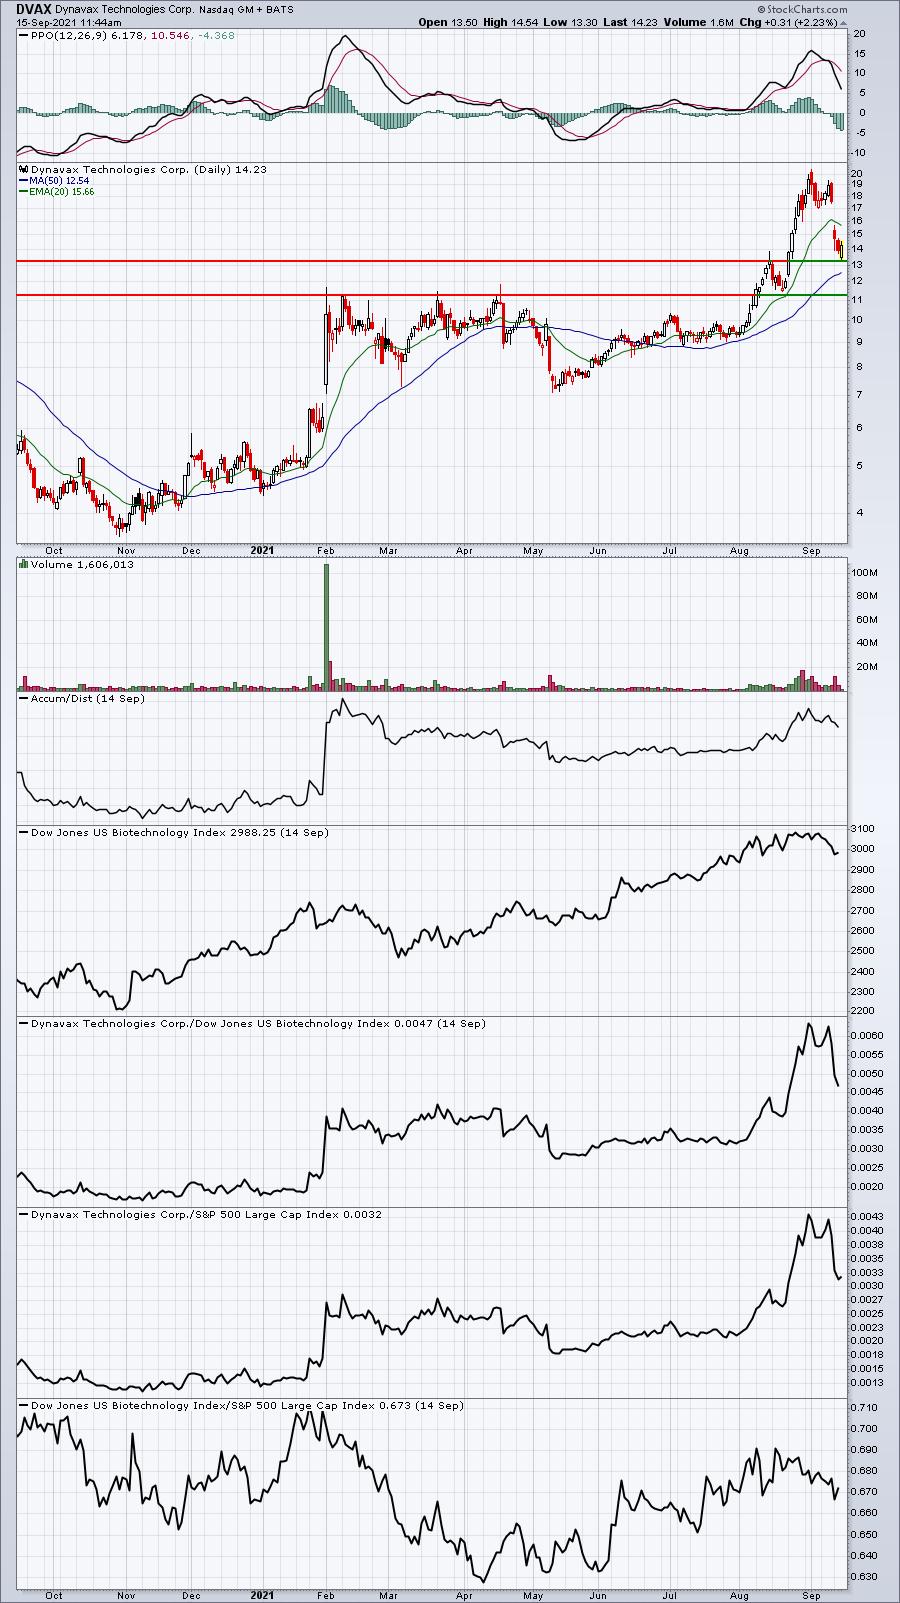
This is a biotech, so buyer beware, but DVAX certainly looks to have reached an area of price support where a reversal could take place. Is today's candle the start of such a reversal? Possibly, but volatility here could be extreme.
Earnings Reports
Here are the key earnings reports for the next two days, featuring stocks with market caps of more than $10 billion. I also include a few select companies with market caps below $10 billion. Finally, any portfolio stocks that will be reporting results are highlighted in BOLD. If you decide to hold a stock into earnings, please understand the significant short-term risk that you are taking. Please be sure to check for earnings dates for any companies you own or are considering owning.
Wednesday, September 15:
JKS
Thursday, September 16:
None
Economic Reports
September empire state manufacturing index: 34.3 (actual) vs. 18.6 (estimate)
August industrial production: +0.4% (actual) vs. +0.5% (estimate)
August capacity utilization: 76.4% (actual) vs. 76.4% (estimate)
Happy trading!
Tom