
EB Daily Market Report - Thursday, September 16, 2021
Executive Market Summary
- Futures were slightly lower overnight; after a brief move higher this morning, selling has continued in our major indices
- August retail sales were a big upside surprise, rising 0.7% while expectations were for a 0.8% drop
- The Philadelphia Fed manufacturing report was also way above expectations, following a similarly bullish outlook yesterday in the empire state manufacturing report
- The 10-year treasury yield ($TNX) is up nearly 3 basis points after these solid economic reports, with the dollar (UUP, +0.48%) moving to its highest level since August 27th
- The higher dollar is weighing on materials (XLB, -1.55%) and energy (XLE, -1.35%), today's two worst sectors
- All 11 sectors are lower; consumer discretionary (XLY, -0.22%) is the best relative performer
- Gap, Inc. (GPS, +2.66%), an apparel retailer ($DJUSRA, +1.08%), is the S&P 500's best performer today
Market Outlook
The U.S. Dollar (UUP), like everything else, can't seem to make up its mind on which direction it plans to go. However, with a couple of solid economic reports out this morning, especially the big beat on August retail sales, the dollar has at least made a short-term breakout:
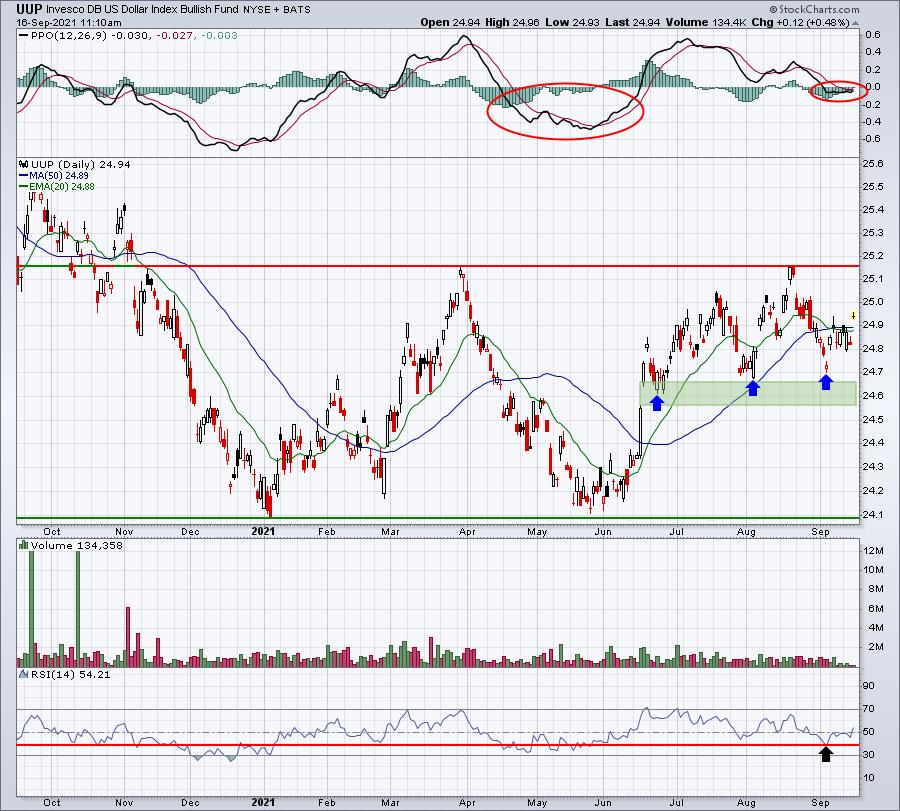
The blue arrows mark higher lows over the past 10 or so weeks. The black arrow shows the RSI bouncing off of 40, one characteristic of an uptrend. The red circles on the PPO highlight the inability to sustain positive momentum back in April and May vs. what appears to be the PPO turning back up this time as it remains just a tad below its centerline.
The big deal here is that IF the dollar continues to strengthen, that provides tremendous headwinds for both energy (XLE) and materials (XLB). The former is trying to break back above key price resistance at 50.50, but has been unable to. Given the dollar's strength today, the XLE and XLB are both retreating. Where the dollar goes from here will have a big impact on the relative strength/weakness of the XLE and XLB.
Sector/Industry Focus
Clothing & accessories ($DJUSCF, +1.01%) has been beaten up on a relative basis, but its absolute price uptrend remains untarnished:
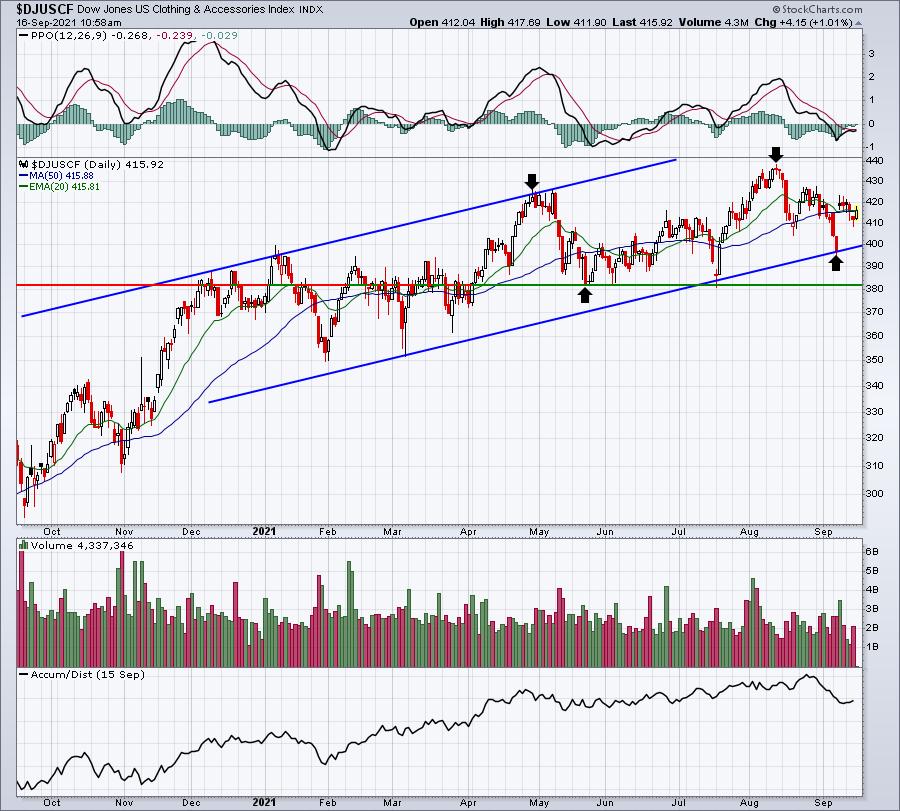
By connecting the recent price highs and then dragging that line below to connect lows, I established the current price channel that I'd monitor. The black arrows highlight the recent higher highs and higher lows that are the hallmarks of an uptrend. So the absolute price action has not been the problem here. It's been the relative price action:
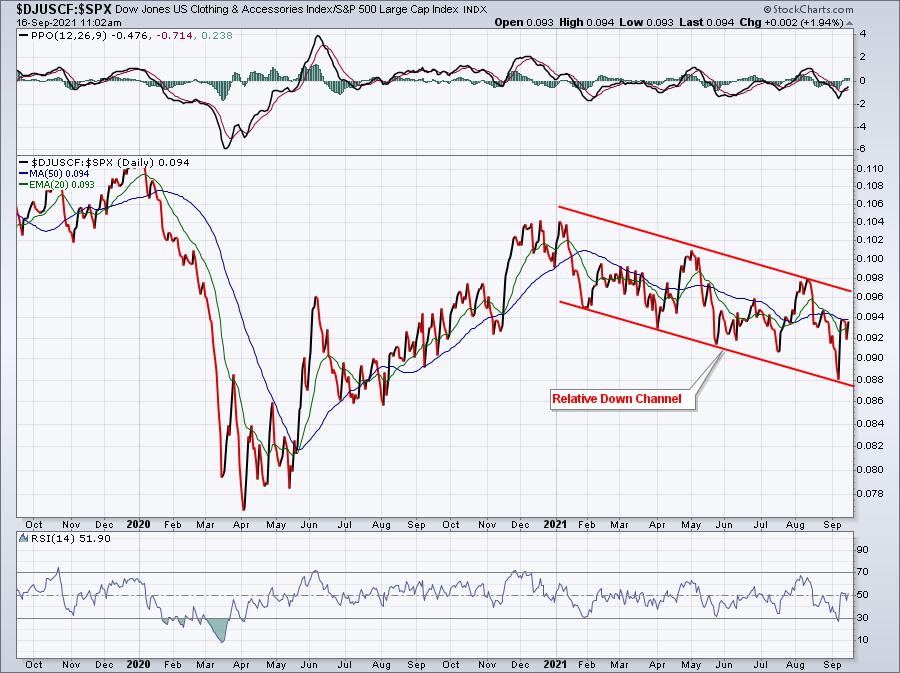
A break above the relative downtrend line resistance would be a BIG step towards restoring the DJUSCF's leadership role.
ChartLists/Strategies
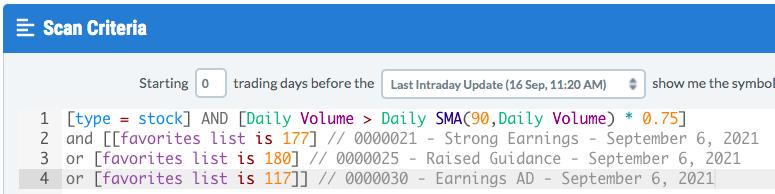
Since I'm sending out this DMR early today, it would be a great opportunity to feature our "high volume" scan from our website and run it against a few of our key ChartLists. I selected our Strong Earnings ChartList (SECL), Raised Guidance ChartList (RGCL), and Earnings AD ChartList, but you can run it against any of our ChartLists. Here was the scan syntax that I used:
And the results.....
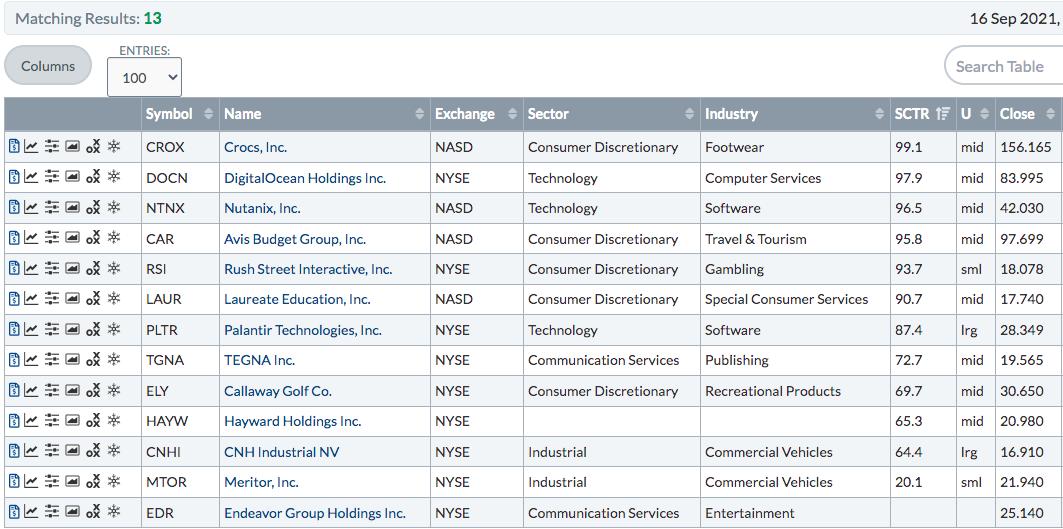
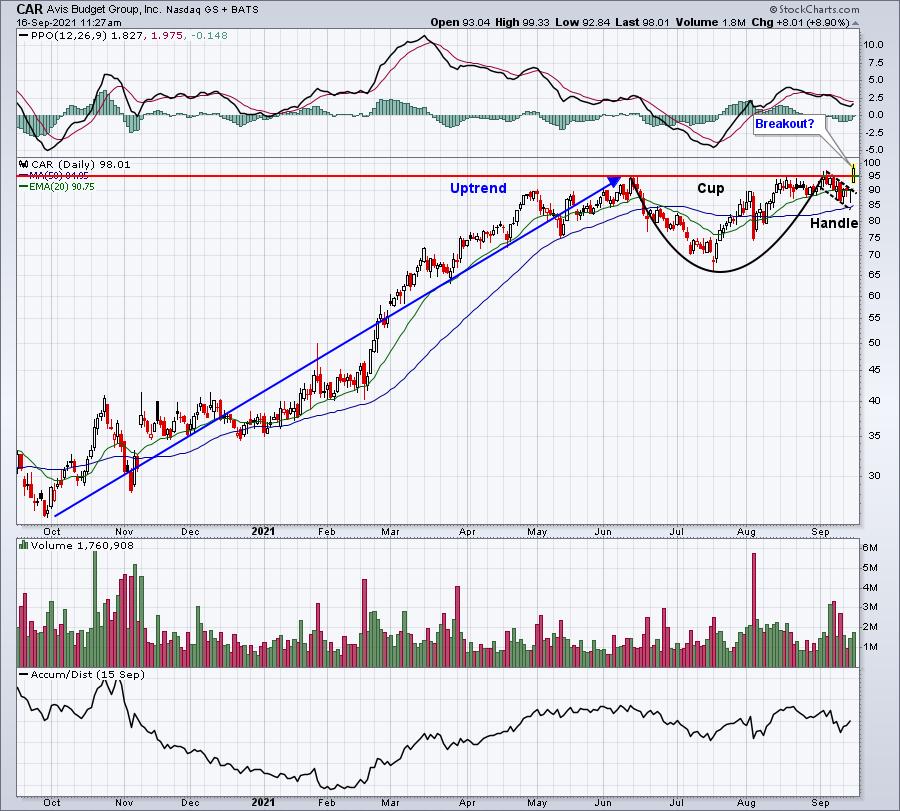
This doesn't mean these 13 stocks are great trades. It simply narrows the field down to those that are showing heavy volume today (75% of average volume over the past 90 days - in less than the first two hours of the trading day). Here are the two that grabbed my attention because of potential breakouts:
CAR:
PLTR:
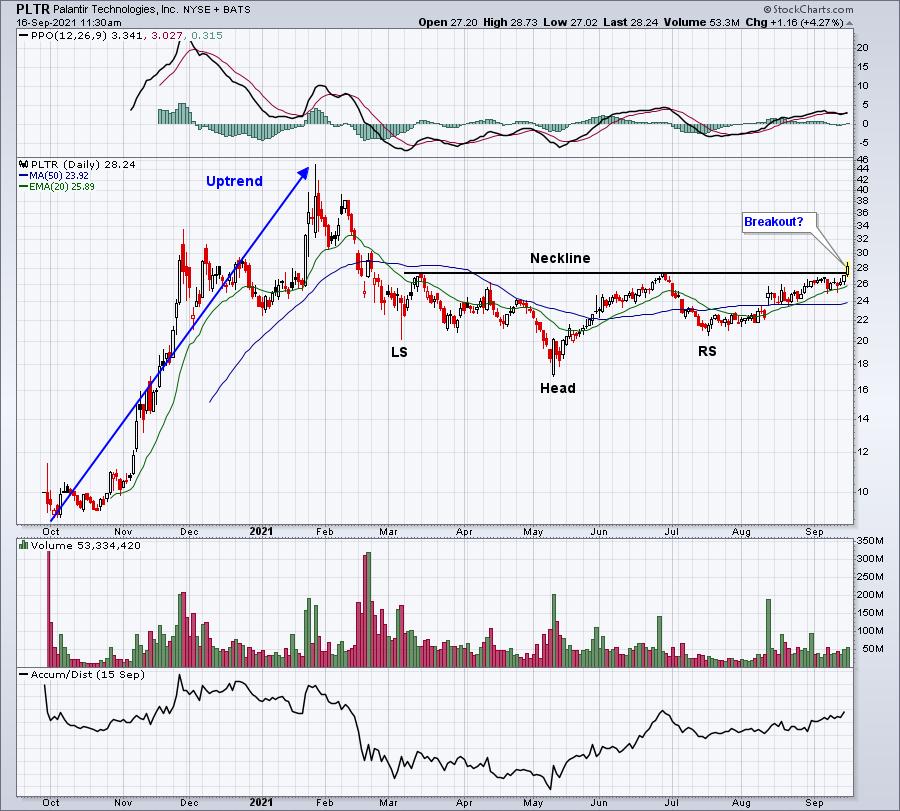
Neither of these two gapped above key price resistance. Instead, they've move through key resistance intraday. The difference between a breakout and a false breakout (which could lead to short-term weakness), is where these two stocks close. Because I ran this scan based on HIGH VOLUME, we know for sure that volume will confirm the breakout if price does at the close.
Earnings Reports
Here are the key earnings reports for the next two days, featuring stocks with market caps of more than $10 billion. I also include a few select companies with market caps below $10 billion. Finally, any portfolio stocks that will be reporting results are highlighted in BOLD. If you decide to hold a stock into earnings, please understand the significant short-term risk that you are taking. Please be sure to check for earnings dates for any companies you own or are considering owning.
Thursday, September 16:
None
Friday, September 17:
None
Economic Reports
Initial jobless claims: 332,000 (actual) vs. 315,000 (estimate)
September Philadelphia Fed manufacturing index: 30.7 (actual) vs. 19.2 (estimate)
August retail sales: +0.7% (actual) vs. -0.8% (estimate)
August retail sales less autos: +1.8% (actual) vs. -0.1% (estimate)
July business inventories: +0.5% (actual) vs. +0.5% (estimate)
Happy trading!
Tom