
EB Daily Market Report - Friday, September 17, 2021
Executive Market Summary
- Futures were lower overnight and all of our major indices are down, although small caps ($SML) are the clear relative leader today, down just 0.18% at last check
- The NASDAQ is currently down 1.18% by comparison
- September consumer sentiment was reported slightly below expectations
- Commodities have been struggling with the rising dollar (UUP), as the UUP is up again today
- Gold ($GOLD) has fallen roughly 4% since its failed triple top breakout earlier this month
- All 11 sectors are lower today with materials (XLB, -2.04%) leading the charge
- Technology (XLK, -1.49%) is also having a weak performance, led lower by computer hardware ($DJUSCR, -1.60%) and semiconductors ($DJUSSC, -1.51%)
- Volatility ($VIX) is higher by nearly 9% as selling has intensified; next week is the 2nd worst week of the year, so being a bit cautious makes sense
- Thermo Fisher (TMO, +7.81%) is today's top S&P 500 performer after securing FDA approval for a lung-cancer-related diagnostic
Market Outlook
I believe we should be looking at the next two weeks - the latter half of September - as a bridge. The S&P 500 has been quite strong year-to-date and Q4 tends to be extremely bullish - the October 27th through January 18th period has risen 60 of the last 71 years. We also tend to see S&P 500 prices rise in the 3 weeks leading up to the start of earnings season. I typically view that as September 28th through October 18th. But we KNOW that historically the second half of September can be quite challenging, if not downright bearish. The worst part of the second half begins at today's close, as the September 20th (Monday) through September 26th period has produced annualized returns of -38.89% on the S&P 500 since 1950. It's also the only 7-consecutive-day period throughout the entire year where the S&P 500 has produced negative annualized returns every day. Here are those negative annualized returns:
- September 20th (Monday): -32.07%
- September 21st (Tuesday): -53.77%
- September 22nd (Wednesday): -21.52%
- September 23rd (Thursday): -48.29%
- September 24th (Friday): -32.57%
September 25th and 26th will fall next weekend so they're irrelevant this year, but their annualized returns are -28.39% and -54.95%, respectively.
The S&P 500 is technically-challenged right now. Here's the latest hourly chart with key short-term price and trendline support levels highlighted:
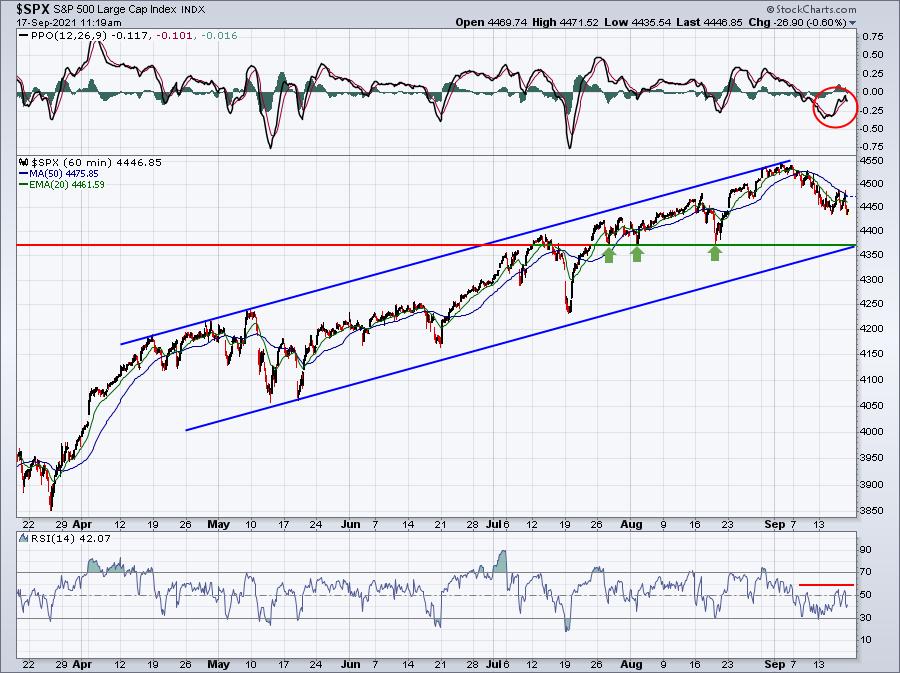
Signs that will point to this short-term period of weakness ending include (1) the hourly RSI moving back above 60, (2) the hourly PPO making a bullish centerline crossover, and (3) reaching key price and trendline support below 4400.
Sector/Industry Focus
Home improvement retailers ($DJUSHI) is the third best performing industry group today and it's reached a very meaningful price resistance level, so I wanted to highlight it:
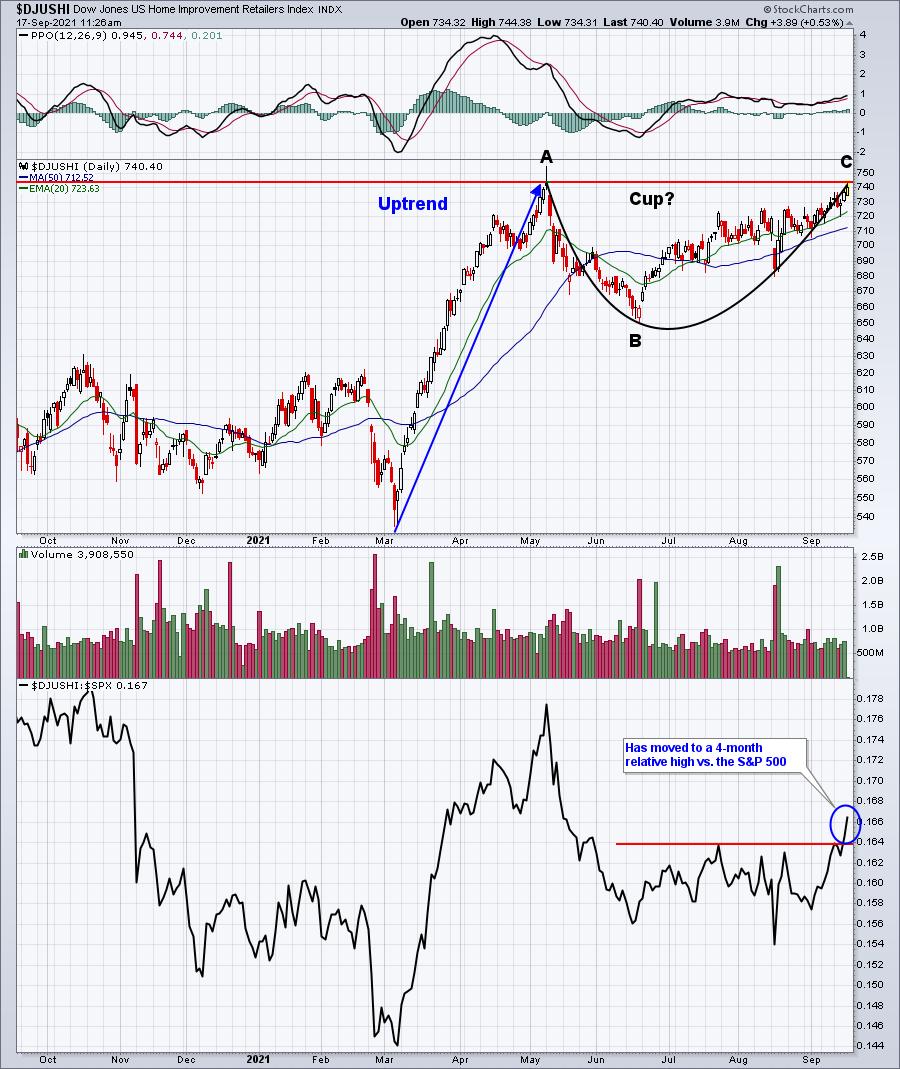
I like the relative strength here moving up to a 4-month high, but price resistance is just being tested. The chart looks bullish and we're in a secular bull market, so I look for bullish continuation patterns. In the case of the DJUSHI, one possible pattern could be a cup with handle. If that pattern materializes, we've likely just topped and will see a lighter volume handle print - perhaps down to test the rising 20-day EMA. If we see a steeper decline, the next low could mark Point D in a bullish A-B-C-D-E ascending triangle. The A, B, and C have been annotated on the chart to illustrate. This pattern would also assume that price resistance in the 740-750 range holds.
ChartLists/Strategies
Personally, I've raised cash this week, especially over the past 24 hours as all of our September max pain long candidates have rebounded and pushed higher (the short candidates have not worked very well). Heading into one of the most bearish historical periods doesn't have me overly excited to take on new positions. It's quite possible that the market ignores historical tendencies and moves higher next week. That's happened plenty of times before. Selling next week is not a slam dunk, it's simply a tendency.
For now, though, I am avoiding new trades.
Earnings Reports
Here are the key earnings reports for the next two days, featuring stocks with market caps of more than $10 billion. I also include a few select companies with market caps below $10 billion. Finally, any portfolio stocks that will be reporting results are highlighted in BOLD. If you decide to hold a stock into earnings, please understand the significant short-term risk that you are taking. Please be sure to check for earnings dates for any companies you own or are considering owning.
Friday, September 17:
None
Monday, September 20:
LEN, CGNT
Economic Reports
September consumer sentiment: 71.0 (actual) vs. 72.0 (estimate)
Happy trading!
Tom