
EB Daily Market Report - Tuesday, September 21, 2021
Executive Market Summary
- Futures were very strong overnight and our major indices opened higher this morning
- Today's strength is coming primarily from real estate (XLRE, +1.17%) and consumer discretionary (XLY, +0.77%); 10 of 11 sectors are higher, however
- Industrials (XLI, -0.19%) is the only sector trading lower mid-day
- Airlines ($DJUSAR, -1.00%), one of the strongest areas during Monday's selloff, is reversing lower today
- Travel & tourism ($DJUSTT, +4.16%) is, by far, the best performing industry group within consumer discretionary - more on this below
- Commodities are mixed, but we're seeing strength in crude oil prices ($WTIC, +0.23%) and gold ($GOLD, +0.73%)
- The 10-year treasury yield ($TNX) is up 1 basis point to 1.32% just 24 hours ahead of tomorrow's FOMC policy statement
Market Outlook
Travel & tourism ($DJUSTT) has suddenly become relevant again as we've seen bullish absolute and relative price action the past few weeks:
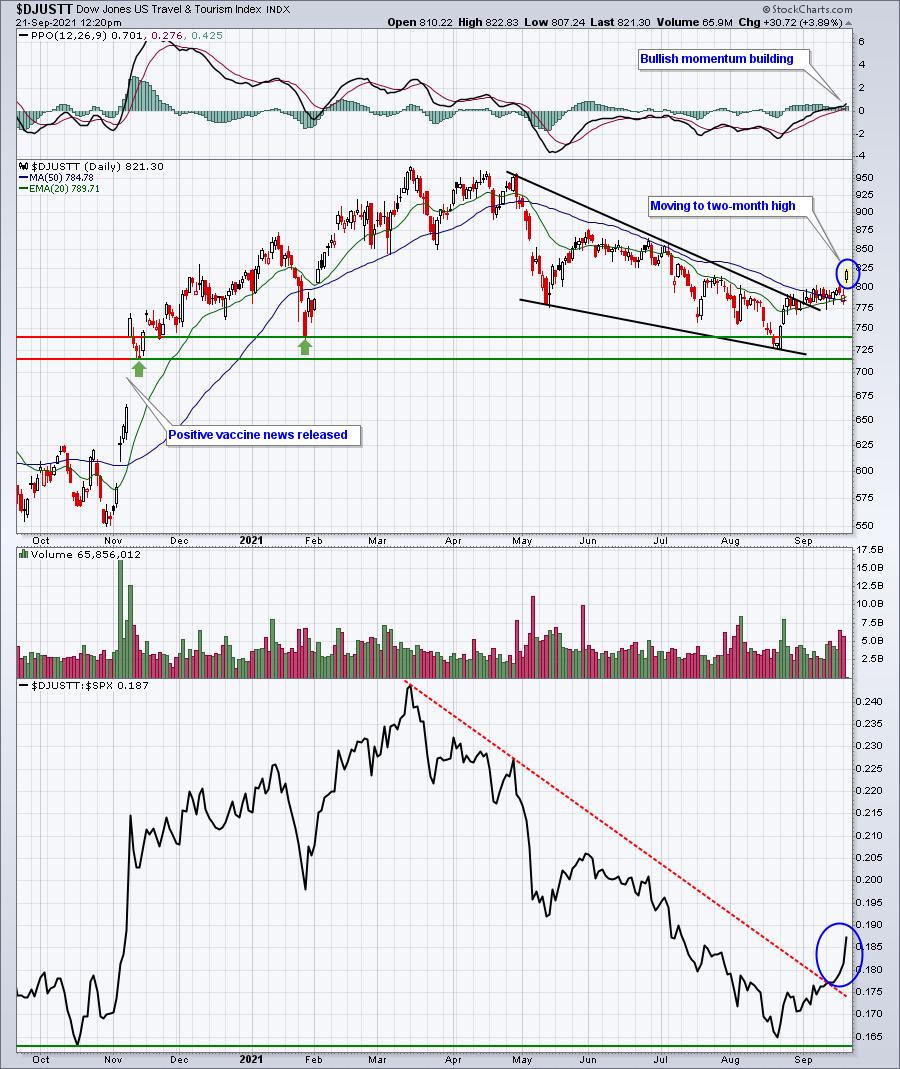
When the bull market resumes, we could have a new relative leader emerging in the travel area. The past month's behavior has been very encouraging and after a healthy advance following the positive vaccine news in November, I see a bullish wedge that's led to the recent relative underperformance. That has now broken, though, so I'd look for continuing leadership into Q4.
Sector/Industry Focus
Housing starts and building permits were both very strong this morning, exceeding estimates. Whether that translates into an improving home construction ($DJUSHB) area, however, remains to be seen. Here's the current chart of the DJUSHB, with key price support annotated:
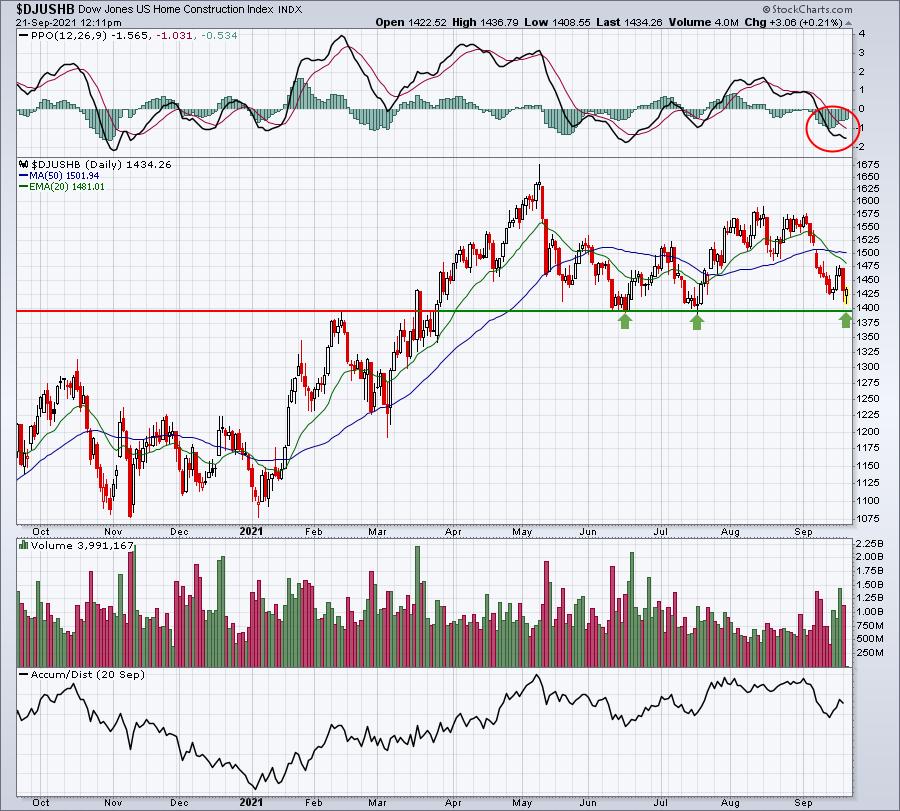
Rates remain extremely low, which should help this industry. But we still need to listen to the charts. Currently, the DJUSHB is ok. Whether or not the support level near 1400 holds will be a very important technical clue for us. I would guess it holds, but I'd listen to Wall Street if the breakdown occurs.
ChartLists/Strategies
I wasn't working off of any of our ChartLists, instead just viewing a lot of charts. Here are two that, in my opinion, have reached critical areas of support:
FCX:
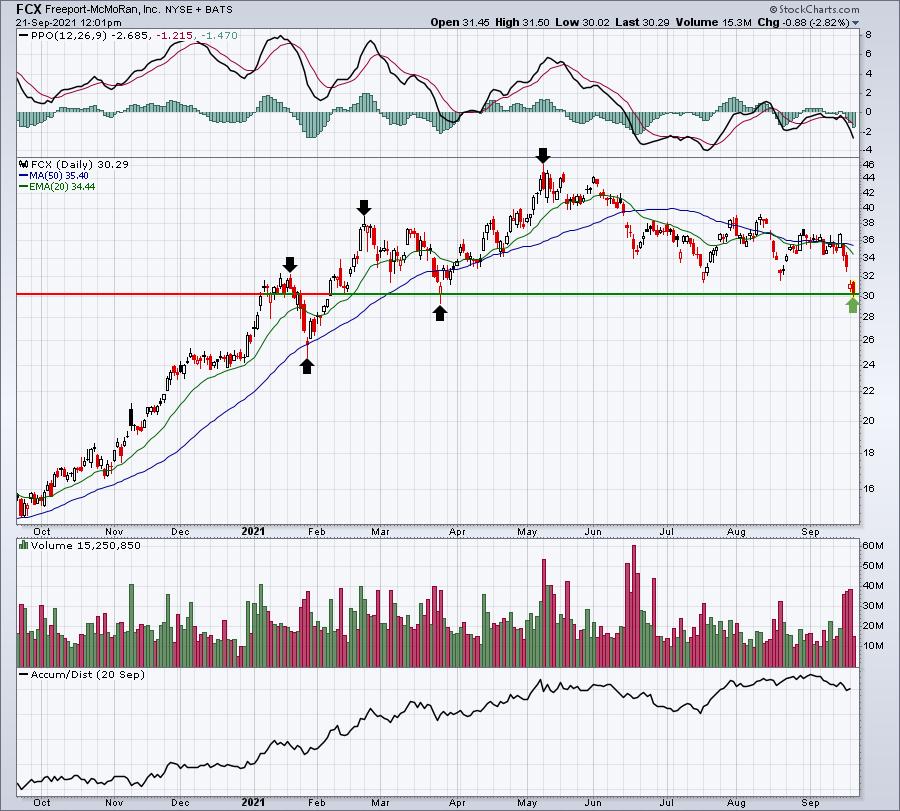
The AD line doesn't look bad and the uptrend is at stake at the 30 level. The black arrows above mark the higher highs and higher lows that define an uptrend. Losing 30 price support would be very damaging technically. While I'm not a big fan of commodities, or commodity stocks, I'd expect FCX to hold this price support level.
OSK:
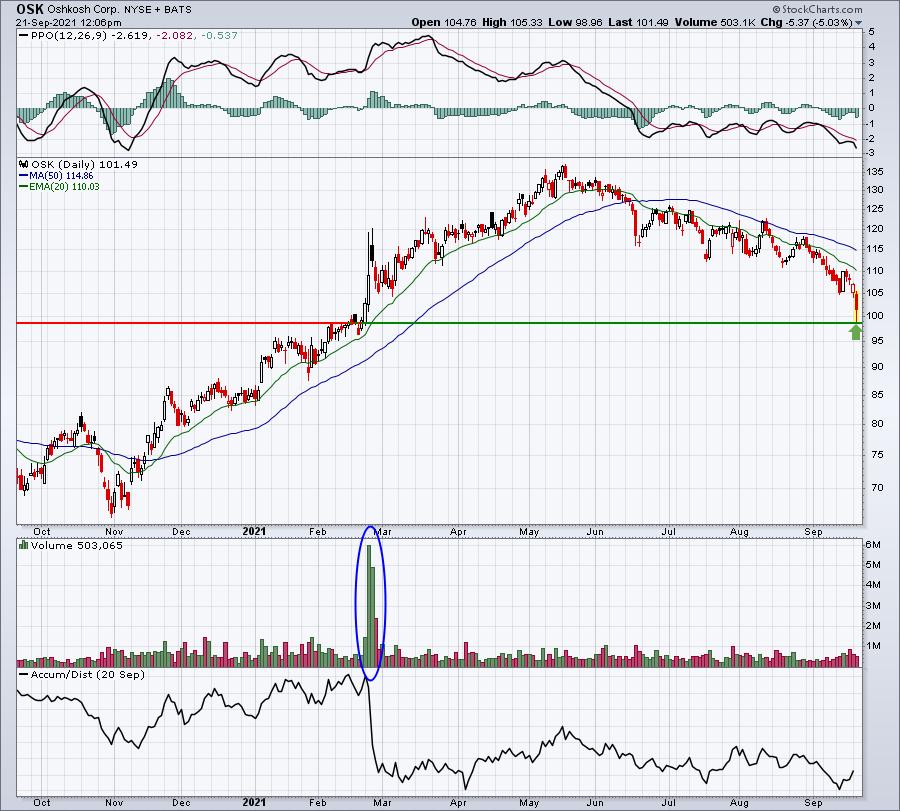
You can see a much different technical picture here. Clearly, OSK is downtrending. However, a TON of buyers emerged on the stock from the 99 level back in February. It certainly appears as if the buyers are re-emerging at that same level. There will be lots of work to do technically that will include clearing both its 20-day EMA and 50-day SMA, but this is the level where it needs to happen.
Earnings Reports
Here are the key earnings reports for the next two days, featuring stocks with market caps of more than $10 billion. I also include a few select companies with market caps below $10 billion. Finally, any portfolio stocks that will be reporting results are highlighted in BOLD. If you decide to hold a stock into earnings, please understand the significant short-term risk that you are taking. Please be sure to check for earnings dates for any companies you own or are considering owning.
Tuesday, September 21:
ADBE, FDX, AZO, SFIX, CBRL, ACB, APOG
Wednesday, September 22:
GIS, BB, KBH, FUL, SCS
Economic Reports
August housing starts: 1,615,000 (actual) vs. 1,575,000 (estimate)
August building permits: 1,728,000 (actual) vs. 1,610,000 (estimate)
Happy trading!
Tom