
EB Daily Market Report - Wednesday, September 22, 2021
ChartLists Updated
I just want to let everyone know that we've updated several ChartLists over the past few days. Each of the following have been updated:
- Strong Earnings ChartList (SECL)
- Strong Future Earnings ChartList (SFECL)
- Short Squeeze ChartList (SSCL)
- Earnings AD ChartList (EADCL)
- Strong AD ChartList (SADCL)
The last two were just updated this morning. If they're not posted to the website, check back in later today or first thing tomorrow morning and you should be able to get the latest.
StockCharts.com members (Extra or Pro) can download our ChartLists directly into their StockCharts.com accounts using the passwords that we provide for each ChartList. Basic StockCharts.com members and StockCharts.com non-members can view our ChartLists, but won't be able to download them. Using our service does not require a StockCharts.com membership, but I would encourage it.
Executive Market Summary
- Futures were strong overnight and we saw gaps higher across our major indices
- Small caps ($SML, +1.67%) and mid caps ($MID, +1.42%) are leading today on a relative basis among the key indices
- The Federal Reserve will release its latest policy statement in minutes (at 2pm ET)
- I'm expecting no change in interest rates, but market participants will scrutinize Fed Chair Powell's statement for any hints as to when bond purchases will be tapered
- Commodities are higher today as the dollar (UUP) consolidates its recent gains
- Crude oil prices ($WTIC, +2.17%) have jumped back to $72 per barrel
- FedEx Corp (FDX, -8.61%) badly missed its quarterly EPS estimate and is currently the worst performer on the S&P 500
- Energy (XLE, +3.78%) is today's big sector winner as 10 of 11 sectors gain ground; communication services (XLC, -0.02%) is the only sector in negative territory
Market Outlook
It's Fed day. I wrote an article yesterday that summarizes how the S&P 500 has performed in the wake of the last 10 Fed policy statements. You can CLICK HERE to read the article, "Here's How Wall Street Has Reacted To The Fed The Last 10 Meetings", if you haven't already. History suggests that we'll probably see back and forth action this afternoon and over the next few days as market participants digest the latest FedSpeak.
Here is the short-term support and resistance to watch on the S&P 500:
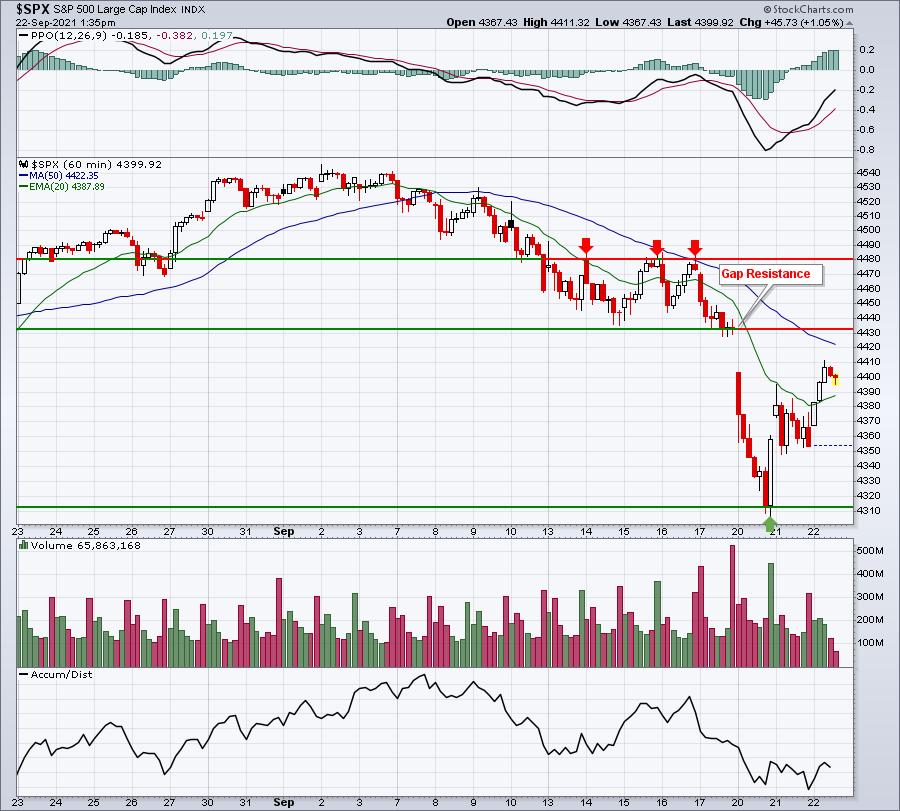
Most short-term (1 to 5 days) reactions to the Fed over the past year have been contained within 1-2% of the price at the time of the announcement. The support/resistance lines drawn above are within that 1-2% parameter, so let's see if this month is any different from the last. The only month where we saw a decline of more than 2% was September 2020. Could September 2021 be similar? It's certainly a possibility. Personally, I'll be mostly watching the action the next 2-3 days. If I trade, it'll be with much-smaller-than-normal position sizes. I don't need to be a hero.
Sector/Industry Focus
If there's been one bullish development over the past week as equity prices have sold off, it's been the relative performance of consumer discretionary stocks (XLY). We still have the same gap and price resistance to deal with, but as prices have been moving lower, check out the relative performance of consumer discretionary vs. the benchmark S&P 500 (XLY:$SPX):
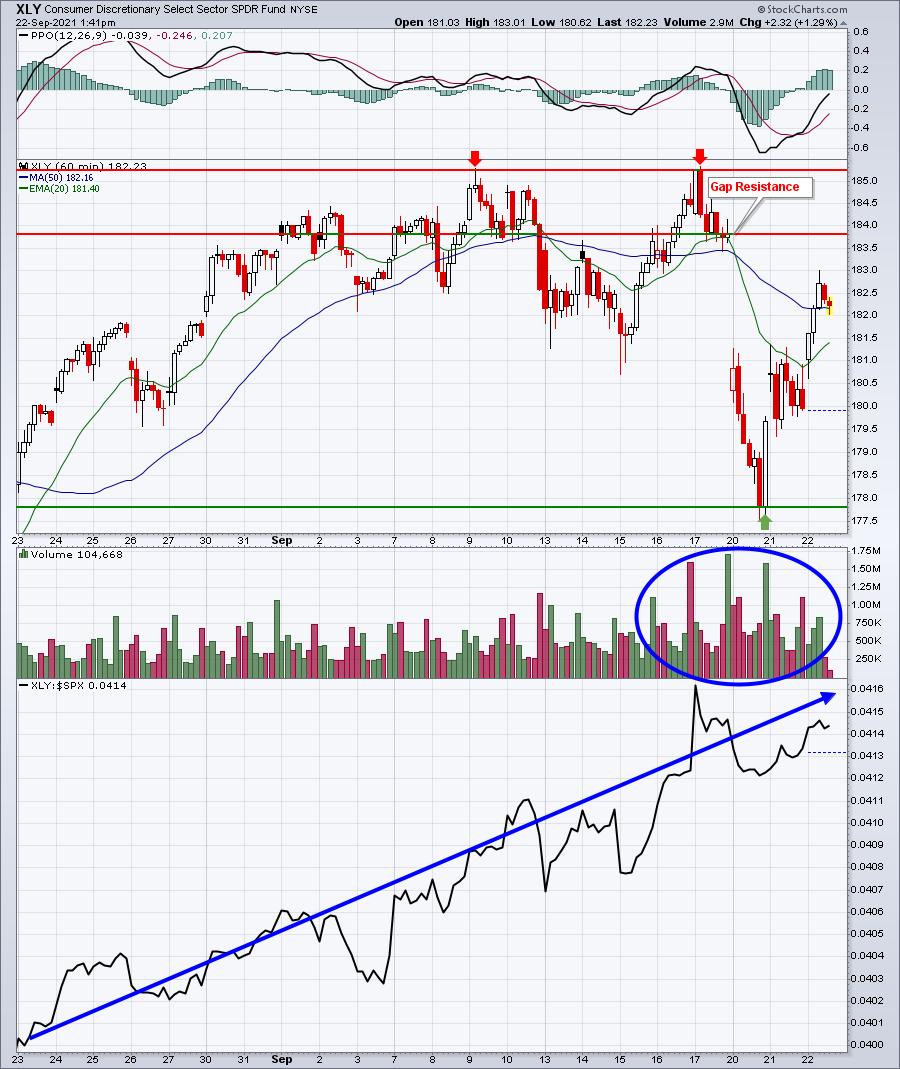
While some may be calling for stock market armageddon, the relative performance of consumer discretionary suggests to me that Wall Street is accumulating the group ahead of Q4 - a very bullish sign.
ChartLists/Strategies
Trading today is akin to playing with fire. Expect knee-jerk reactions in both directions. I'll continue to watch the market for relative strength, planning my trading strategy ahead and doing very little trading now. Accordingly, I'm going to avoid discussing potential short-term trades. It's dangerous and we have no idea what kind of reaction we're going to see this afternoon. Remember, the second worst week of the year, September 20th through September 26th, is upon us.
Safety first.
Earnings Reports
Here are the key earnings reports for the next two days, featuring stocks with market caps of more than $10 billion. I also include a few select companies with market caps below $10 billion. Finally, any portfolio stocks that will be reporting results are highlighted in BOLD. If you decide to hold a stock into earnings, please understand the significant short-term risk that you are taking. Please be sure to check for earnings dates for any companies you own or are considering owning.
Wednesday, September 22:
GIS, BB, KBH, FUL, SCS
Thursday, September 23:
NKE, ACN, COST, DRI, TCOM, MTN, DAVA, PRGS, AIR, RAD
Economic Reports
August existing home sales: 5,880,000 (actual) vs. 5,900,000 (estimate)
Happy trading!
Tom