
EB Daily Market Report - Thursday, September 23, 2021
ChartLists Updated
2 more ChartLists have been updated. The Strong ETF ChartList (SETFCL) and Raised Guidance ChartList (RGCL) were updated this afternoon. You should be able to get these updates on our website this afternoon or later this evening.
Executive Market Summary
- Futures were solid for a second straight day and our major indices are higher on the session
- Mostly weaker-than-expected economic data has not slowed the bulls as they're using weakness from earlier in the week as an opportunity
- The 10-year treasury yield ($TNX) is soaring today, up 7 basis points to 1.40%
- Energy (XLE, +3.52%) and financials (XLF, +2.72%) are the top two performing sectors today, with the latter benefiting from the rising treasury yields
- Crude oil ($WTIC) has jumped 1.56% to $73.36 per barrel, aiding the energy group
- A weak dollar (UUP, -0.42%) is also helping both energy and materials (XLB, +1.94%)
- Energy stocks (APA, DVN, SLB) and cruise lines (NCLH, CCL) dominate the S&P 500 leaderboard
- Nike (NKE, +1.28%) and Costco (COST, +0.11%) report their quarterly earnings after the bell today
Market Outlook
We're seeing strength in treasury yields, which is a very bullish development for U.S. equities. Common sense might suggest that higher rates are bad for the economy, but quite honestly, the opposite is true. The fact that the Fed has suggested they may want to raise rates earlier than expected tells me that future and increasing economic strength is the likely culprit. That leads to higher profits and rising equity prices. Below is a chart that helps to illustrate the positive correlation between the S&P 500 and 10-year treasury yield ($TNX):
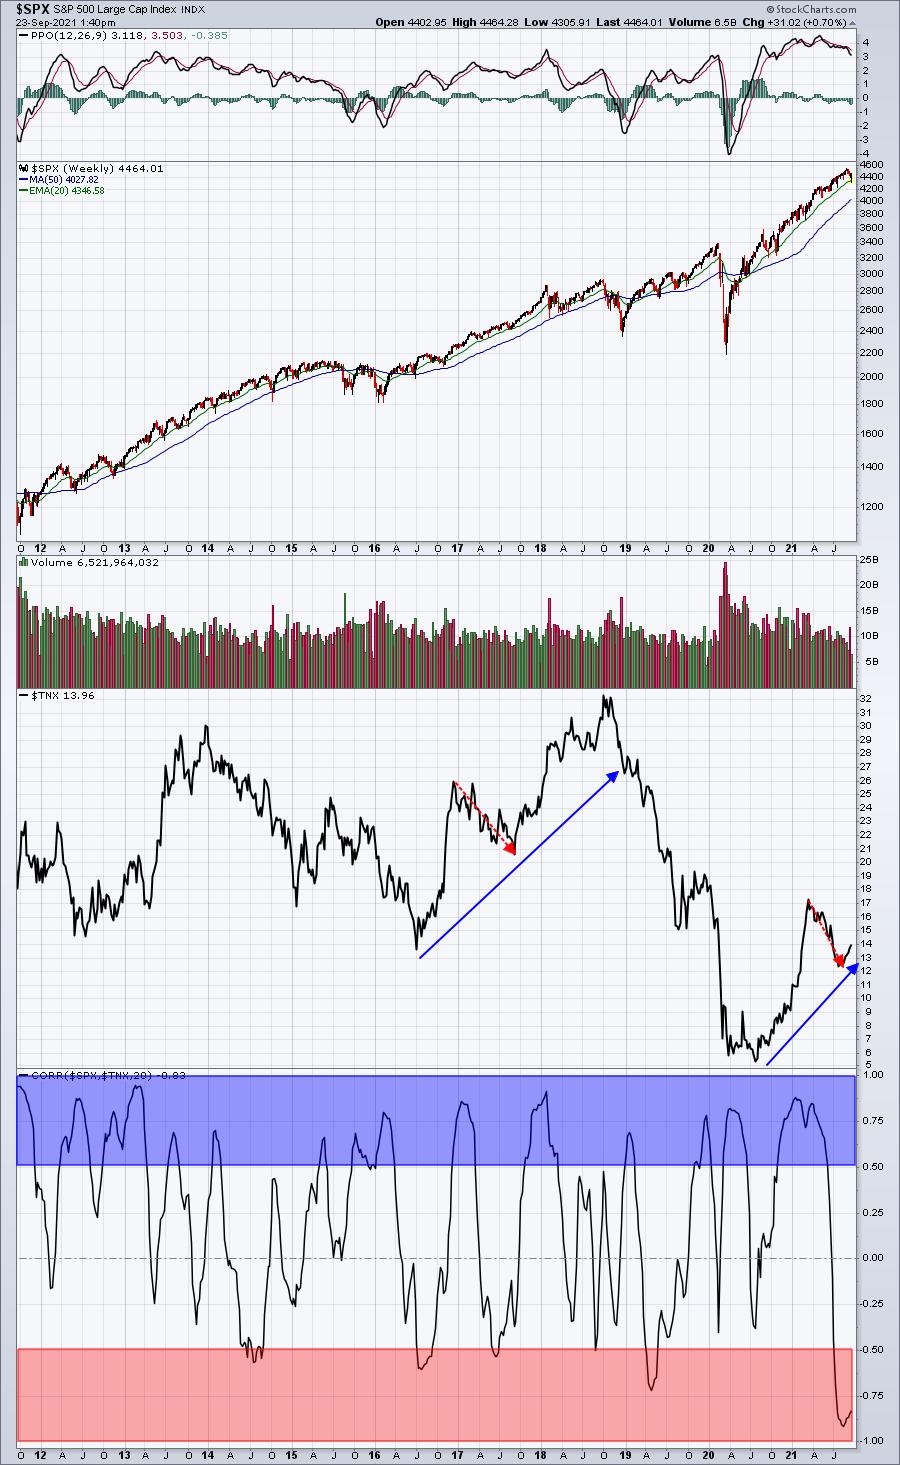
Check out the shaded areas for correlation. The blue-shaded area highlights positive correlation that exceeds +0.50. The red-shaded area highlights negative correlation that exceeds -0.50. You can see there's a much greater tendency for S&P 500 prices to rise along with the 10-year treasury yield. So a breakout in the TNX above 1.40% is likely to trigger an S&P 500 rally.
It's important to note that treasury yields can rise in anticipation of the Fed fighting inflation - which would not be a reason for the S&P 500 to rise. However, intermarket relationships are not suggesting that Wall Street considers inflation to be a problem. Therefore, by a process of elimination, I'll conclude that today's rising yields are the result of the Fed's outlook and strengthening conviction on our economy.
Sector/Industry Focus
I'm seeing much more strength in consumer discretionary (XLY) as the XLY is attempting to close above 185 for the first time in its history. Yesterday, I featured the travel & tourism group ($DJUSTT), which now seems to be uptrending after months of downtrending. But there are others making equally bullish moves. Hotels ($DJUSLG) may finally be ready to make a breakout after months of consolidation. Check this out:
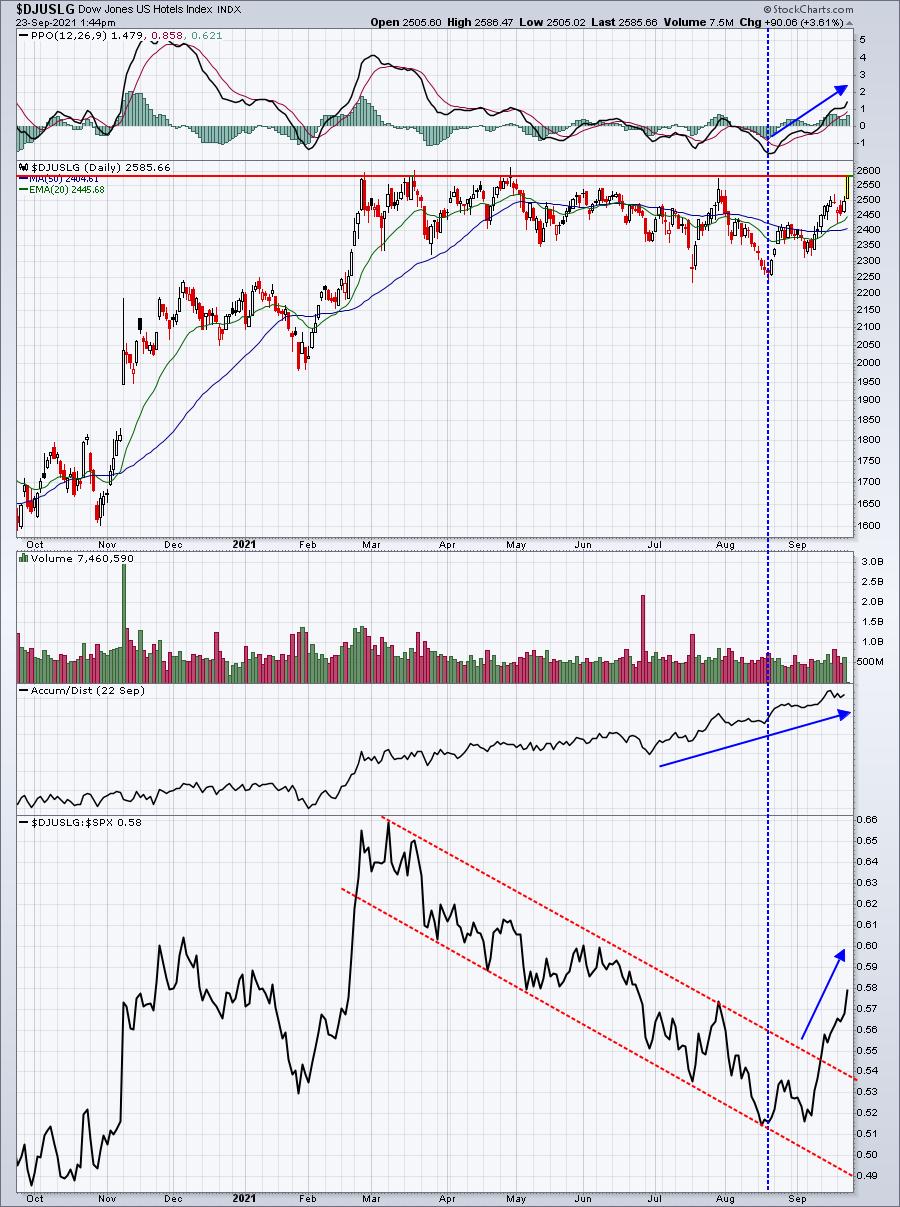
I've seen some very promising developments over the past 30 days in hotels, which is aligning with the more bullish outlook for consumer discretionary stocks in general.
ChartLists/Strategies
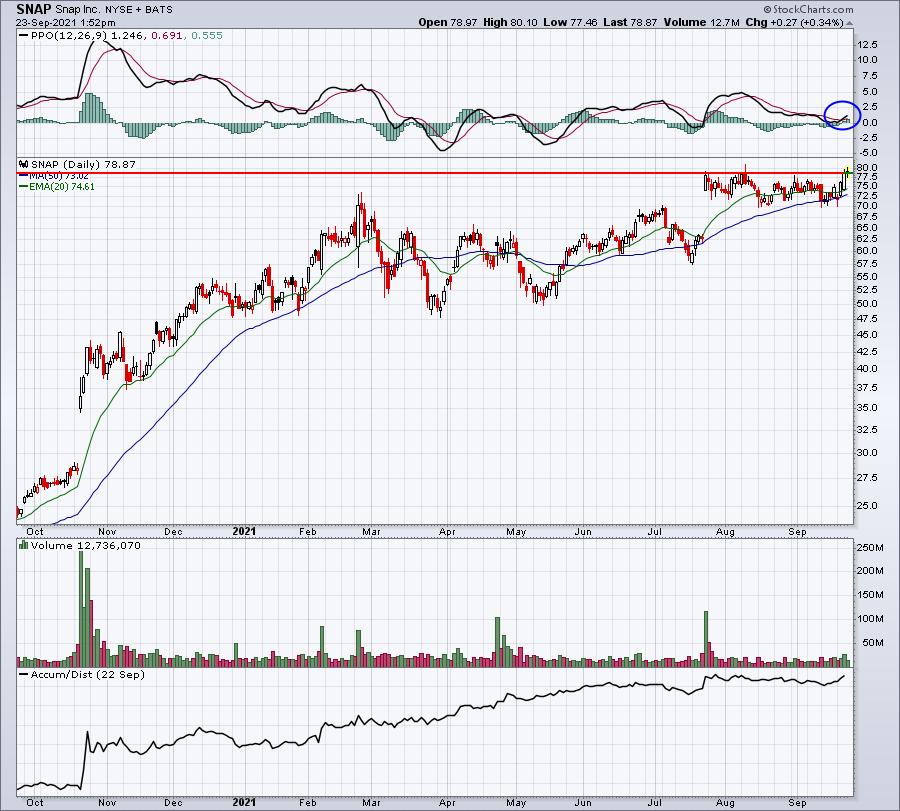
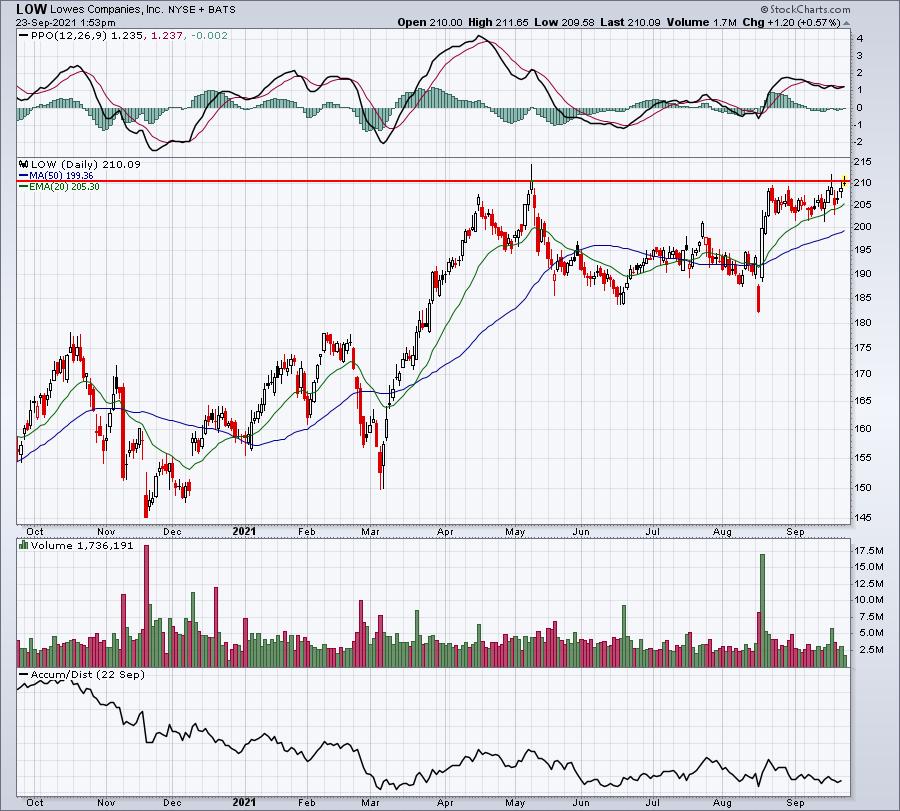
I reviewed hundreds of charts in our various ChartLists, specifically looking for stocks on the verge of major breakouts. Here are a few of the charts I found:
SNAP:
LOW:
SEAS:
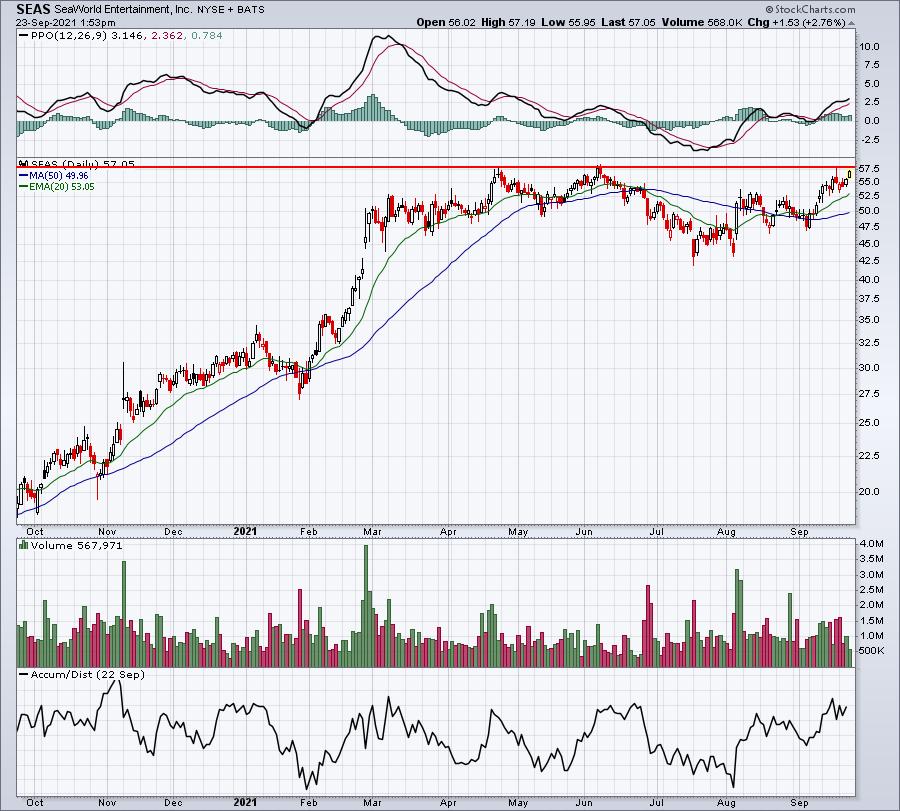
Breakouts, if they occur, are much more bullish if accompanied by heavier-than-usual volume.
Earnings Reports
Here are the key earnings reports for the next two days, featuring stocks with market caps of more than $10 billion. I also include a few select companies with market caps below $10 billion. Finally, any portfolio stocks that will be reporting results are highlighted in BOLD. If you decide to hold a stock into earnings, please understand the significant short-term risk that you are taking. Please be sure to check for earnings dates for any companies you own or are considering owning.
Thursday, September 23:
NKE, ACN, COST, DRI, TCOM, MTN, DAVA, PRGS, AIR, RAD
Friday, September 24:
JOBS
Economic Reports
Initial jobless claims: 351,000 (actual) vs. 309,000 (estimate)
August PMI composite: 54.5 (actual) vs. 55.5 (estimate)
August leading indicators: +0.9% (actual) vs. +0.6% (estimate
Happy trading!
Tom