
EB Daily Market Report - Tuesday, September 28, 2021
StockChart TV's "The Pitch"
I'll be featured later today at 5:00pm ET on one of StockCharts.com's premier shows, "The Pitch". It was roughly 18 months ago that I appeared with Grayson Roze and Mary Ellen McGonagle on the very first episode. Anyhow, I'll be presenting ideas for Q4 2021, including many that I've discussed recently here in the DMR, during my TP live shows, or in my blogs. You can check out the show at 5pm ET today on StockCharts TV!
Executive Market Summary
- Futures were lower this morning and sellers have been relentless throughout the morning session
- Technology (XLK, -2.31%) and communication services (XLC, -2.10%) have been the primary laggards
- Energy (XLE, +0.87%) is the only sector in positive territory as crude oil prices ($WTIC) have flattened after rising for the past 5 days
- Cryptocurrencies are mostly lower as today is clearly a "risk off" type of day; bitcoin ($BTCUSD, -3.93%) and etherium ($ETHUSD, -5.25%) are both lower
- Despite the big selling in equities and the huge rise in volatility ($VIX, +26.81%), gold ($GOLD, -1.07%) isn't in favor, which is surprising
- Global markets are struggling as well, with the German DAX (-1.93%) down 300 points today
- IHS Markit (INFO, -5.45%) beat its quarterly revenue and EPS estimates; nonetheless, it's among today's worst S&P 500 performers
- Software ($DJUSSW, -3.35%) and semiconductors ($DJUSSC, -3.16%) are very weak and responsible for the lion's share of weakness in technology
Market Outlook
Many high growth companies are being hit today. The reason is likely rising treasury yields. Personally, I believe these pullbacks are opportunities to build positions in strong growth names, but there are definitely big risks associated with this strategy. As you know, I remain very bullish U.S. equities, but I try to remain as objective as possible with my research and analysis. Growth stocks ($DJUSGS) have been underperforming their value stock counterparts ($DJUSVS), especially since treasury yields have been on the rise. The same thing happened when treasury yields rose in Q1 2021. Traders do have strong short-term memories, so it's easy to understand why selling is taking place right now. Here's the chart to illustrate:
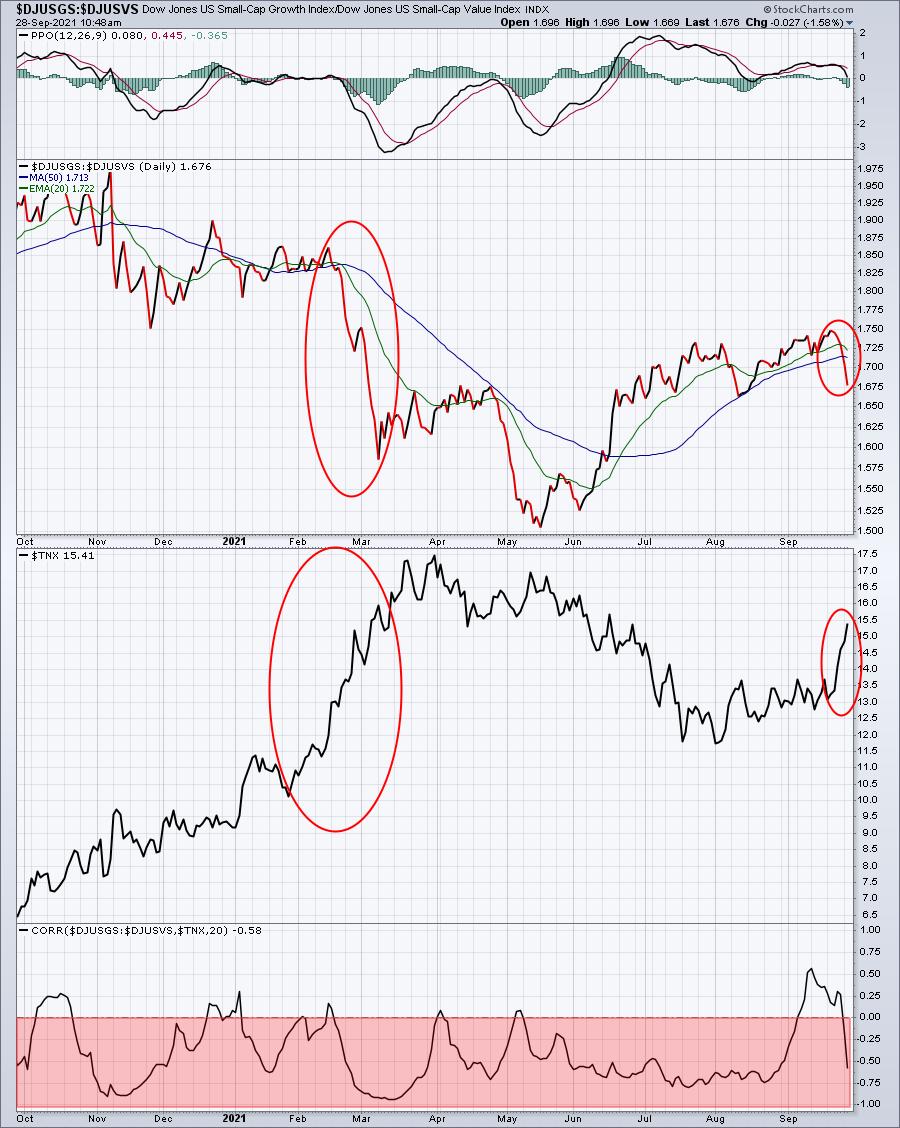
The red-shaded area shows the inverse relationship here. In other words, when one goes up (like treasury yields now), the other ($DJUSGS:$DJUSVS) goes down.
My belief is that as our economy grows, the increase in growth rates will more than offset yields rising from historic lows. But again, this is just my opinion, so you should do what's most comfortable for you.
Sector/Industry Focus
Now that technology (XLK) has come under more scrutiny and selling pressure, it would be a good time to look at where the group might gravitate to, if the short-term selling pressure remains in place:
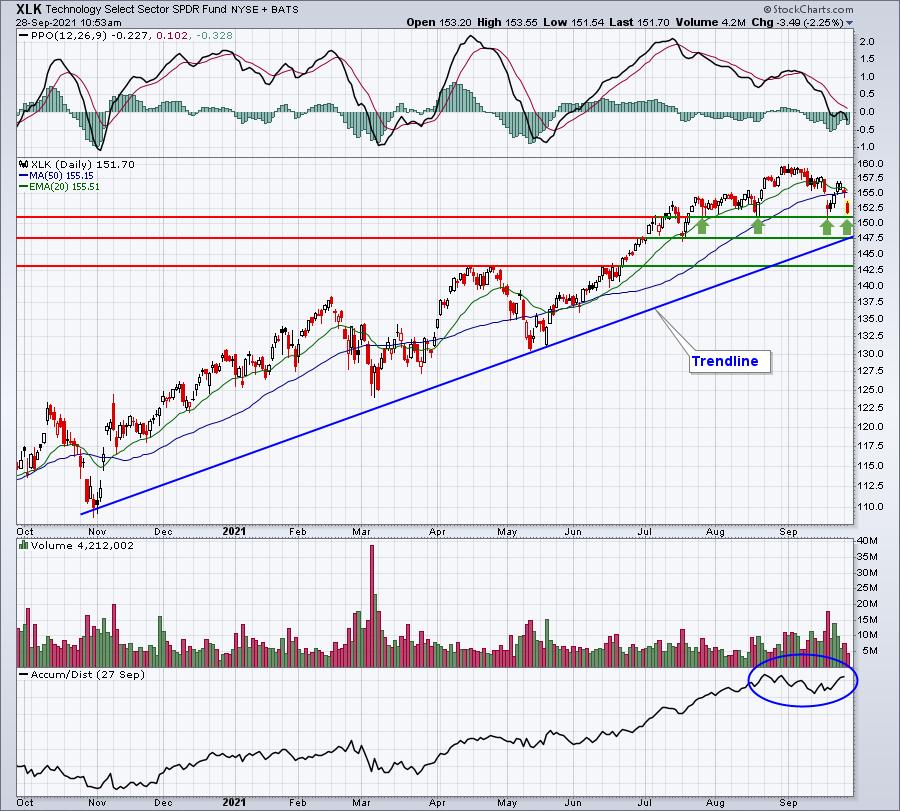
One positive on this daily XLK chart is the AD line, which is nearing a new high, despite the recent September selling. AD lines rise when price action finishes in the top half of that day's candlestick. So a rally later today in technology could actually result in the AD line breaking to a new high. The flip side would be the XLK finishing on its low, in which case, today's volume would be subtracted from the AD line total. That's why morning selling, followed by an afternoon recovery, is bullish on the AD line. On Balance Volume (OBV), on the other hand, only looks at whether price action finished higher or lower. If higher, ALL of the volume is added. If lower, ALL of the volume is subtracted. There's no adjustment for intraday reversals. It's why I personally favor the AD line over OBV.
ChartLists/Strategies
I featured a number of S&P 600 Small Cap companies on yesterday's DMR that are on both our Strong Earnings ChartList (SECL) and Raised Guidance ChartList (RGCL). One that appeared to be approaching a potential bottoming head & shoulders breakout was Oceaneering Intl, Inc. (OII), an energy stock. Today, it's gapped up above key neckline resistance, so its finish today will likely dictate short-term performance:
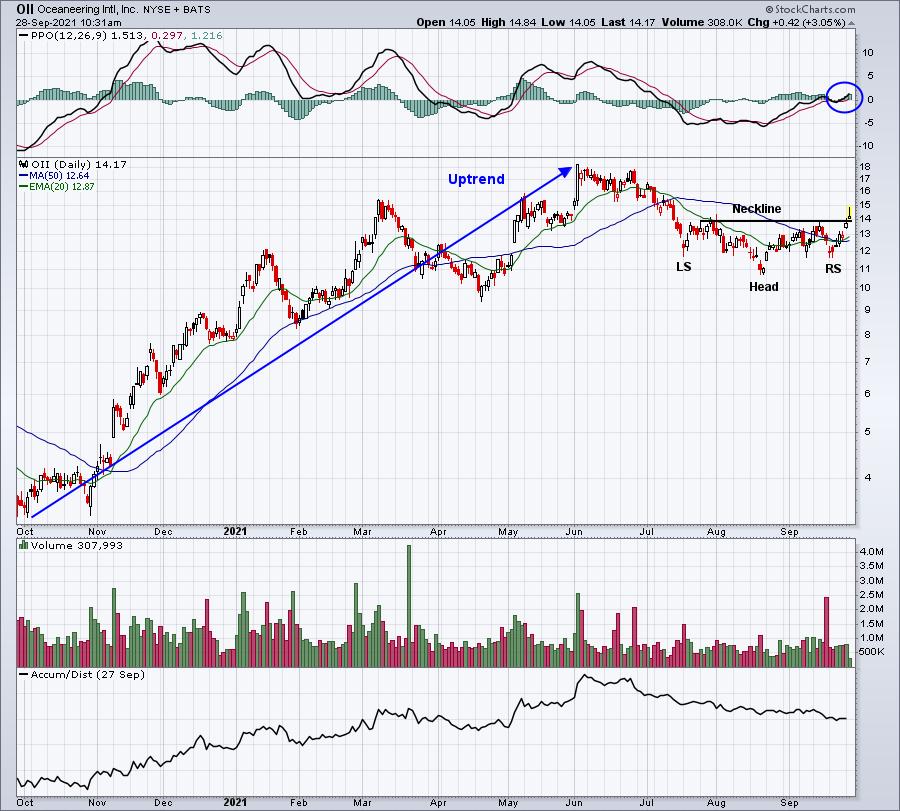
(Disclosure: I bought OII on the intraday pullback, but may sell later today if it finishes weak)
Earnings Reports
Here are the key earnings reports for the next two days, featuring stocks with market caps of more than $10 billion. I also include a few select companies with market caps below $10 billion. Finally, any portfolio stocks that will be reporting results are highlighted in BOLD. If you decide to hold a stock into earnings, please understand the significant short-term risk that you are taking. Please be sure to check for earnings dates for any companies you own or are considering owning.
Tuesday, September 28:
MU, INFO, FDS, DAVA, THO, SNX, UNFI, CALM
Wednesday, September 29:
CTAS, JBL, WOR, MLHR, NG
Economic Reports
July Case-Shiller home price index: +1.5% (actual) vs. +1.6% (estimate)
July FHFA house price index: +1.4% (actual) vs. +1.5% (estimate)
September consumer confidence: 109.3 (actual) vs. 114.8 (estimate)
Happy trading!
Tom