
EB Daily Market Report - Friday, October 1, 2021
ChartLists Updated
I updated the Strong Earnings (SECL) and Strong Future Earnings (SFECL) earlier today. It should be updated on our website later this afternoon and will be available for viewing/download.
Executive Market Summary
- Futures were higher overnight and our major indices gapped higher at the opening bell
- After an early move into negative territory, buyers have returned and our key indices are now positive
- The Dow Jones has rallied 500 points today, while small caps ($SML, +2.61%) are today's leading asset class
- Cryptocurrencies are very strong with both bitcoin ($BTCUSD) and etherium ($ETHUSD) gaining more than 9%
- Commodities are mostly higher, led by copper ($COPPER, +2.74%); crude oil ($WTIC) is up roughly 1%
- The 10-year treasury yield ($TNX) has dipped 6 basis points to 1.47%
- All 11 sectors are higher as energy (XLE, +3.20%) is the leader
- Financials (XLF, +1.84%) are rising despite the lower TNX; consumer finance ($DJUSSF, +3.01%) is pacing the sector and banks ($DJUSBK, +2.20%) remain strong
- Moderna (MRNA, -10.96%) continues its spiral lower, now down 109 points, or nearly 25%, over the past 6 trading sessions
Market Outlook
Correction: Yesterday, I noted that the three most bullish days of the month are the last trading day, plus the first two trading days of the subsequent month. I erroneously said that today, Monday, and Tuesday. The correct days this month are yesterday (September 30), today (October 1), and Monday (October 4). Sorry for any confusion that caused.
For those of you that are fairly new to EarningsBeats.com, let me expand on the historical data for the entire calendar month. Our service focuses primarily on fundamental and, especially, technical data. But I'm also a historian, so I enjoy passing along historical information. All calendar days are NOT created equal when it comes to S&P 500 performance since 1950. The following calendar month breakdown of S&P 500 annualized returns shows us tendencies to look for:
- 26th through 6th: +21.77%
- 7th through 10th: -4.04%
- 11th through 18th: +13.29%
- 19th through 25th: -8.51%
The S&P 500 has averaged gaining 9% per year over the past 7 decades. but you can see from the above performance that equities have much stronger chances of rising from the 26th through the 6th and 11th through the 18th (new money comes into the market at the beginning and middle of months - think 401(k) plan contributions from payrolls and Wall Street professionals buy ahead of those inflows). I believe the 7th through the 10th tends to be a profit taking period after market advances. The 19th through 25th likely results from a combination of profit taking AND monthly options expiration.
Does the stock market follow this script every calendar month? Of course not! But these are tendencies built over 7 decades. Ignore this data at your own risk.
Sector/Industry Focus
Biotechnology ($DJUSBT) has been under significant selling pressure the past week or so, as has been the entire health care sector (XLV). It appears that we could be seeing a significant reversal in the DJUSBT after testing a key area of support:
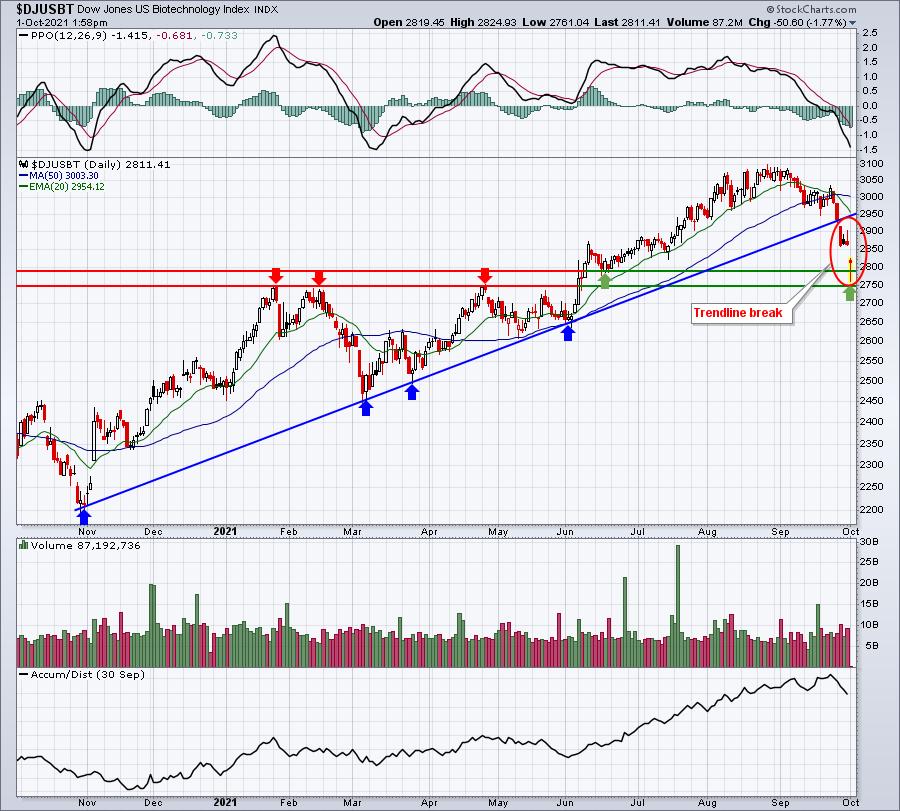
I've highlighted the trendline break, which is a big deal. However, NOTHING is bigger, in my view, than loss of key price support. I've annotated two price support levels that I'd be watching on biotechs and both are holding after today's reversal. Of course, the day isn't over and nothing is keeping the group from breaking down later today or next week, but this is an area I'd be looking for a reversal in a secular bull market. So far, that's what we're seeing.
ChartLists/Strategies
If you're someone that loves to trade beaten-down stocks for a possible short-term reversal, this is a strategy you might like. Currently, technology (XLK) and health care (XLV) have been hit the hardest over the past week. The Sector Summary at StockCharts.com provides us this evidence:
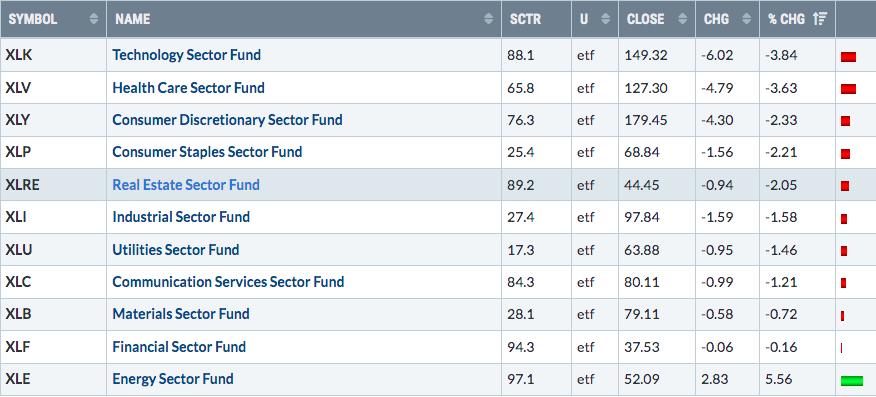
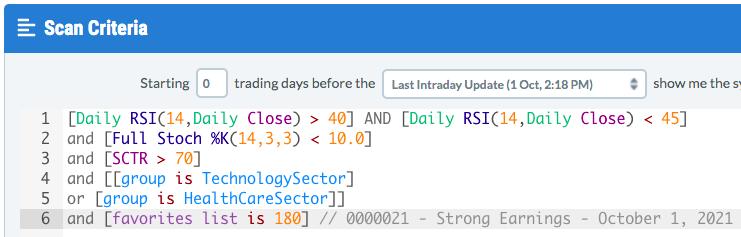
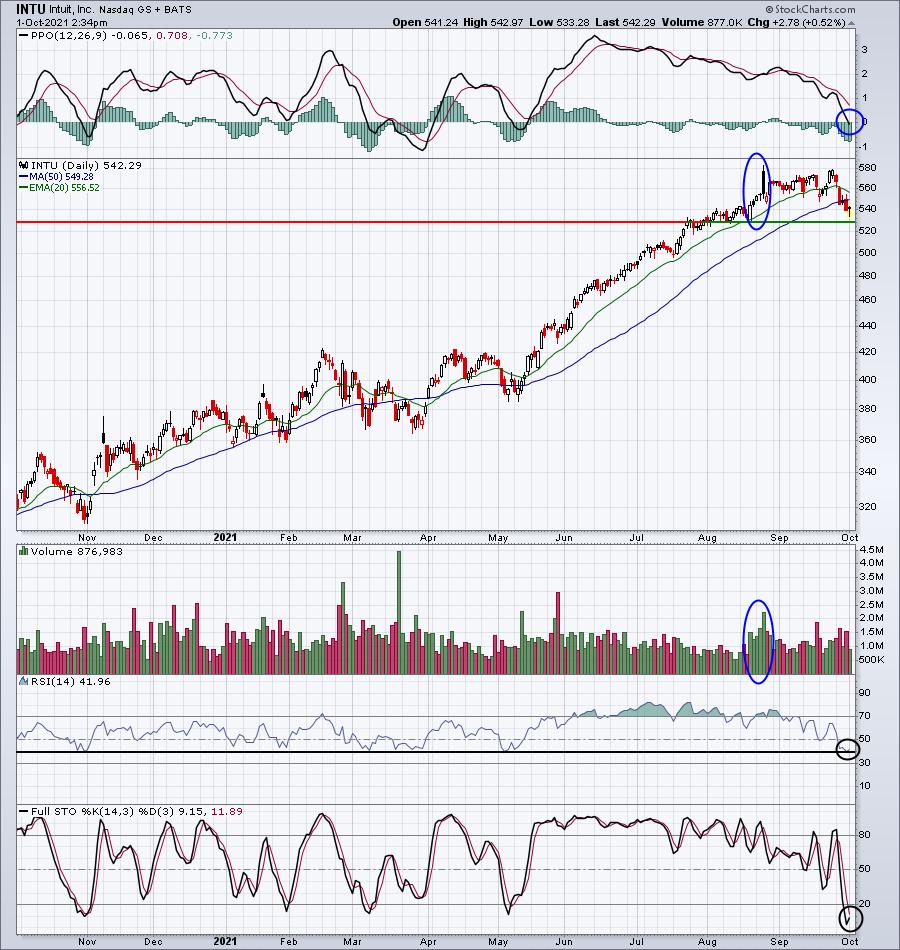
From here, we can run a scan of technology and health care stocks with RSIs in the 40-45 area and stochastics below 10. We can run this against our Strong Earnings ChartList (SECL) as these companies all beat Wall Street consensus estimates in their most recent quarterly earnings report. This scan will provide us with stocks in these two sectors that are oversold, but are fundamentally sound. Here's the scan I used, followed by the results:
5 stocks were returned:
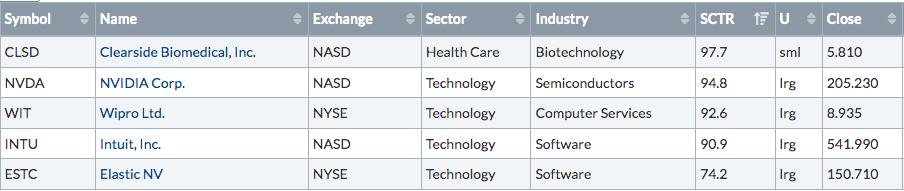
Here are the charts:
CLSD:
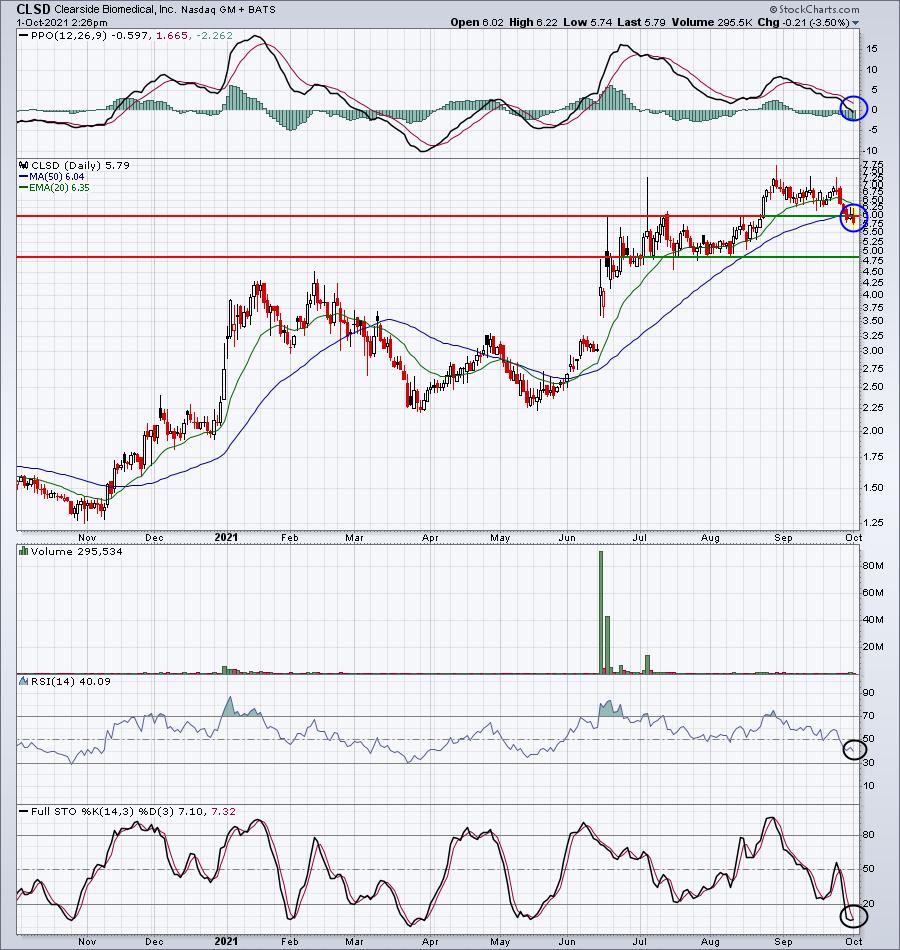
I'd feel better about this one if we see a strong reversal this afternoon or a reversing candle (bullish engulfing?) on Monday.
NVDA:
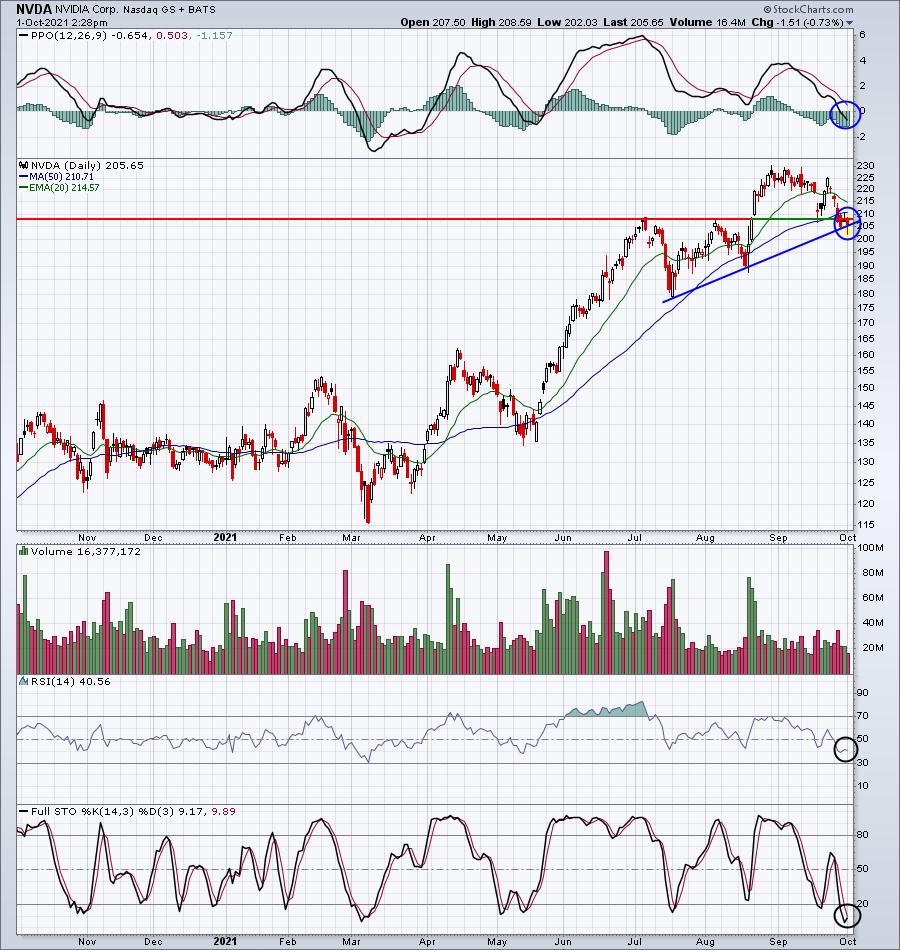
Price and trendline support intersect very close to the current price. RSI 40 has represented excellent entry opportunities in NVDA's recent past.
WIT:
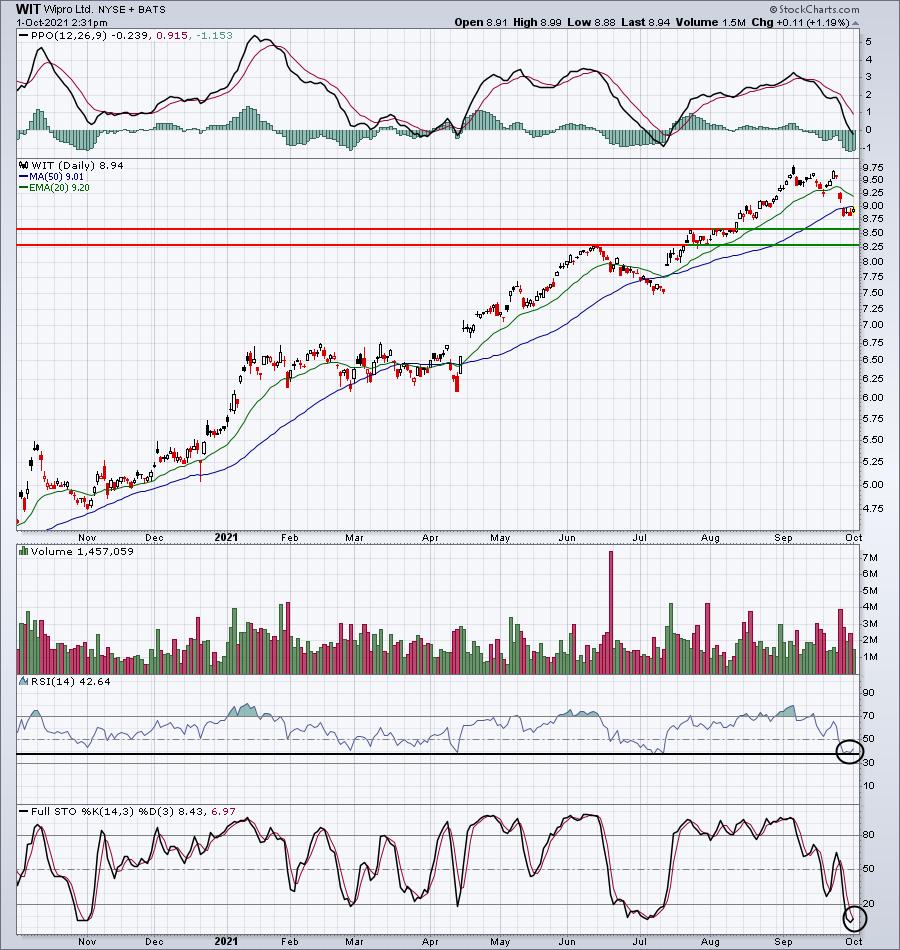
I'm not really seeing a key trendline or price support level being tested here, so I might look elsewhere.
INTU:
ESTC:
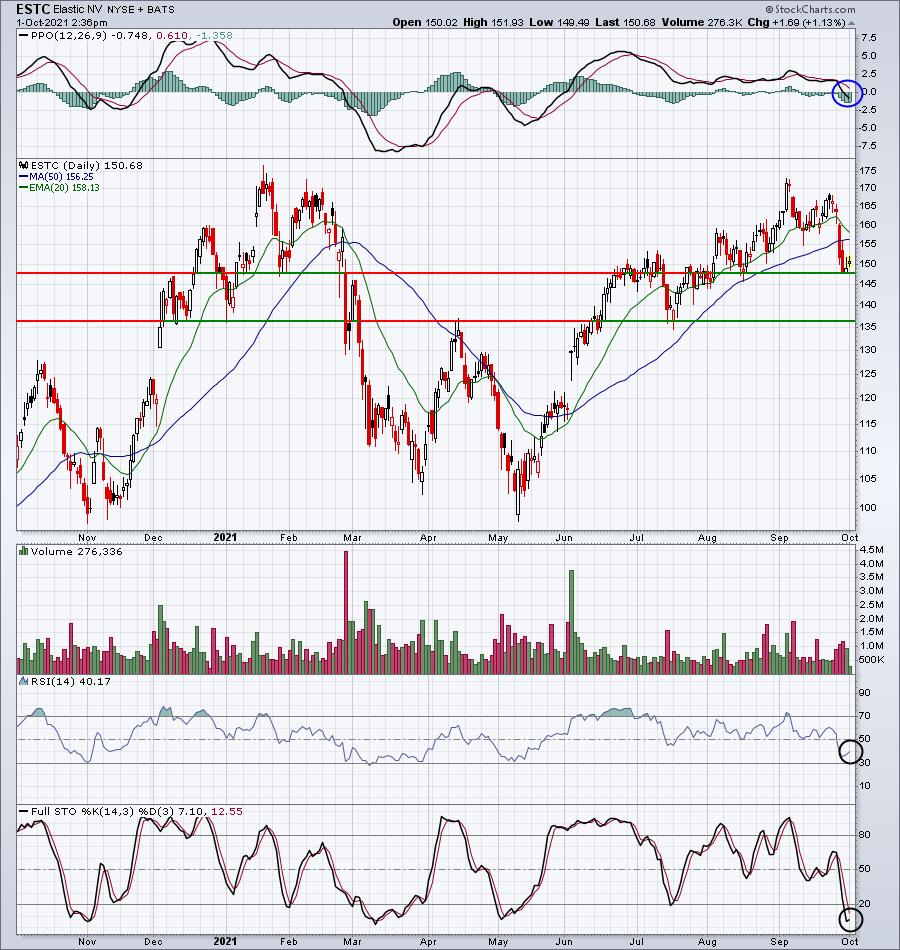
ESTC isn't really trending higher. It's been sideways consolidating mostly as its failed breakout in September (above the January high) would attest. The current price support isn't as strong as the next level either. Throw in the recent bearish volume trends and I'd likely avoid this one.
I've simply pointed out the potential for reversals on several stocks that recently were viewed quite positively by Wall Street. Are these opportunities for profit? I'm not sure, but I do know that the risk is much less than it was a week or so ago.
Earnings Reports
Here are the key earnings reports for the next two days, featuring stocks with market caps of more than $10 billion. I also include a few select companies with market caps below $10 billion. Finally, any portfolio stocks that will be reporting results are highlighted in BOLD. If you decide to hold a stock into earnings, please understand the significant short-term risk that you are taking. Please be sure to check for earnings dates for any companies you own or are considering owning.
Friday, October 1:
None
Monday, October 4:
None
Economic Reports
August personal income: +0.2% (actual) vs. +0.3% (estimate)
August personal spending: +0.8% (actual) vs. +0.6% (estimate)
September ISM manufacturing index: 61.1 (actual) vs. 59.8 (estimate)
August construction spending: +0.0% (actual) vs. +0.4% (estimate)
September consumer sentiment: 72.8 (actual) vs. 71.0 (estimate)
Happy trading!
Tom