
EB Daily Market Report - Monday, October 4, 2021
Executive Market Summary
- Futures were weak once again this morning as the recent downtrend resumed
- NASDAQ shares are definitely being hit harder today as defensive sectors lead
- Energy (XLE, +1.67%) is the top-performing sector, but utilities (XLU, +1.10%) is also having a strong day
- Meanwhile, technology (XLK, -2.43%), communication services (XLC, -2.30%), and health care (XLV, -1.45%) is where the majority of heavy selling exists
- Tesla, Inc. (TSLA, +1.26%) is down from its earlier high, but still enjoying a nice day after reporting higher-than-expected deliveries in Q3
- Internet stocks ($DJUSNS, -3.44%) are having a rough session as Twitter (TWTR, -6.02%) and Facebook (FB, -5.30%) are among the S&P 500's worst performers today
- Edwards Lifesciences (EW, -5.44%) and Moderna (MRNA, -5.42%) are among the weakest health care stocks
Market Outlook
It's been another day of distribution as the first full week of October 2021 gets off to a rather inauspicious start. If we thought that Friday's rally signaled that the September selling had ended, well, we thought wrong. The "C" in the A-B-C correction is intact. Below is a chart that highlights this correction with possible levels to look for a potential reversal:
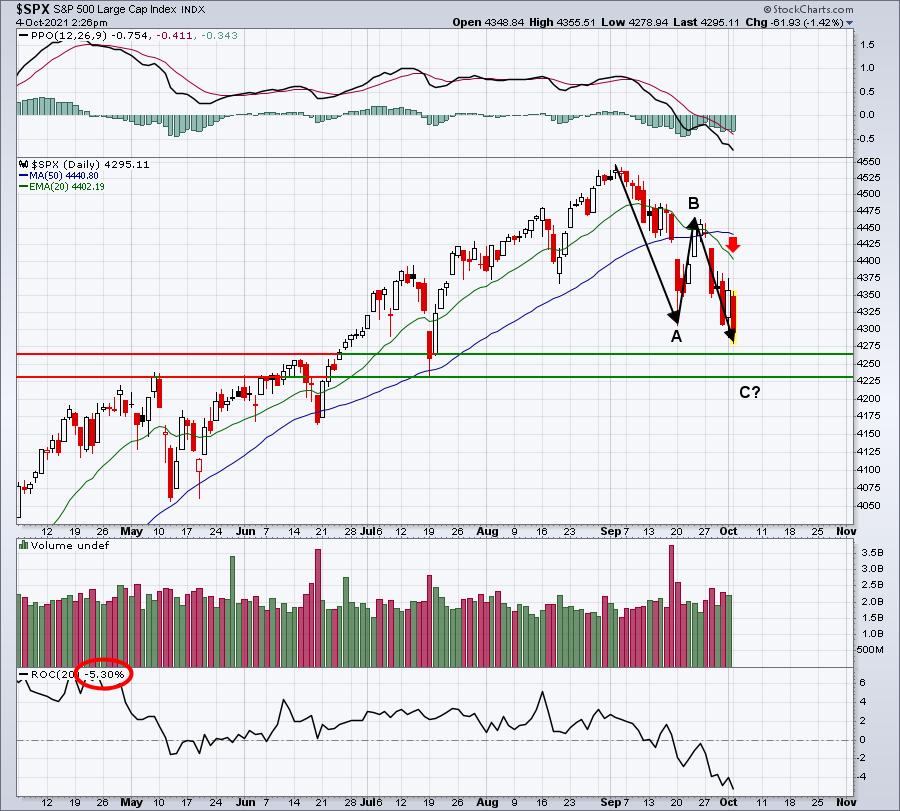
I added a 20-day Rate of Change (ROC) in the bottom panel. It's been 20 days during the current selloff. You can see that the S&P 500 has lost 5.3% during this period of selling, a significant decline. If support from 4230 to 4265 doesn't hold, then the market's struggles move from a short-term issue to an intermediate one, where a possible 10% correction comes into play. Quite honestly, the weekly chart is suggesting the potential for such a move:
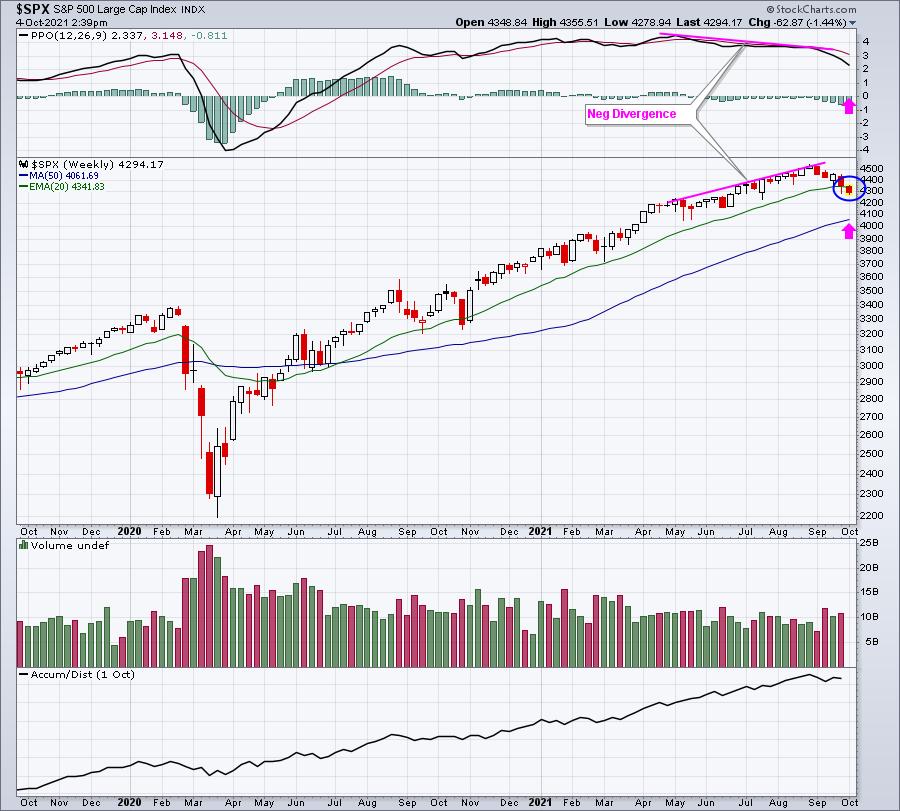
Negative divergences can play out by the weekly PPO returned to or near centerline support and price moving down to or near 50-week SMA support. Keep in mind that while this week's candle is currently violating 20-week EMA support, the candle won't be final until Friday's close. This could be part of a false breakdown, we simply don't know yet. Risks have grown near-term, though, as prices have breached earlier lows and the key moving average above.
Sector/Industry Focus
Internet ($DJUSNS) has been a leader of this secular bull market, but this industry is represented by a number of high-growth stocks and that's what's being discarded at the moment. I reviewed a 2-year chart to connect key highs and establish a potential channel by dragging this line down to connect recent lows as well. Based on this analysis, I could see the DJUSNS potentially dropping another 3% or so. Here's the visual:
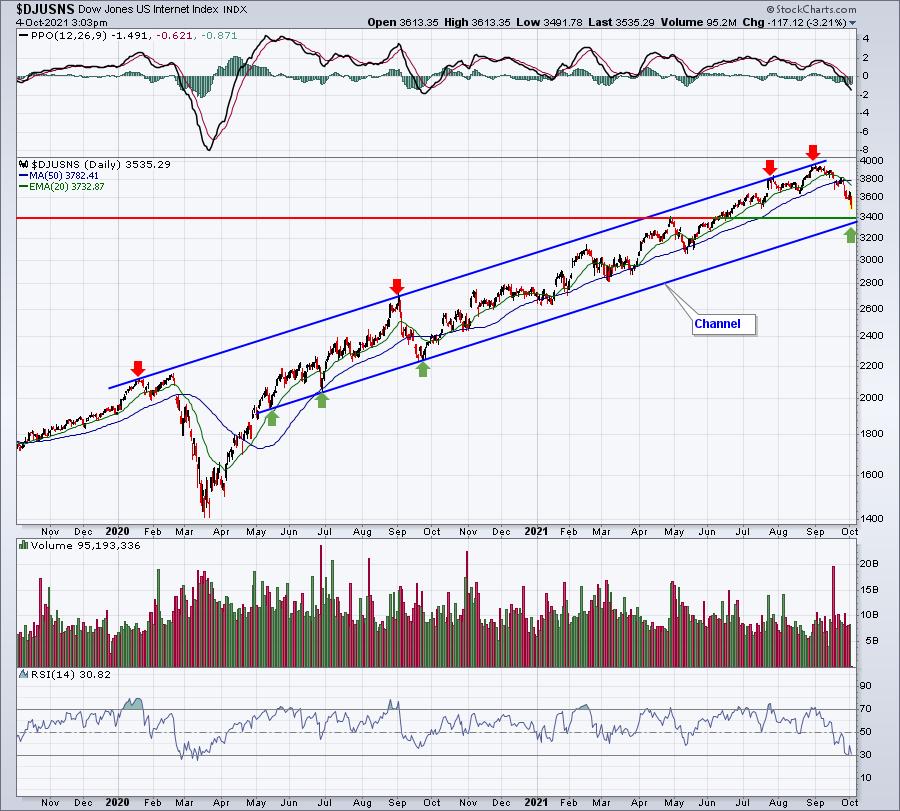
Right now, I'd view that 3400 level to be key support for the DJUSNS. However, it's unrealistic to assume this channel will hold forever. That's the reason why if we do see another bounce higher in Q4, the first quarter of 2022 could pose a bigger problem for the secular bull market. If we see 3400 support lost, that would definitely be a sizable crack in the foundation of the rally from the March 2020 low.
ChartLists/Strategies
The stocks provided on Friday as possible trades based on recent pullbacks have mostly continued lower. Obviously, it's been a very rough day for U.S. equities, though we are currently trying to rally late. I view the current environment to be extremely risky, so there are plenty of stocks that could be bought here, but with a Volatility Index ($VIX, +11.6%) that's elevated and rising, it's hard to say what we might wake up to tomorrow.
If you believe in the secular bull market and the likelihood that it continues over time, then buying the SPY or QQQ (ETFs that track the S&P 500 and NASDAQ 100, respectively) in pieces during a decline might make more sense. Many times, in riskier markets, I'll begin to trade ETFs rather than individual stocks as a means to mitigate risk somewhat. You won't hit home runs, but singles might be all you need. You also won't be as likely to strike out while swinging for the fences.
Earnings Reports
Here are the key earnings reports for the next two days, featuring stocks with market caps of more than $10 billion. I also include a few select companies with market caps below $10 billion. Finally, any portfolio stocks that will be reporting results are highlighted in BOLD. If you decide to hold a stock into earnings, please understand the significant short-term risk that you are taking. Please be sure to check for earnings dates for any companies you own or are considering owning.
Monday, October 4:
None
Tuesday, October 5:
PEP
Economic Reports
August factory orders: +1.2% (actual) vs. +1.0% (estimate)
Happy trading!
Tom