
EB Daily Market Report - Tuesday, October 5, 2021
Executive Market Summary
- Futures were strong and we've been in rally mode most of the session
- NASDAQ ($COMPX, +1.69%) has shown relative strength, while mid caps ($MID, +0.28%) have performed poorly on a relative basis
- Crude oil ($WTIC, +1.86%) is surging to a 3-year high just above $79 per barrel; surprisingly, however, energy (XLE, +1.07%) is just middle-of-the-pack in terms of sector performance
- Financials (XLF, +2.33) are the leading sector as the 10-year treasury yield ($TNX) jumps another 5 basis points to 1.53%
- Technology (XLK, +1.91%) and communication services (XLC, +1.88%) are recovering after Monday's selling
- Netflix (NFLX, +5.96%) is breaking out further into record-high territory and leading all S&P 500 component stocks today
- 28 of 30 Dow Jones component stocks are higher today, led by Goldman Sachs (GS, +3.72%)
Market Outlook
Sunny skies have returned for the bulls, but is the selling over? I think there's a decent chance that it is, mostly because we're in a secular bull market and weakness simply doesn't last when U.S. equities are in such a phase. But we need technical confirmation. One of the biggest obstacles, in my view, is that the growth stocks vs. value stocks ratio ($DJUSGS:$DJUSVS) remains in a downtrend. I'd like to see that change:
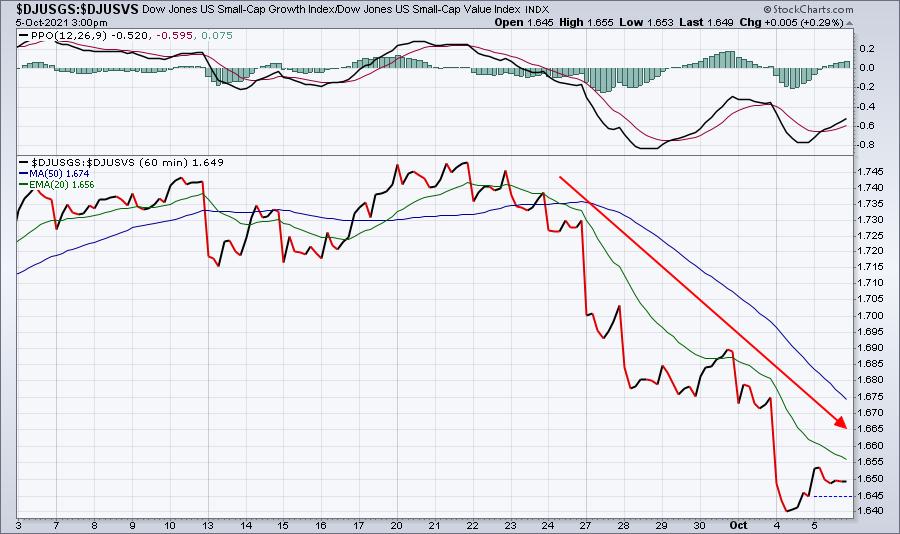
The money has clearly rotated away from growth recently. I'd feel 100 times more comfortable if this ratio was trending above its key moving averages rather than beneath them. The other thing I'd watch is simply price action. The NASDAQ has overhead resistance at its declining 20-day EMA and price support near 14200, which is where we broke out of a bullish ascending triangle continuation pattern:
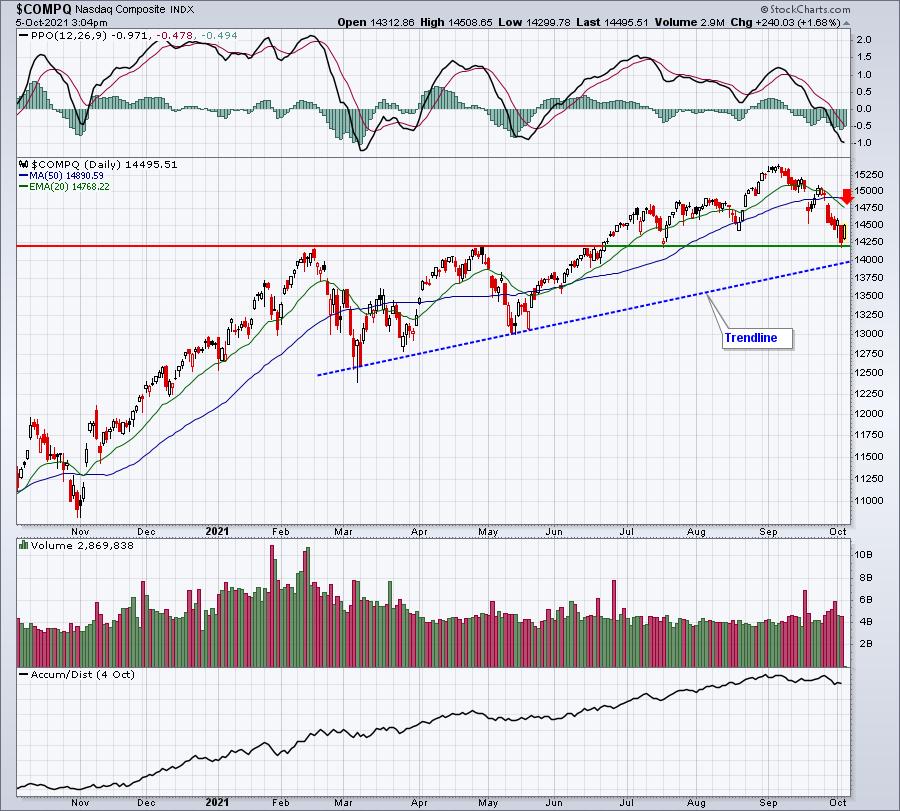
Just below the 14200 price support level is a trendline support that intersects near 14000, so if we haven't already bottomed, another leg down into that 14000-14200 price support zone should attract buyers.
Let's not forget that the TNX is up nearly 5 basis points today. If we wake up to another surge higher in treasury yields, the growth-oriented NASDAQ could easily find itself in for more short-term selling. I don't agree with it personally, but the stock market doesn't care what I think or what you think. It'll do what it wants to in the near-term.
Sector/Industry Focus
We've seen so many head fakes when it comes to transportation stocks ($TRAN), I hesitate to claim that "this time is different", but I am expecting to see transports rally back, and a great way to consider trading is via the IYT, an ETF that tracks key transportation stocks. The following chart shows both the TRAN and the IYT and the frustration that's taken place for the past 4-5 months:
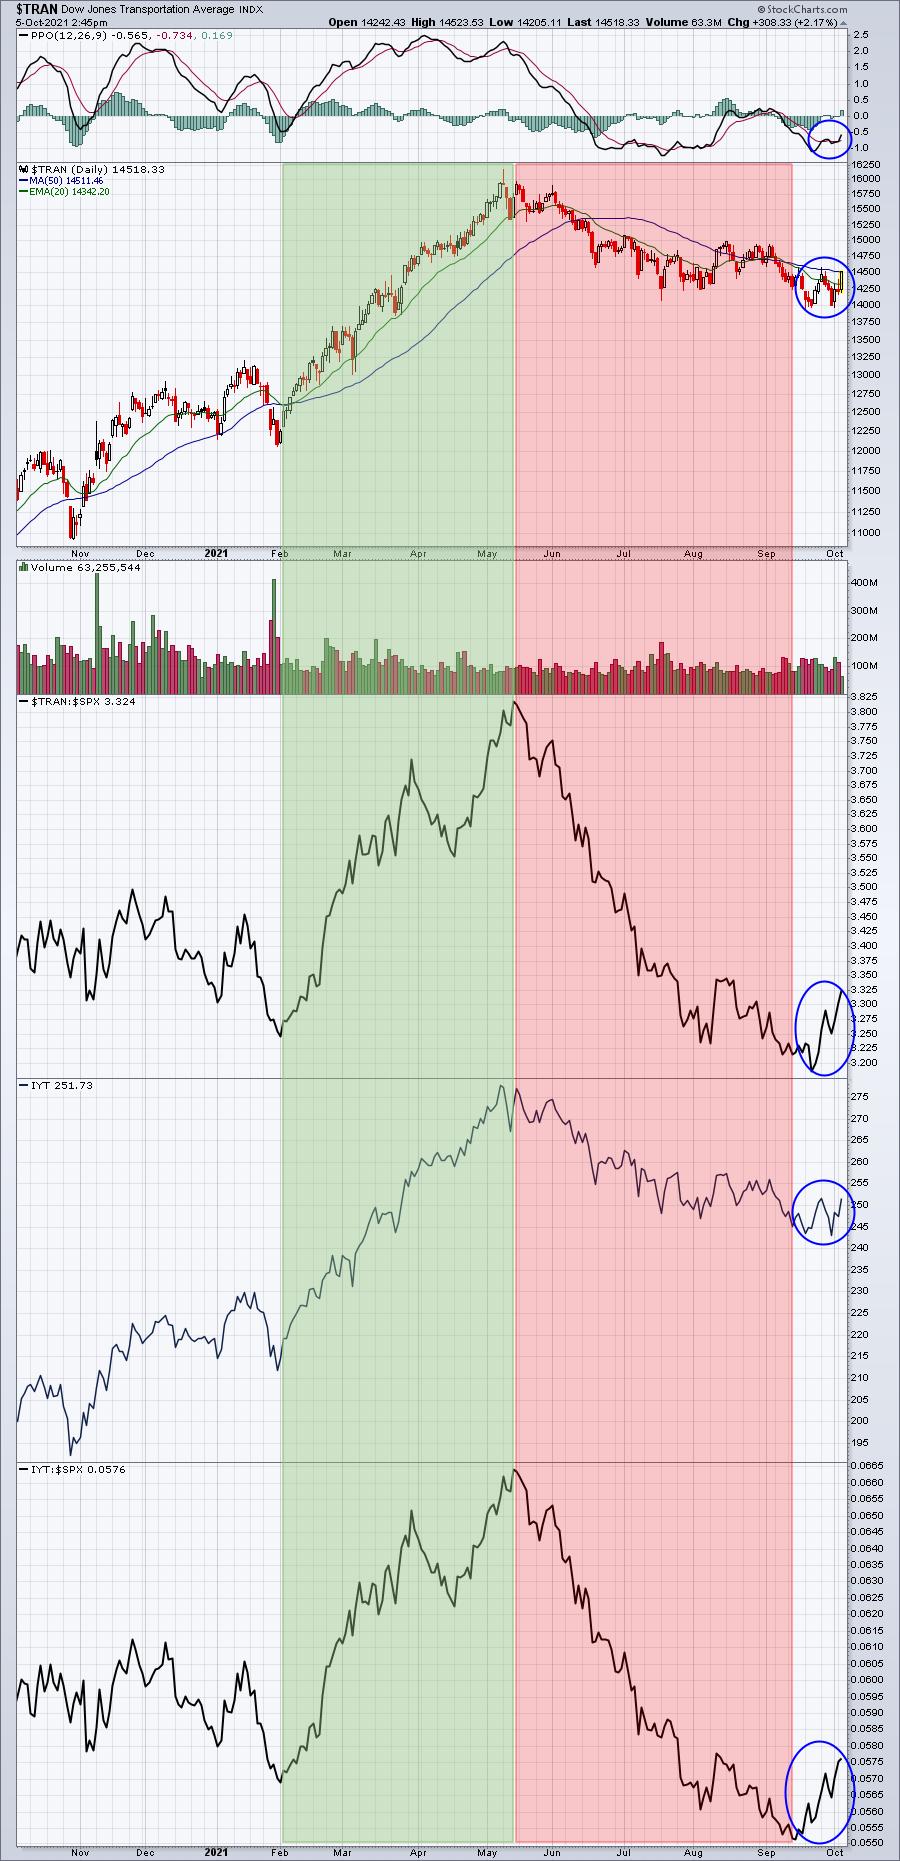
The 10-year treasury yield ($TNX) began rising in mid-September and that coincides with the recent surge on both an absolute and relative basis in transports. There's still much work to do on this chart, but we need to keep seasonality in mind too. Here's a quick glance at how the IYT has performed vs. the S&P 500 since the 2009 market low:
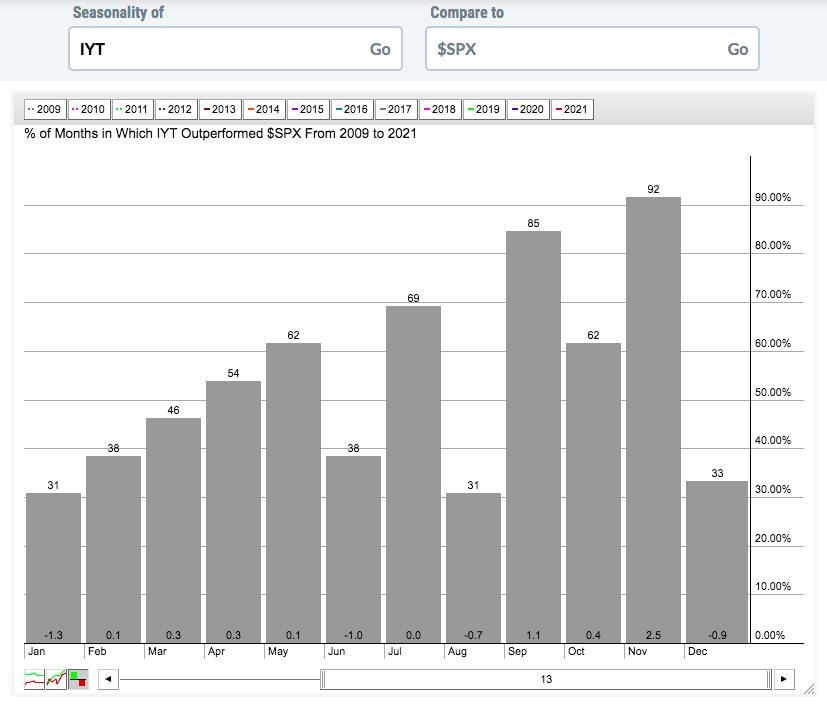
November's average outperformance has been 2.5 percentage points. September outperformance is second at 1.1. The third best? October's average outperformance of 0.4%. The three best months for transports since the financial crisis low have been September, October, and November. History tells us that we should be watching this group and building a position into weakness.
ChartLists/Strategies
I ran our Downtrend Reversal scan today across our Strong Earnings ChartList (SECL), Strong Future Earnings ChartList (SFECL), and Raised Guidance ChartList (RGCL) and 75 stocks were returned. If I add another filter, however, requiring a SCTR score above 95, just 5 stocks are returned: ASAN, MRNA, PDSB, BNTX, and DKS. Not too surprisingly, 4 of the 5 are either technology or health care names, the two groups really being beaten up of late.
The two that look most interesting to me are MRNA and DKS.
MRNA:
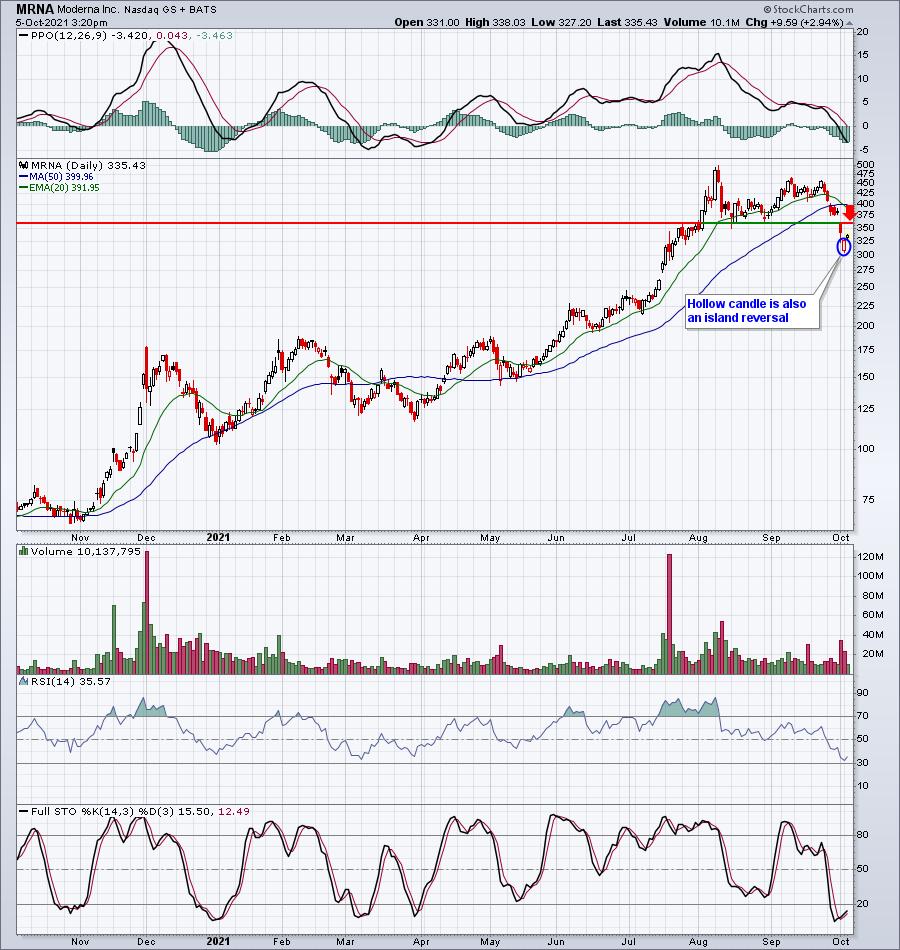
The bottom of gap resistance is at 358.33. Can MRNA negotiate that level on its first try? Hard to say, but trading the long or short side of MRNA is a huge risk because of its volatility.
DKS:
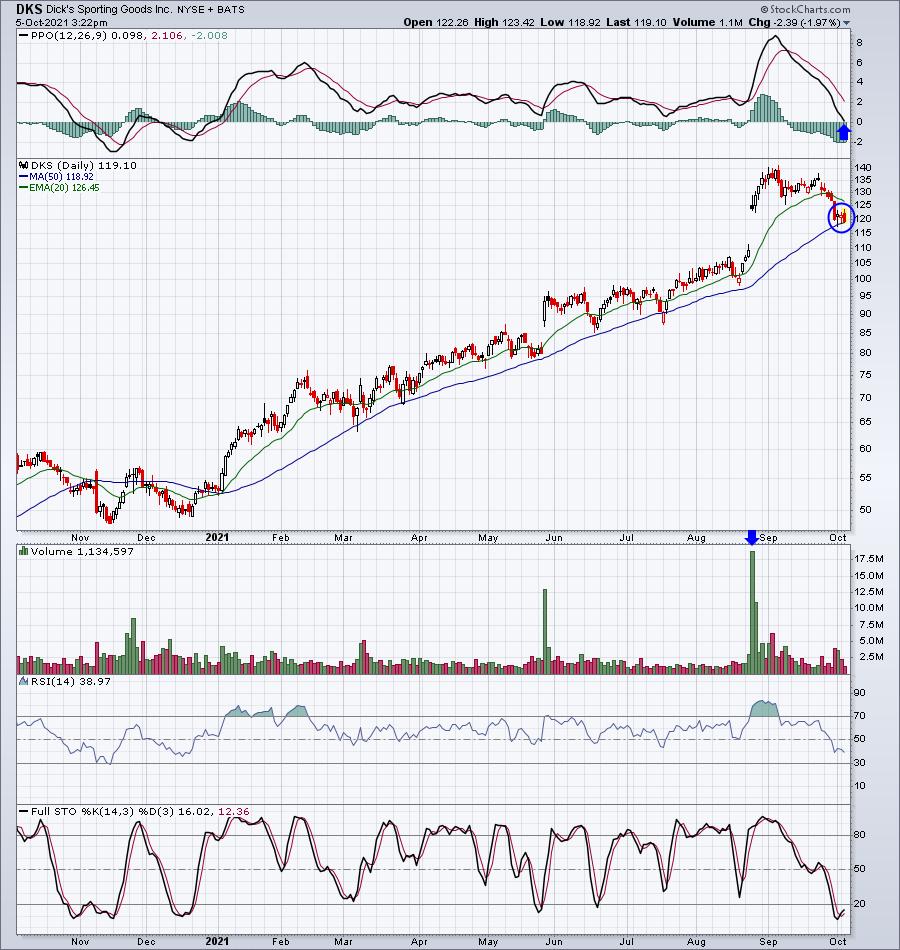
Do you like uptrending stocks that test their rising 50-day moving average? Or their PPO centerline? If so, you're getting both today on DKS. The stock soared recently on massive volume and now it's coming back down on much lesser volume. The bottom of gap support is close to 110. An aggressive trade would be to buy it right here with a closing stop just beneath the 50-day moving average. In order to mitigate risk somewhat, you could view the 50-day moving average and gap support near 110 as the two key support levels and build a position on any further weakness down to 110. Then a closing stop could be used a bit below 110 - perhaps 1-2%.
Earnings Reports
Here are the key earnings reports for the next two days, featuring stocks with market caps of more than $10 billion. I also include a few select companies with market caps below $10 billion. Finally, any portfolio stocks that will be reporting results are highlighted in BOLD. If you decide to hold a stock into earnings, please understand the significant short-term risk that you are taking. Please be sure to check for earnings dates for any companies you own or are considering owning.
Tuesday, October 5:
PEP
Wednesday, October 6:
STZ, RPM, LEVI, AYI
Economic Reports
September PMI composite: 55.0 (actual) vs. 54.5 (estimate)
September ISM services: 61.9 (actual) vs. 60.0 (estimate)
Happy trading!
Tom