
EB Daily Market Report - Wednesday, October 6, 2021
Executive Market Summary
- Futures were lower across the board overnight and our major indices gapped lower at the opening bell
- Energy (XLE, -2.23%) and materials (XLB, -1.56%) are the worst performing sectors in the first hour
- A strengthening dollar (UUP, +0.33%) that's threatening to break out again is the likely cause for that sector weakness
- Crude oil prices ($WTIC, -1.77%) falling back to $77.50 per barrel is the other culprit for energy's weakness
- Meanwhile, consumer stocks are outperforming as consumer staples (XLP, -0.04%) and consumer discretionary (XLY, -0.22%) are the relative leaders
- Acuity Brands (AYI, +12.98%) is breaking out to a 52-week high after posting quarterly EPS well ahead of estimates, $3.27 vs. $2.89
- Constellation Brands (STZ, -0.10%) is volatile, but currently flat, after missing its earnings estimates, $2.38 vs. $2.78
- Software ($DJUSSW, +0.48%) and broadline retail ($DJUSRB, +0.47%) have the early industry lead so far today
Market Outlook
On my Trading Places LIVE show this morning, I highlighted a chart that showed the September swoon in the S&P 500 with panels below showing the relative performance of defensive sectors, which has been rather abysmal. That's unusual as downtrends typically send money rotating into defensive areas. It's a signal to me that the current weakness is temporary and we'll soon return again to U.S. equities trending higher. Another way to show this is by looking at the relative performance of the aggressive sectors. They typically decline vs. the S&P 500 during big bouts of selling. Check this out:
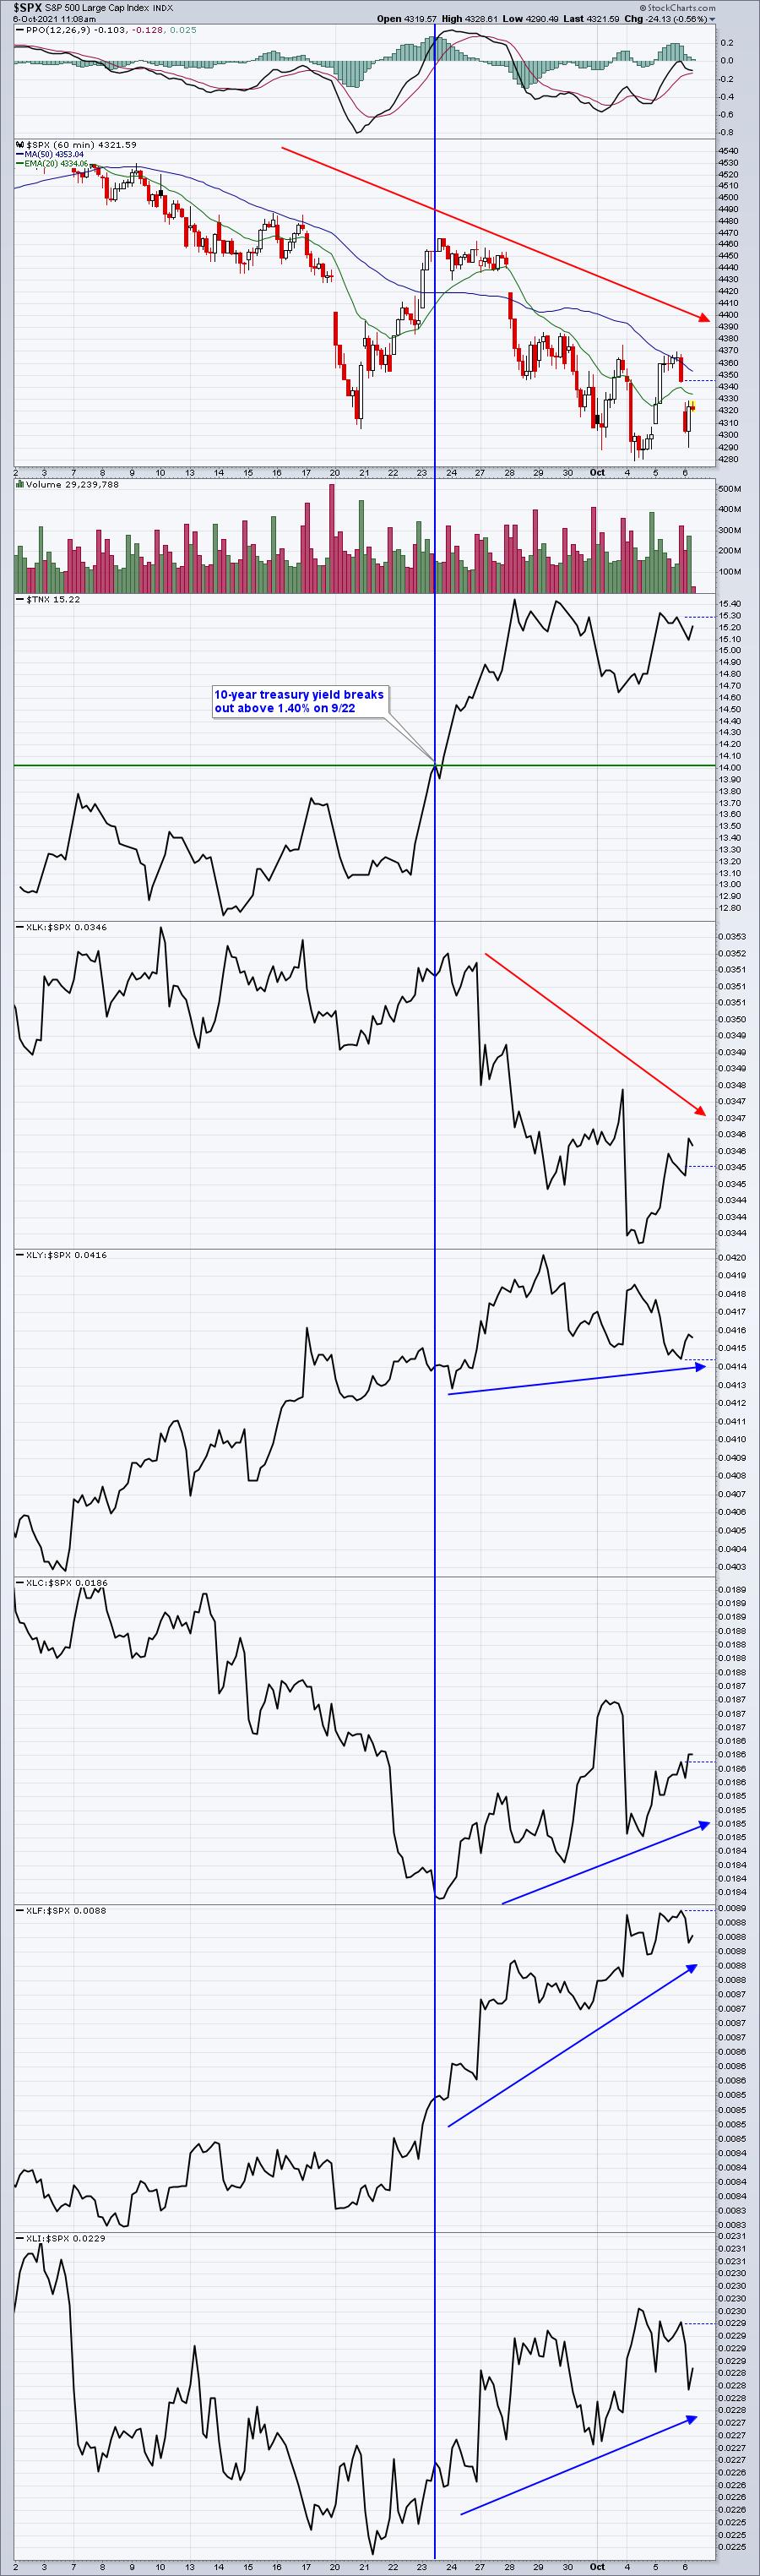
As interest rates rose (TNX rose above 1.40%), the money that left the technology (XLK) area of the market found a home in the other 4 aggressive areas. This isn't completely about growth stocks being sold, it's more about technology growth stocks being sold. The other 4 aggressive sectors have done quite well during the last 4-5 weeks' worth of selling, especially since yields broke out. Because technology represents 24% of the S&P 500, the weakness there is masking resiliency in the other aggressive areas of the market.
I see this as a bullish signal longer-term. Money is not running scared out of aggressive areas. We're seeing rotation out of technology - for now - but Wall Street is not repositioning into defensive areas in anticipation of more stock market weakness ahead. That's important to recognize.
Sector/Industry Focus
The U.S. Dollar Index ($USD) closed last Thursday at an 11-month high, which is keeping a lid on the XLB's relative strength. Rising crude oil ($WTIC) has helped the XLE escape this relative weakness up until today, but with crude oil prices lower, the XLE is losing its relative shine as well:
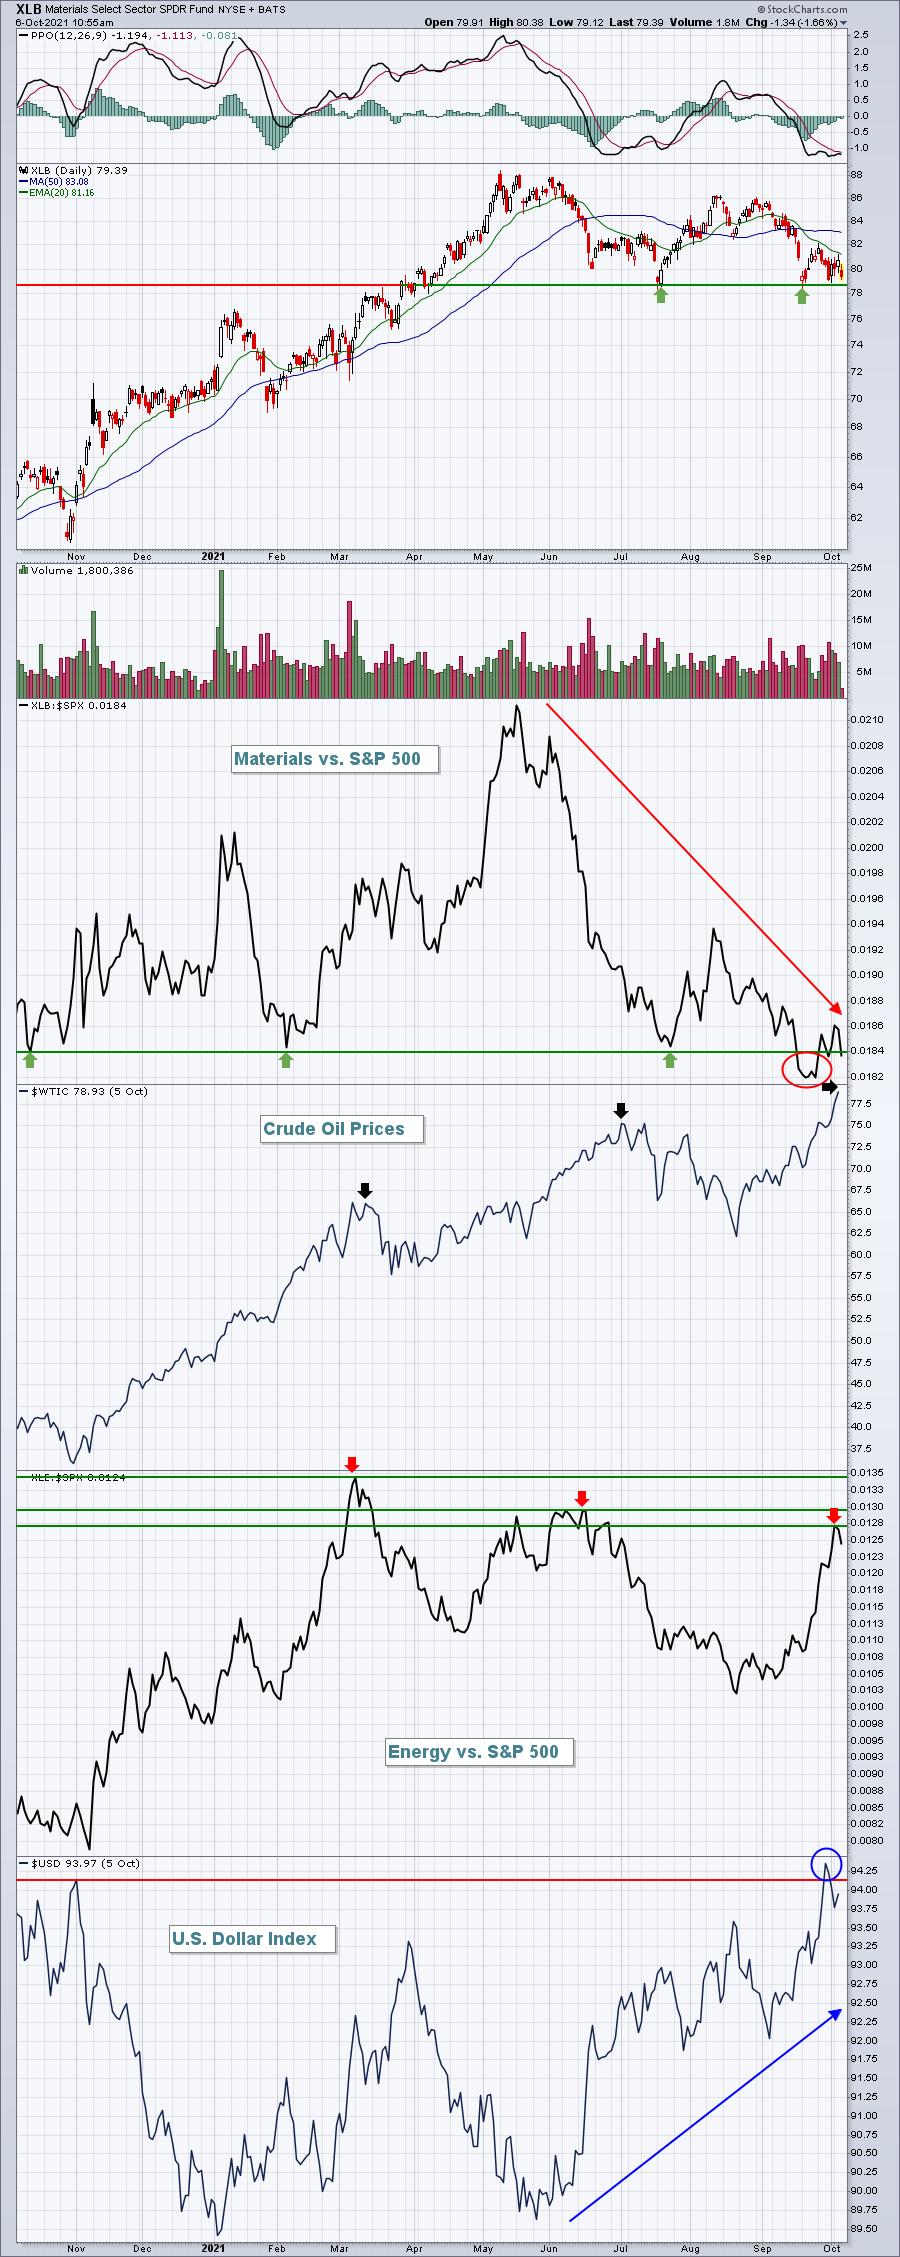
Materials are approaching a critical price support level just below 79. While absolute price support is holding, relative price support has not. Much of that can be attributed to the dollar strength since June. That's just about the time that materials lost their relative edge and began deteriorating rapidly vs. the benchmark S&P 500.
Energy has done much better, but it's mostly because of rising crude oil prices. If crude oil has topped, expect similar treatment of energy stocks in Q4.
ChartLists/Strategies
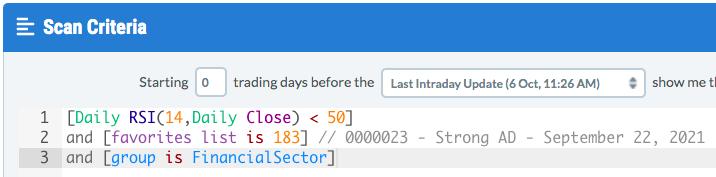
Financials (XLF) have consolidated the past 6-7 trading days since hitting a high on September 28th. I decided to run a scan of RSIs below 50 for all financial stocks on our Strong AD ChartList (SADCL). The Strong AD suggests that stocks are being accumulated and we know the XLF has been the best sector of late, outside of perhaps the XLE. So I wanted to see what stocks would be returned from such a scan inside one of the strongest sectors. Here was the scan and the results:
Scan Syntax:
Scan Results (in SCTR order):
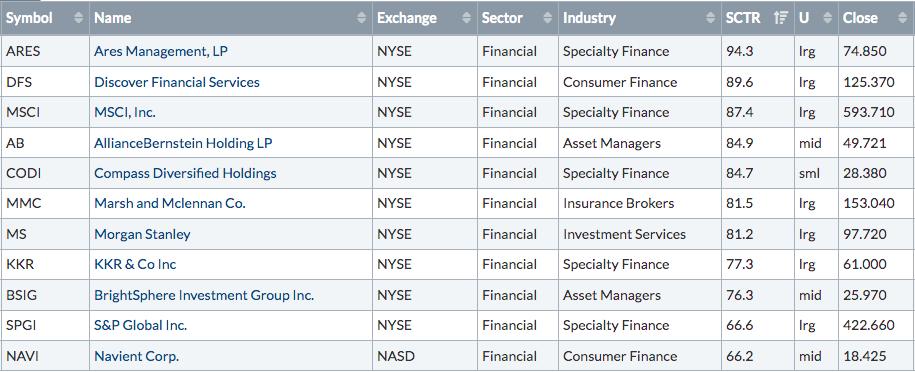
The two that interest me the most are CODI and SPGI:
CODI:
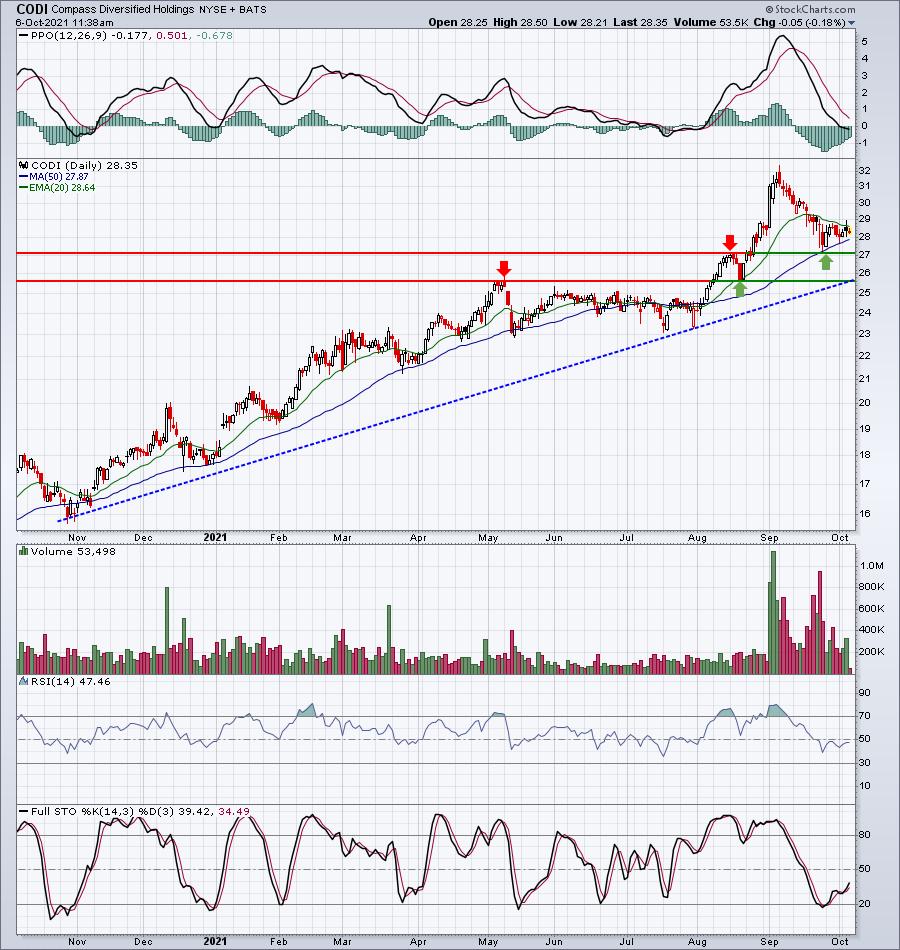
CODI gained roughly 33% during August and early September, so it's not unusual to see a period of selling after that. I like it on a pullback to or near the two key support levels (horizontal lines) shown, or on a break back above the 20-day EMA on a closing basis.
SPGI:
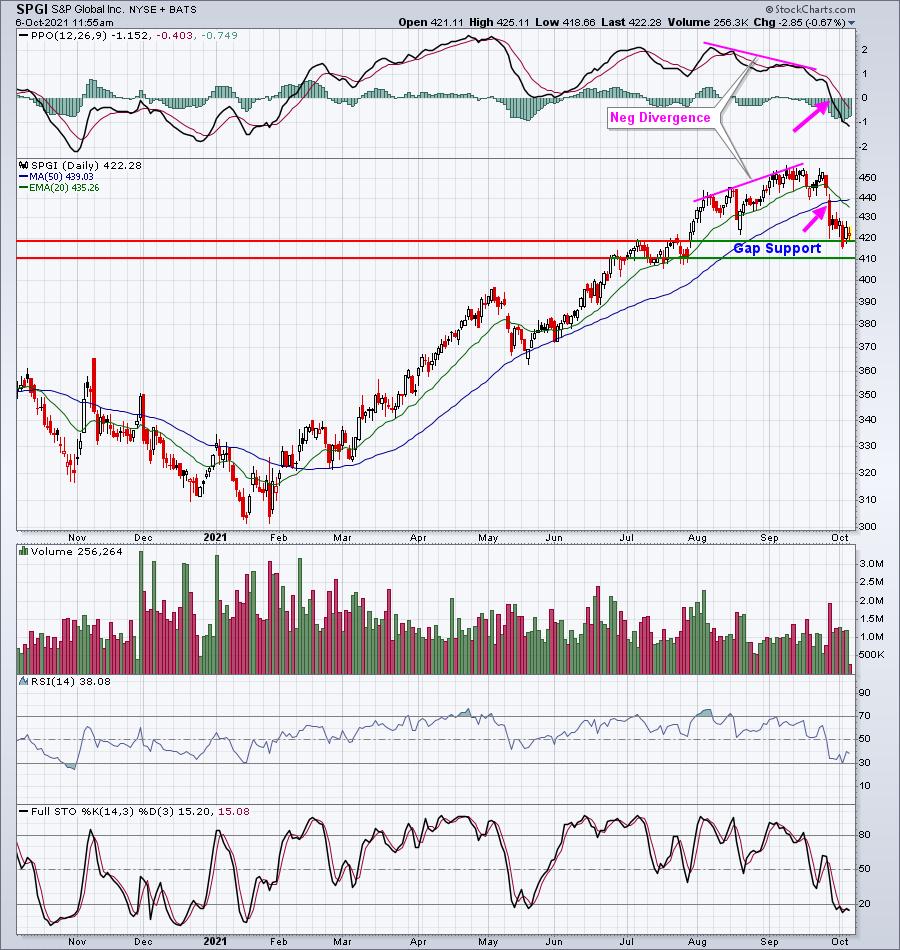
Negative divergences typically result in 50-day SMA/PPO centerline tests, which we've seen on SPGI. The gap support zone is where I'd be looking for a reversal. Failure to hold this level and I wouldn't make excuses. A recovery from this area, however, could result in solid gains ahead.
Earnings Reports
Here are the key earnings reports for the next two days, featuring stocks with market caps of more than $10 billion. I also include a few select companies with market caps below $10 billion. Finally, any portfolio stocks that will be reporting results are highlighted in BOLD. If you decide to hold a stock into earnings, please understand the significant short-term risk that you are taking. Please be sure to check for earnings dates for any companies you own or are considering owning.
Wednesday, October 6:
STZ, RPM, LEVI, AYI
Thursday, October 7:
CAG, LW, HELE, TLRY, ACCD
Economic Reports
September ADP employment report: 568,000 (actual) vs. 428,000 (estimate)
Happy trading!
Tom