
EB Daily Market Report - Thursday, October 7, 2021
Executive Market Summary
- Futures were strong overnight and we saw all of our major indices gap higher at the open and extend those gains intraday
- After showing relative weakness the past couple trading sessions, small caps ($SML) are showing leadership today and outperforming the S&P 500
- Crude oil ($WTIC, +1.37%) was down early today, but has recovered and now is in positive territory
- Other commodities are mixed with gold ($GOLD, -0.12%) down slightly, while copper ($COPPER, +2.39%) is up solidly
- All 11 sectors are higher with health care (XLV, +1.92%), a recent laggard, leading the way
- Materials (XLB, +1.91%), beaten down by an advancing dollar (UUP, -0.08%), is rebounding after successfully testing a major price support level in the 78-79 area
- Renewable energy ($DWCREE, +4.53%) is among the leading industry groups
Market Outlook
The NASDAQ 100 ($NDX) has reached a critical area of short-term resistance, as you can see below:
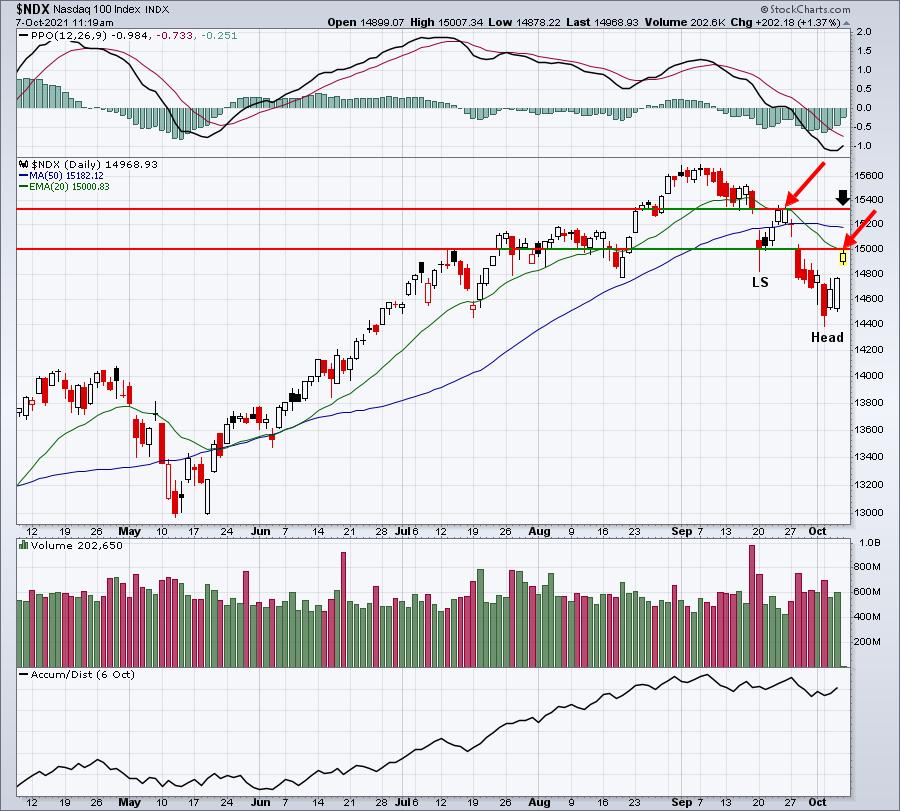
A break above gap and 20-day EMA resistance would be the first step to reversing the current downtrend. When we're in a secular bull market, I begin to look for bullish continuation patterns that form out of these selling episodes. The black arrow above would mark a potential neckline, if the NDX can clear 15002 on the close. Remarkably, the bottom of gap resistance is at 15001.98 and the declining 20-day EMA is at 15000.83. The first big bold red arrow shows a similar obstacle for the NDX 2 weeks ago. And what happened? We failed there. So we need to clear 15002 on a closing basis as a first step to technical repair. Once through that level, however, a move higher to 15333 could potential mark the right side of a neckline. To help visualize what this might look like, consider the following chart:
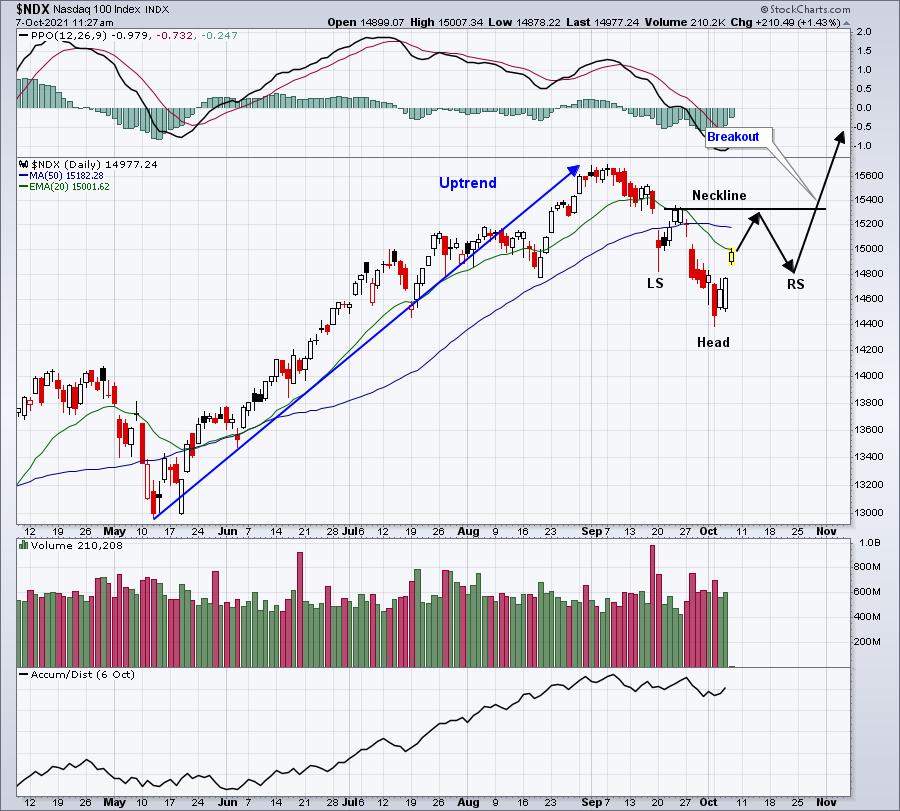
Currently, we're testing the 20-day EMA and gap resistance, but failing. There's still plenty of time left today to potentially make this breakout....or maybe it happens tomorrow or Monday. Maybe it doesn't happen at all. But I like to view possible patterns, especially as they relate to the long-term secular bull market.
Sector/Industry Focus
Financials (XLF, +1.35%) have broken out today, barring a big reversal this afternoon. 39 has provided stiff resistance for months, but the XLF has pushed through on another solid day of gains in the 10-year treasury yield ($TNX):
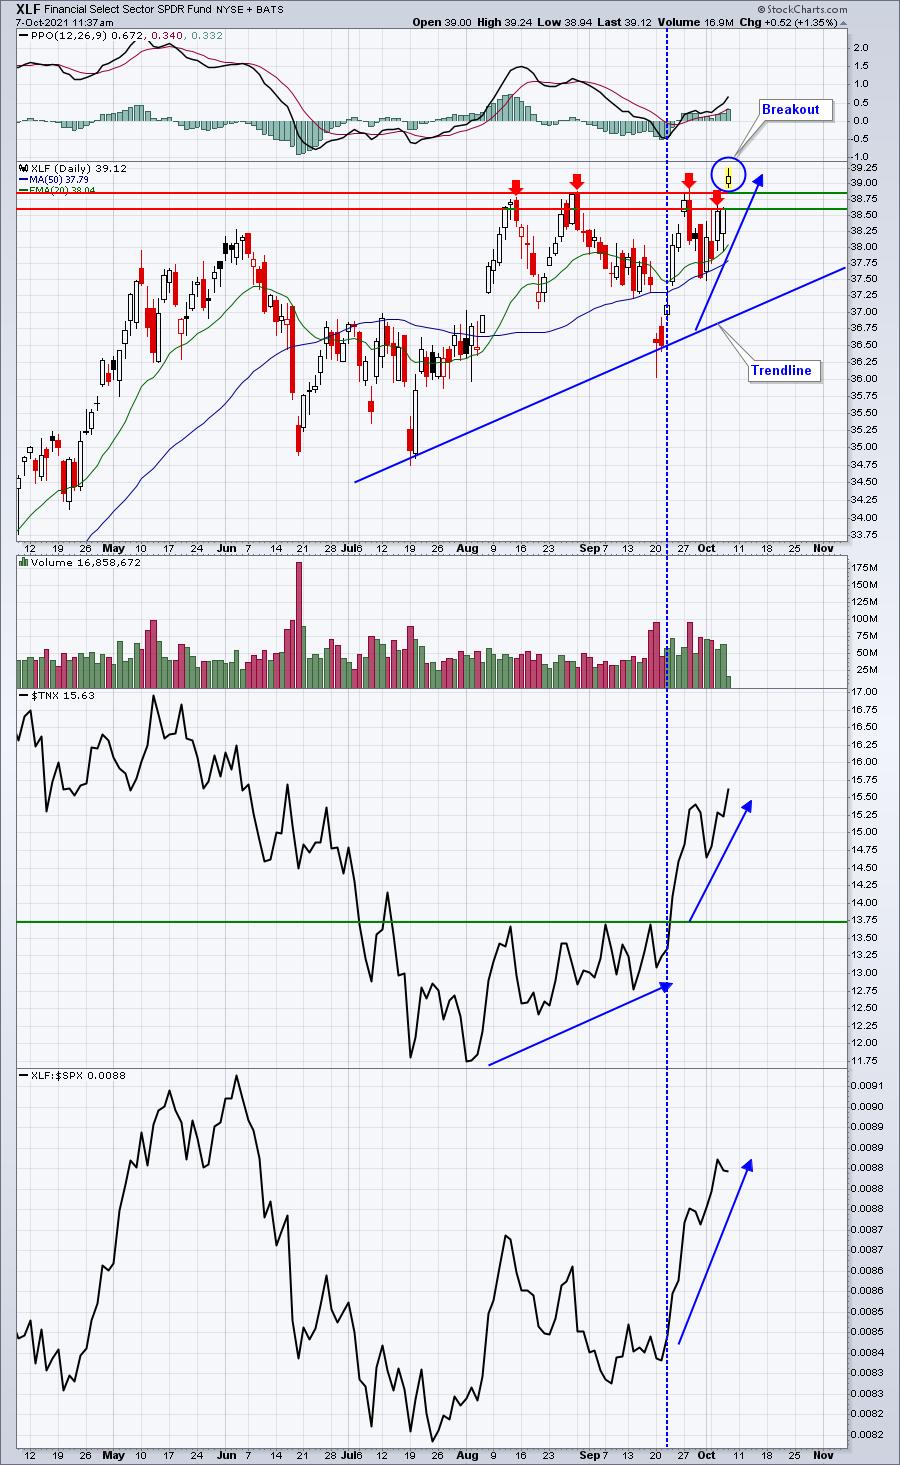
The blue-dotted vertical line marks the time of the TNX breakout. It's fairly easy to see the absolute and relative price strength of the XLF after this breakout and during the recent surge in treasury yields.
ChartLists/Strategies
I ran a high volume scan against our Raised Guidance ChartList (RGCL). We're getting closer and closer to the start of Q3 earnings season, so a high volume advance among stocks in this ChartList could suggest big accumulation as the company moves toward earnings. I looked for companies that have already traded their normal daily volume by noon eastern - not even the halfway point in the day. 8 stocks were returned (AFRM, ASML, CRI, IHRT, JYNT, LEVI, RRX, TGLS), but the only 1 that really sparked my interest was TGLS:
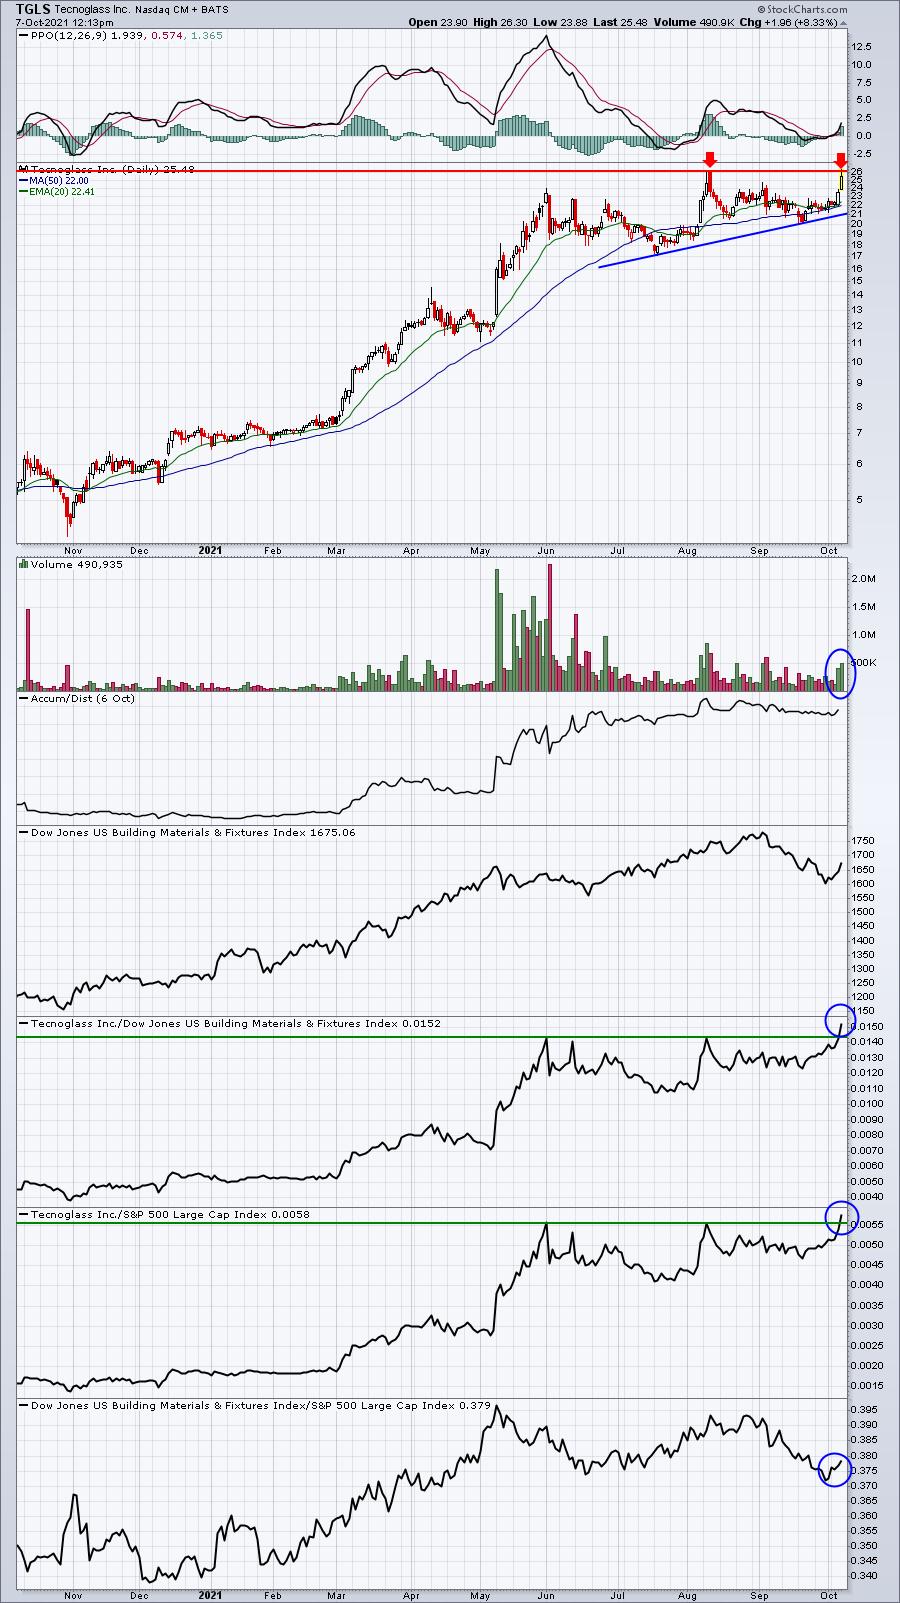
TGLS is showing excellent relative strength vs. its building materials & fixtures peers, and also vs. the benchmark S&P 500, breaking out to new 52-week relative highs vs. both. The absolute breakout level is 25.97. After reaching 26.30 earlier today, TGLS has retreated back below the breakout level. To me, the most important price is the one at the closing bell. Do we see the breakout into the close? If so, I view it quite bullishly on increasing volume. If we fail, though, it potentially sets up TGLS for further short-term weakness, an opportunity to build a position at lower prices.
Earnings Reports
Here are the key earnings reports for the next two days, featuring stocks with market caps of more than $10 billion. I also include a few select companies with market caps below $10 billion. Finally, any portfolio stocks that will be reporting results are highlighted in BOLD. If you decide to hold a stock into earnings, please understand the significant short-term risk that you are taking. Please be sure to check for earnings dates for any companies you own or are considering owning.
Thursday, October 7:
CAG, LW, HELE, TLRY, ACCD
Friday, October 8:
None
Economic Reports
Initial jobless claims: 326,000 (actual) vs. 348,000 (estimate)
Happy trading!
Tom