
EB Daily Market Report - Friday, October 8, 2021
Sneak Preview: Model ETF Portfolio Event
On Saturday morning, at 11:00am ET, I'll be hosting our quarterly Sneak Preview event that highlights the process that we use at EarningsBeats.com to develop our Model ETF Portfolio. In addition to discussing how the ETFs are selected, I'll also be providing everyone a glimpse into an amazing ETF tool, our ETF Analyzer. The ETF Analyzer helps us determine which ETFs could be included in our portfolio to achieve a certain objective. Investors' ETF portfolios will differ because different investors have different objectives.
If you'd like to join tomorrow's event LIVE, you can click on this room link any time after 10:30am ET tomorrow:
https://earningsbeats.zoom.us/j/83299713065
If you cannot attend the event LIVE, we'll be sure to send you a recording of the event for you to review at your leisure.
Executive Market Summary
- Futures were slightly higher this morning, and we opened higher, but we've seen a slight lean towards value stocks
- The September nonfarm payrolls report was released and it showed job growth was much slower than expected
- The 10-year treasury yield ($TNX) has surged 3 basis points to 1.60%, despite the weak data
- Crude oil ($WTIC) has jumped another 1.3% and is approaching $80 per barrel, crude's highest level since 2014
- As a result of the above, energy (XLE, +2.70%) and financials (XLF, +0.46%) are both performing very well
- 8 of the other 9 sectors are lower, though, led by real estate (XLRE, -0.51%) and materials (XLB, -0.45%)
- Energy names are littering the S&P 500 leaderboard, including APA Corp (APA, +5.72%) and Hess Corp (HES, +5.78%)
Market Outlook
I've discussed over the past several months how demand has increased substantially, while supply chain issues have been a big problem. One chart that I saw today perhaps explains this phenomenon as well as any. Do you remember lumber prices ($LUMBER) absolutely soaring earlier in 2021? Lumber prices ran from a post-pandemic low below $300 in April 2020 to an unbelievable $1700 in May 2021. These types of major rallies resulted in parabolic, blow-off type tops and lumber is perhaps a poster child visually:
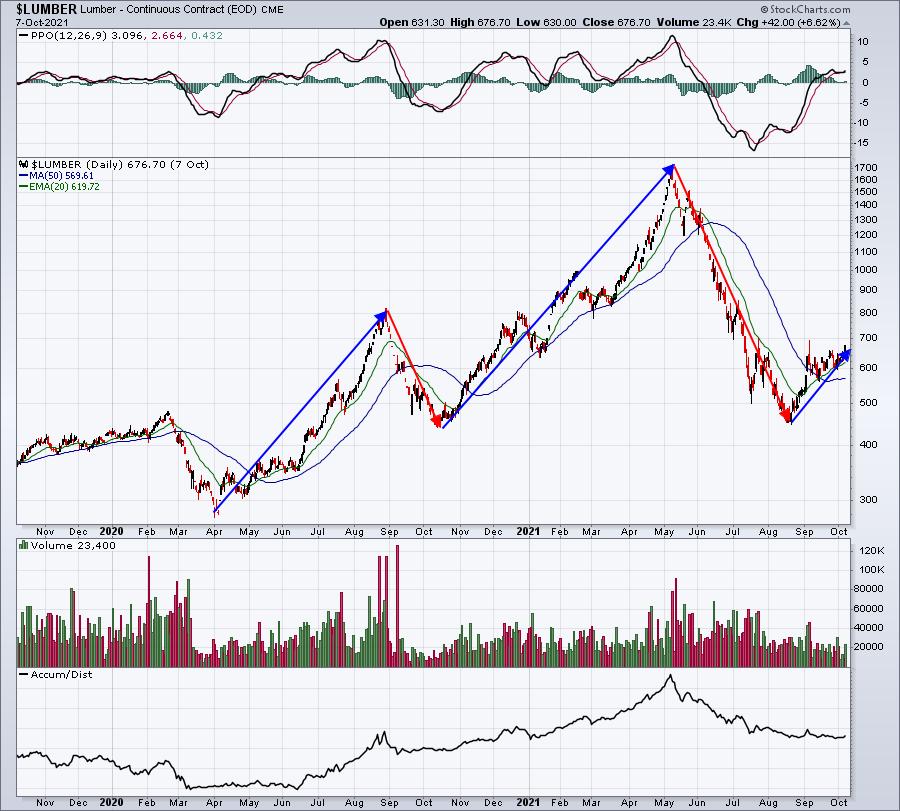
2020 was a pandemic-driven year of social distancing and a lockdown. Because travel was restricted so much, folks were finding other things to do with their money. Home improvements were one such thing. Demand grew exponentially, while supply chain issues forced a severe imbalance between demand and supply. That imbalance sent lumber prices soaring before they ultimately collapsed beginning in May 2021.
Do you remember the inflation numbers coming in so strong from February through May and the headline numbers scaring everyone that hyperinflation was upon us? Well, once the supply chain issues were resolved to some degree and demand fell back to a more normal level, lumber prices dropped accordingly. In a nutshell, this is what the Federal Reserve was referring to when they said higher-than-expected inflation was "transitory" due to supply chain issues. That lumber chart above I believe is a perfect illustration of what's been happening in many areas of our economy. We should begin to return to a bit of normalcy in 2022, but until then, we'll have to deal with other short-term "bubbles" like the one above.
Sector/Industry Focus
Crude oil prices ($WTIC) are rising again today, touching levels not seen since 2014. That's absolutely providing further tailwinds for energy (XLE), which is now the best performing sector over the past:
- day
- week
- month
- 3 months
- 6 months
- year
As you know, I haven't been much of an energy bull in the past decade - and for very good reason as it's been, by far, the worst performing sector since 2011. However, if I have one stock market regret in 2021, it's not having been more bullish energy. Are crude oil prices likely getting ahead of itself? Probably. But currently, that doesn't seem to matter as the XLE makes one breakout after another:
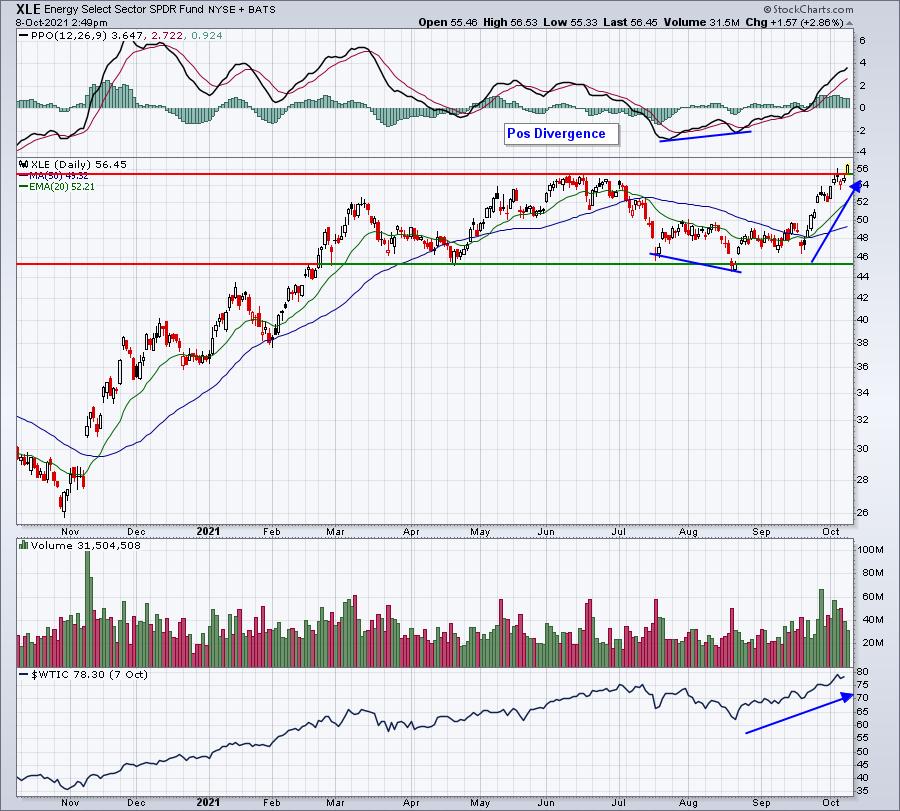
I did discuss a short-term pop that I expected after the positive divergence formed, but I did not see the XLE returning back to new highs.
ChartLists/Strategies
I ran a scan of energy stocks that are on both our Strong Earnings ChartList (SECL) and our Raised Guidance ChartList (RGCL) and there were only two:
OII:
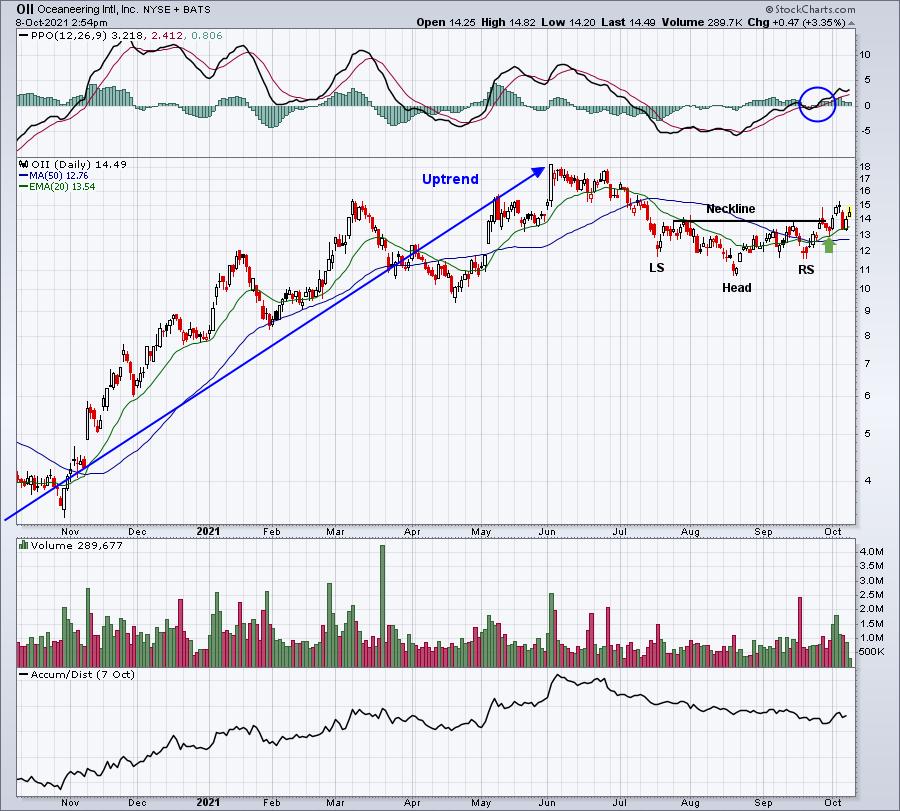
I remember trading OII and having to take a loss as it failed to hold its neckline support on September 28th. However, the green arrow shows the rising 20-day EMA holding as support and OII has been on the move again. Given the strength in energy, I'd be looking for a breakout ahead.
CHX:
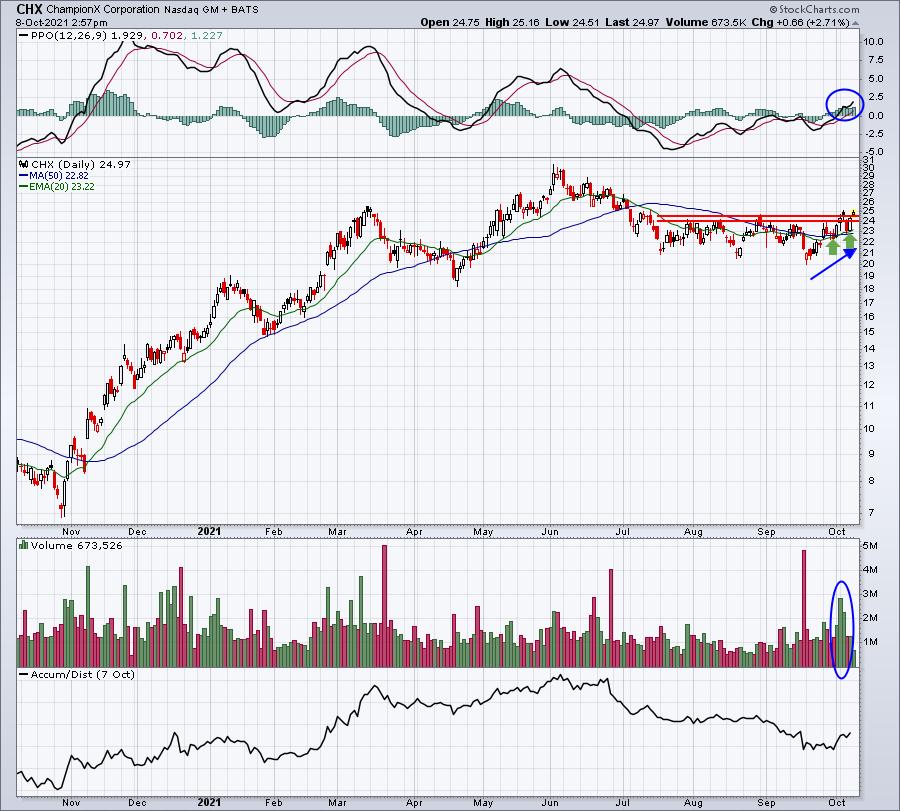
CHX has shown an increase in volume lately and it too has been holding onto rising 20-day EMA support. So long as it continues to do so, I'd expect to see higher prices ahead.
Earnings Reports
Here are the key earnings reports for the next two days, featuring stocks with market caps of more than $10 billion. I also include a few select companies with market caps below $10 billion. Finally, any portfolio stocks that will be reporting results are highlighted in BOLD. If you decide to hold a stock into earnings, please understand the significant short-term risk that you are taking. Please be sure to check for earnings dates for any companies you own or are considering owning.
Friday, October 8:
None
Monday, October 11:
None
Economic Reports
September nonfarm payrolls: 194,000 (actual) vs. 475,000 (estimate)
September private payrolls: 317,000 (actual) vs. 445,000 (estimate)
September unemployment rate: 4.8% (actual) vs. 5.1% (estimate)
September average hourly earnings: +0.6% (actual) vs. +0.4% (estimate)
Happy trading!
Tom