
EB Daily Market Report - Monday, October 18, 2021
Q3 Earnings
At 4:30pm ET today, I will be hosting the "Q3 Earnings" webinar, where I'll provide you a few of the best earnings reports (and reactions) to date, plus take a look ahead to see which companies are likely to report blowout earnings reports and others that may not be so fortunate. You can join the webinar any time after 4:00pm ET (that's the time we'll open the room) and we'll get started promptly at 4:30pm ET. Here's the link:
https://earningsbeats.zoom.us/j/81282152127
ChartFest 2021
We had a GREAT event on Saturday! If you missed it, you can listen to the recording at your leisure. You'll find the recording, along with a number of "gifts" from Grayson Roze and David Keller, on THIS PAGE. You can download the ChartLists from Grayson and Dave directly into your StockCharts.com account, if you're an Extra or Pro member. Otherwise, you can click on the links provided and view their charts. One benefit of having such a close relationship with StockCharts is the ability to have guests from StockCharts share their knowledge, wisdom, and CHARTS with members of EarningsBeats.com. I hope you enjoyed ChartFest 2021!
ChartList Update
I am currently working on the Strong ETF ChartList (SETFCL) and the accompanying ETF Analyzer spreadsheet for use during Tuesday afternoon's "Model ETF Portfolio Draft" event. I am also hoping to update several other ChartLists for members as well. I'll keep you posted on all of this over the next day or two.
Also, please note that we have begun providing Upcoming Earnings ChartLists that summarize the earnings reports of all companies with market caps greater than $1 billion that impact each day's trading. For instance, companies that report after the bell today and before the bell tomorrow are lumped into one ChartList as they both will impact trading tomorrow. You'll find these ChartLists on the ChartLists page under "Stocks" on our website. Scroll down to the bottom of the page and you'll find them. It's just one way that we help you organize the thousands of companies that will be reporting quarterly results over the next 3-4 weeks.
Executive Market Summary
- Futures were lower as we kicked off another trading week, one with an increasing number of earnings reports
- Since the opening, there's been bifurcation with the NASDAQ leading, while the Dow Jones remains in negative territory
- Consumer discretionary (XLY, +1.22%) is the leading sector as automobiles ($DJUSAU, +2.74%) and furnishings ($DJUSFH, +2.00%) are strong
- Tesla (TSLA, +3.60%) is surging towards its all-time high as its earnings date nears (Wednesday, October 20th)
- Technology (XLK, +0.75%) is also strong, behind the relative strength of renewable energy ($DWCREE, +2.71%)
- Crude oil ($WTIC, -0.02%) earlier topped $83 per barrel, but later reversed back to the flat line as energy (XLE, -0.32%) lost its early gains
- September industrial production unexpectedly dropped well below forecasts, but a key housing report was much stronger than expected
- Walt Disney (DIS, -3.75%) and Amgen (AMGN, -2.31%) are the two worst performing Dow component stocks; DIS is nearing an 8-month low, while AMGN approaches its lowest level since the March 2020 low
Market Outlook
Consumer discretionary (XLY) continues to strengthen. For those who haven't seen it, the XLY has a history of showing leadership when its relative momentum (PPO) falls back to test key support:
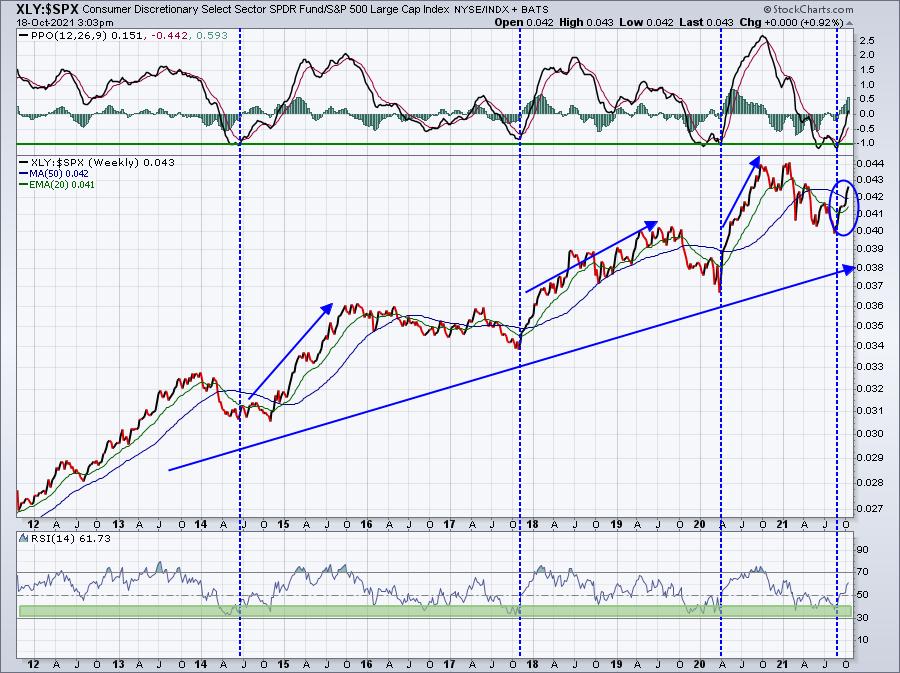
The green-shaded area also marks the relative RSI in the 30-40 range. That area, when tested, also has served as a solid buy signal for the sector.
Sector/Industry Focus
Automobiles ($DJUSAU) are helping to fuel the consumer discretionary push. The following chart shows not only the absolute breakout, but also the building relative strength. At the bottom of the chart, I've added a couple automobile charts (not named Tesla or Nio) that are showing nice recent action:
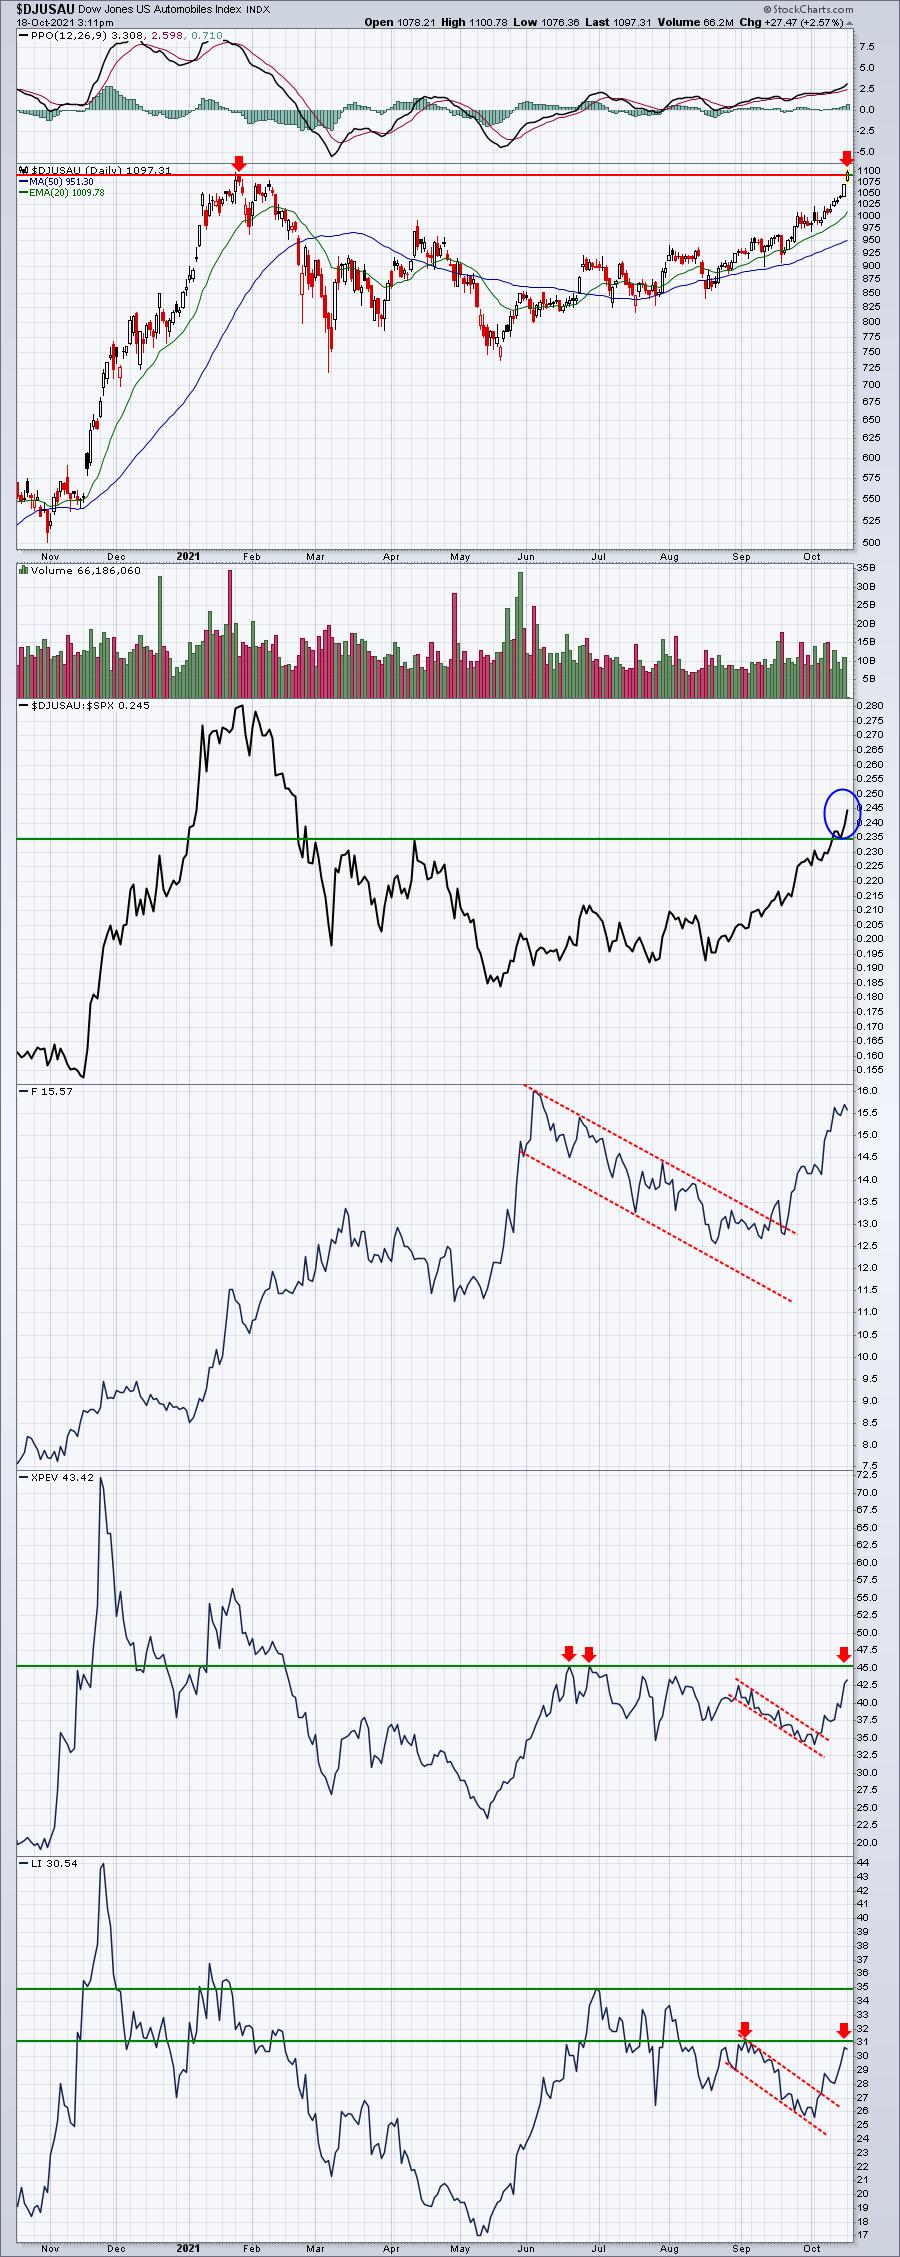
The first and biggest question is......does the DJUSAU hold onto today's breakout into the close. If not, we could see a short-term top and a near-term pullback. TSLA is now within 2% of its all-time high close. We'll need to take our cue from TSLA. When TSLA breaks out, I believe it will spur strength across the board in autos. TSLA's current pre-earnings run already has.
ChartLists/Strategies
Here are two stocks that are worth noting based on current technical developments:
ROKU:
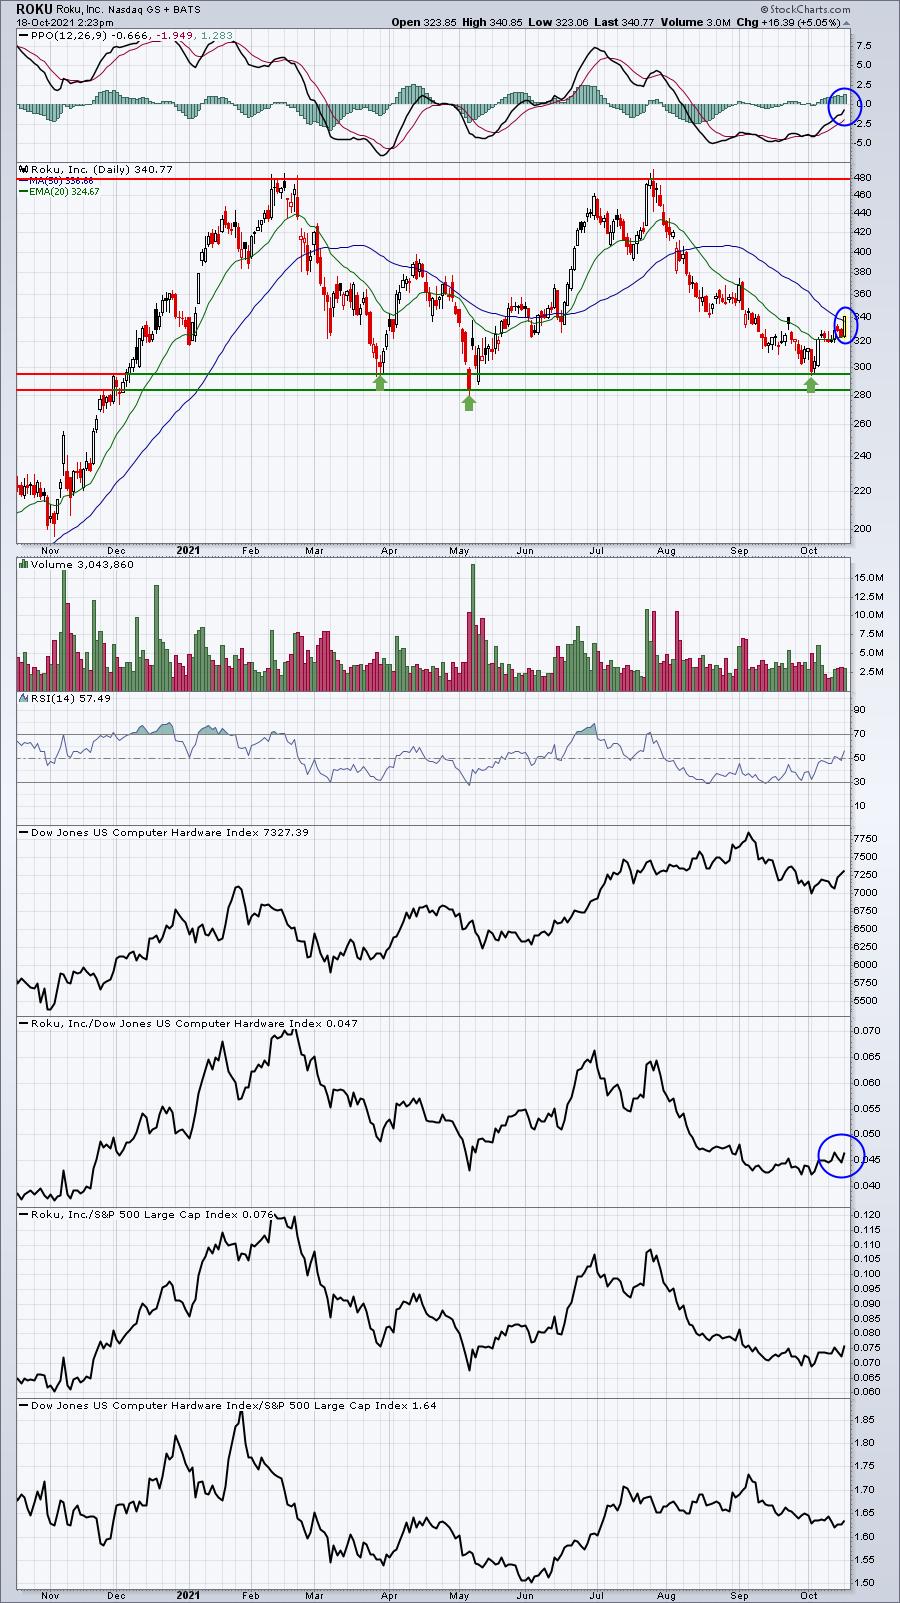
ROKU is attempting to climb back above its 50-day SMA. It's on two key ChartLists of ours - the Strong Earnings ChartList (SECL) and Raised Guidance ChartList (RGCL). These are two meaningful fundamental lists to be a part of and now we're seeing the technical condition here turn bullish. ROKU reports its latest quarterly results in 2-3 weeks in early November, so the strength today COULD be part of a pre-earnings advance.
NIO:
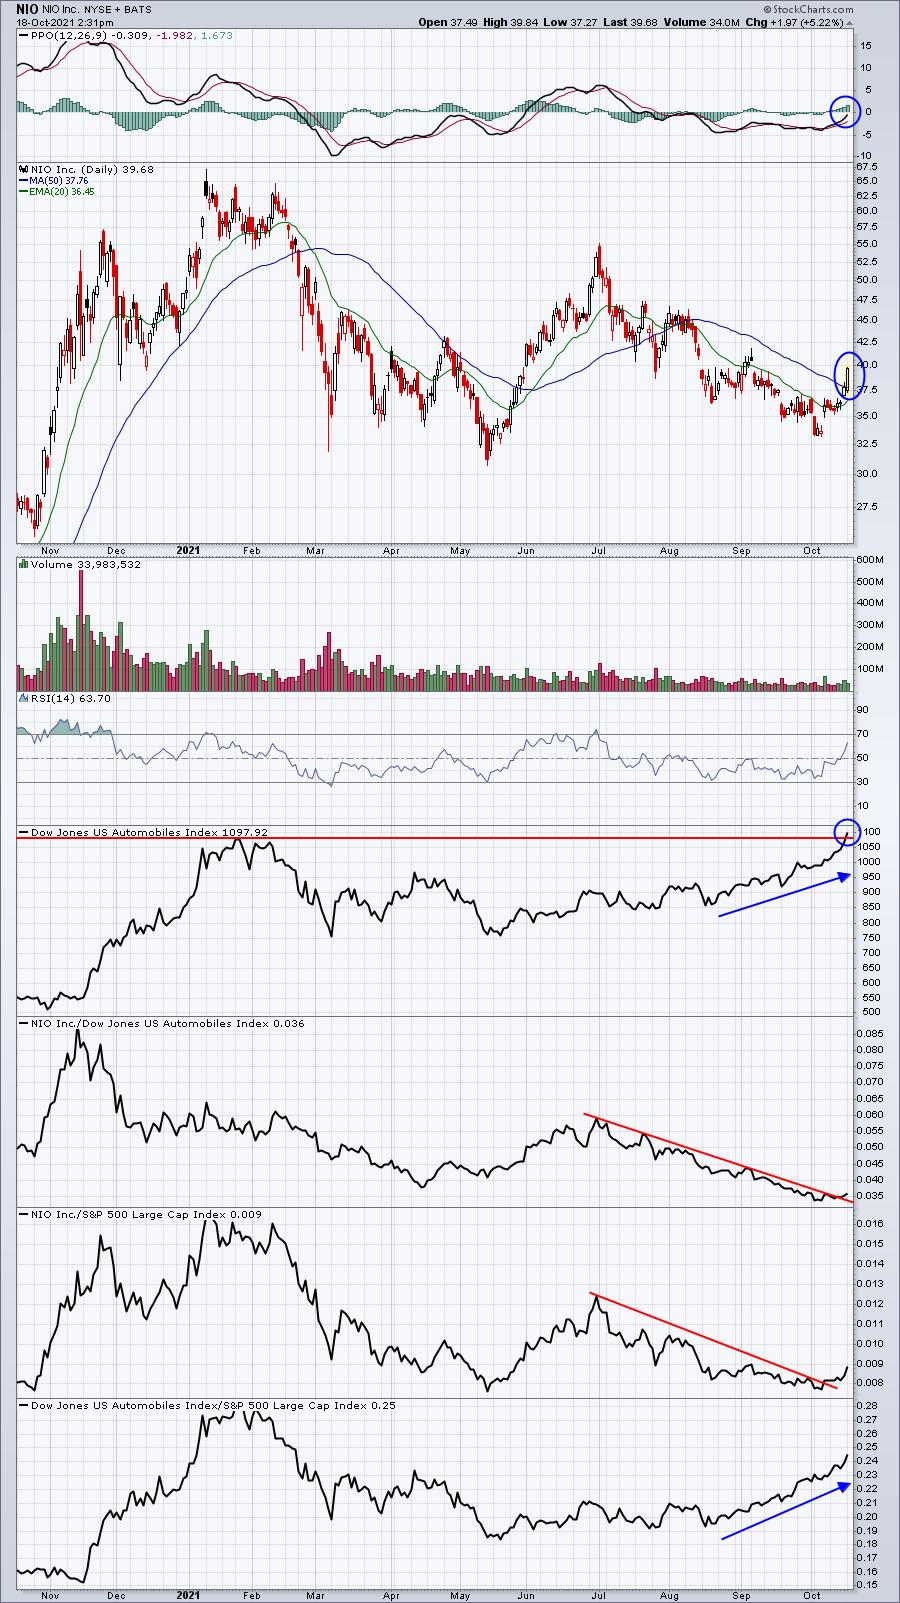
NIO is also moving back through its 50-day SMA. There's more work to be done, but automobiles ($DJUSAU) have just broken out on an absolute basis, but have been strengthening on a relative basis for the past two months. That won't hurt when it comes to NIO's future performance. Unlike ROKU, NIO is not on any of our ChartLists at EarningsBeats.com, so any trade would be based strictly on its current technical developments.
Earnings Reports
Here are the key earnings reports for the next two days, featuring stocks with market caps of more than $10 billion. I also include a few select companies with market caps below $10 billion. Finally, any portfolio stocks that will be reporting results are highlighted in BOLD. If you decide to hold a stock into earnings, please understand the significant short-term risk that you are taking. Please be sure to check for earnings dates for any companies you own or are considering owning.
Monday, October 18:
STT, ELS, ACI, STLD, PACW, HXL, FNB
Tuesday, October 19:
JNJ, PG, NFLX, PM, ISRG, CNI, AMX, BK, ERIC, TRV, FITB, IBKR, SYF, KSU, DOV, HAL, OMC, SBNY, UAL, CBSH, SNV, MAN, IRDM
Economic Reports
September industrial production: -1.3% (actual) vs. +0.2% (estimate)
September capacity utilization: 75.2% (actual) vs. 76.5% (estimate)
October housing market index: 80 (actual) vs. 75 (estimate)
Happy trading!
Tom