
EB Daily Market Report - Tuesday, October 19, 2021
It's "DRAFT DAY"
At 5:30pm ET today, I will be hosting our Model ETF Portfolio Draft to unveil the next batch of ETFs that we will hold for the next three months. As of this DMR, our Model ETF Portfolio is edging the S&P 500 by nearly one-half of a percentage point for the current quarter (July 19th - October 19th). I'll be looking for themes that I expect to play out through year end and select ETFs to hopefully take advantage of those themes. You can join me by clicking on the following room link (the room will be open by 5:00pm ET):
https://earningsbeats.zoom.us/j/83108061066
If you cannot attend today's event, we will record it and be sure to get you a copy to view later.
ChartList Update
The following ChartLists/downloads have been updated:
- Strong ETF ChartList (SETFCL)
- ETF Analyzer - Excel spreadsheet
- Strong Earnings ChartList (SECL)
- Strong Future Earnings ChartList (SFECL)
- Raised Guidance ChartList (RGCL)
We should have all links posted to our website by this afternoon. If you check and they haven't been updated, just check back a little later.
Executive Market Summary
- Futures were higher across-the-board overnight and our major indices have mostly strengthened since the opening bell
- The 10-year treasury yield ($TNX) is up 5 basis points to 1.63%, despite a not-so-great housing starts report
- Somewhat surprisingly, technology (XLK, +0.92%) is outperforming financials (XLF, +0.68%) on a day that yields are rising
- Health care (XLV, +1.36%) is today's best sector as the group tries to clear its 20-day EMA and begin repairing its chart - see Sector/Industry Focus below
- Commodities are slightly higher on the session as crude oil ($WTIC) is up 0.61% to nearly $83 per barrel
- Ulta Beauty (ULTA, -9.62%) is the worst performing S&P 500 stock as providing revenue guidance that disappointed Wall Street
- Meanwhile, Johnson & Johnson's (JNJ, +1.97%) quarterly earnings report is helping to boost a health care group that's been struggling of late
Market Outlook
The rotation from asset classes, particularly from the bond market to the stock market, continues. Treasury yields rising means that treasuries are selling. Those proceeds almost always find their way into the stock market, which is why the following relationship exists:
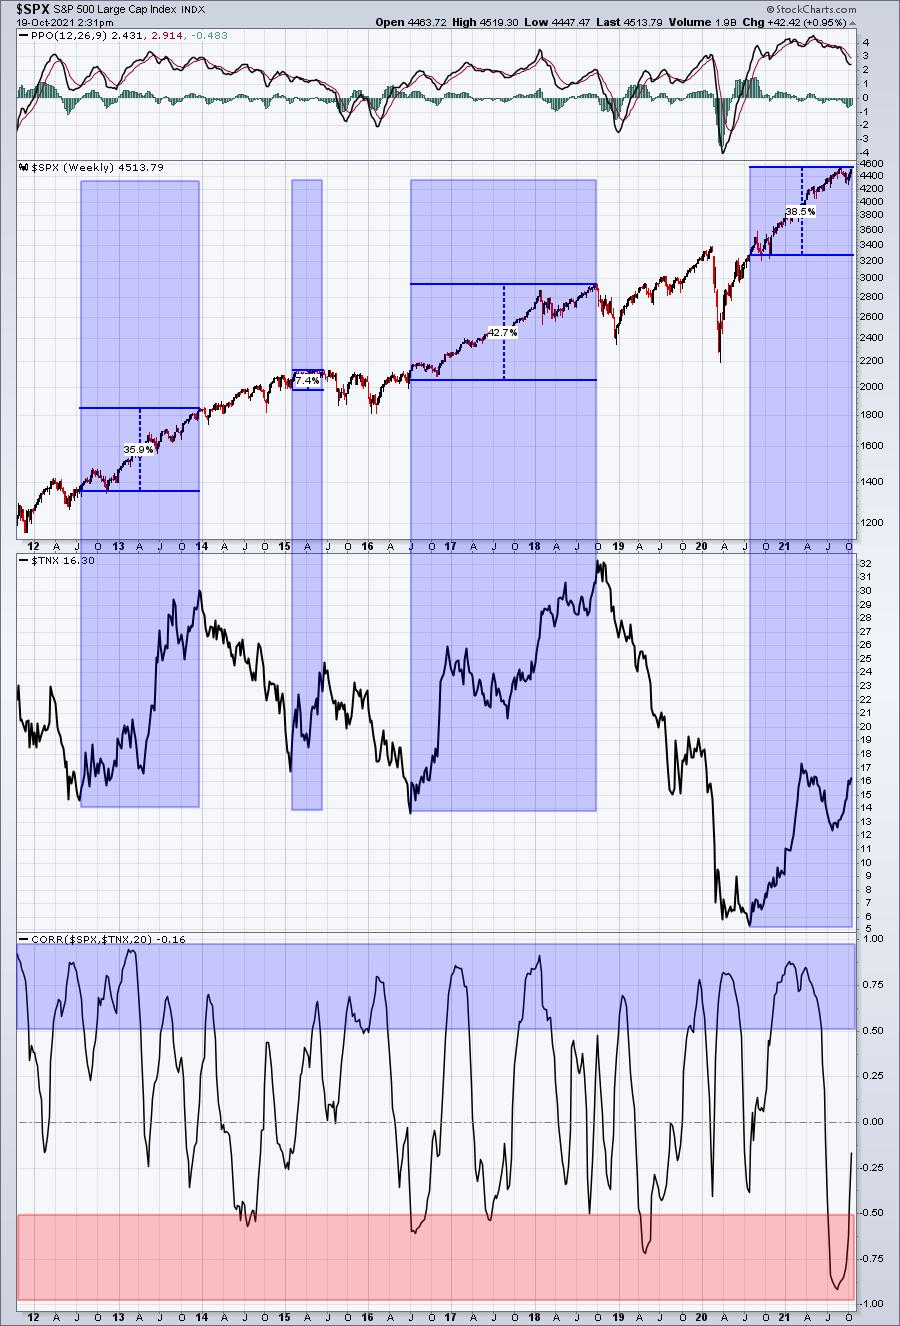
During periods of rising treasury yields, the S&P 500 tends to perform extremely well, while periods of falling yields can lead to very choppy action during secular bull markets. During secular bear markets, drops in treasury yields tend to coincide with HUGE stock market selloffs. At the bottom of the above chart, the blue-shaded area marks periods of very positive correlation (> 0.50), while the red-shaded areas mark periods of very negative, or inverse, correlation (< -0.50). You can see that the correlation between these two charts - the S&P 500 and treasury yields - is generally quite positive.
Sector/Industry Focus
Health care (XLV) has been very weak since topping back on September 3rd. The last two rally attempts have been shunned by the bears at the 20-day EMA. Currently, the XLV has broken above that key moving average, but will it hold into today's close and can the bulls build on this strength in the final hour?
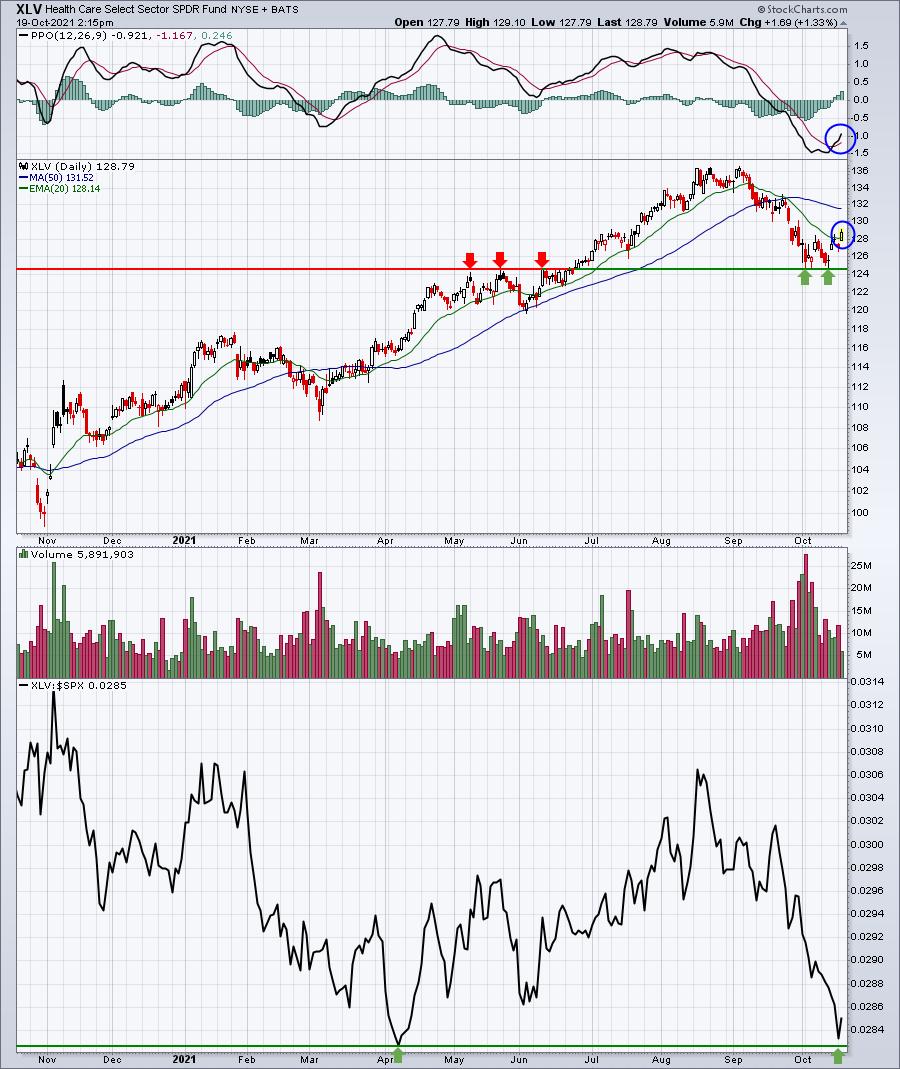
Relative support was nearly tested as the XLV tries to turn higher vs. the benchmark S&P 500. If this breakout today holds, I think the XLV could challenge 132-133 in the near-term, before possibly printing the right side of a neckline.
ChartLists/Strategies
Below is an apparel retailer that is on our Raised Guidance ChartList (RGCL). I like the price support test and the fact that its relative strength vs. its apparel retailer peers is holding up:
FIGS:
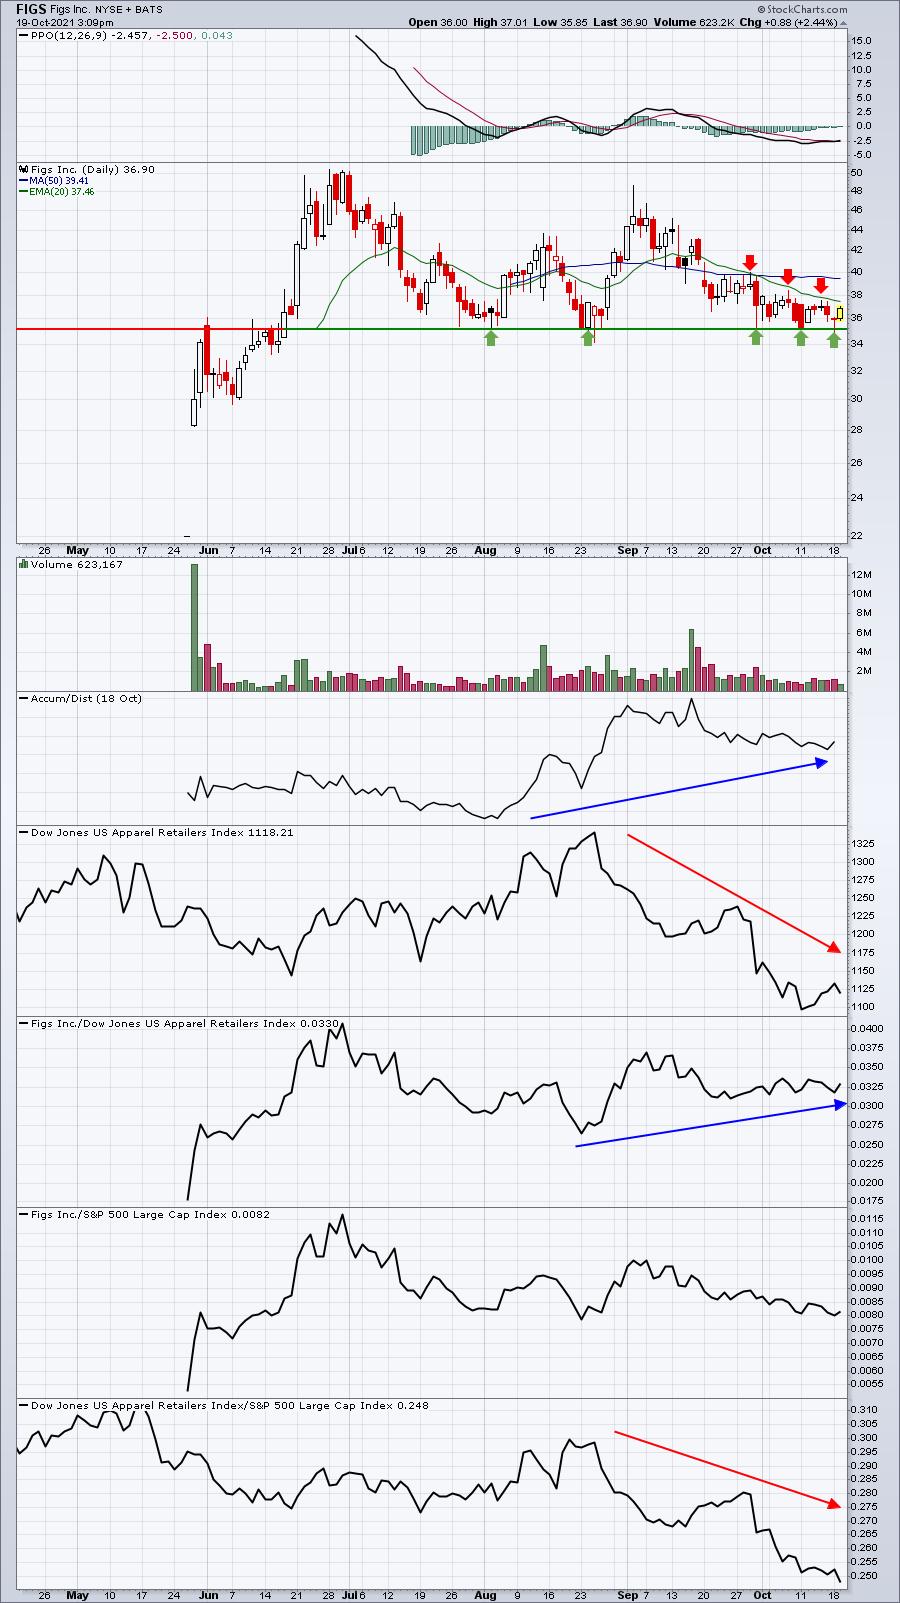
A break above the 20-day EMA would be the initial sign that technical conditions are improving here. Until then, we need to be careful, because the group has been under a lot of pressure.
Earnings Reports
Here are the key earnings reports for the next two days, featuring stocks with market caps of more than $10 billion. I also include a few select companies with market caps below $10 billion. Finally, any portfolio stocks that will be reporting results are highlighted in BOLD. If you decide to hold a stock into earnings, please understand the significant short-term risk that you are taking. Please be sure to check for earnings dates for any companies you own or are considering owning.
Tuesday, October 19:
JNJ, PG, NFLX, PM, ISRG, CNI, AMX, BK, ERIC, TRV, FITB, IBKR, SYF, KSU, DOV, HAL, OMC, SBNY, UAL, CBSH, SNV, MAN, IRDM
Wednesday, October 20:
TSLA, ASML, VZ, ABT, NEE, IBM, ANTM, LRCX, CSX, CCI, CP, BIIB, KMI, DFS, PPG, NDAQ, EFX, LVS, BKR, NTRS, XM, CFG, MTB, MKTX, GGG, CMA, BMO, LAD, KNX, OMF, THC, SLG, WGO
Economic Reports
September housing starts: 1,555,000 (actual) vs. 1,621,000 (estimate)
September building permits: 1,589,000 (actual) vs. 1,680,000 (estimate)
Happy trading!
Tom