
EB Daily Market Report - Thursday, October 21, 2021
Executive Market Summary
- Futures were lower overnight, but equities remain resilient as the NASDAQ has moved into positive territory
- The 10-year treasury yield ($TNX) has jumped 3 more basis points to 1.67%, but surprisingly financials (XLF, -0.60%) are not benefiting
- Consumer discretionary (XLY, +1.16%) is showing considerable relative strength as automobiles ($DJUSAU, +2.90%) and specialty retailers ($DJUSRS, +2.77%) shine
- Tesla (TSLA, +3.13%) reported strong quarterly results and is testing its all-time high from January 25th at 900.40; today's high was 900.00 earlier
- International Business Machines (IBM, -8.17%) is getting slammed after reporting earnings and it's, by far, the worst Dow Jones performer on today's session
- Cryptocurrencies have settled down today amidst profit taking after bitcoin ($BTCUSD, -4.23%) set a record closing high above 66,000 on Wednesday
- Copper ($COPPER, -3.60%), after testing its May high in the 4.80-4.90 area, is seeing profit taking as well
- Crude oil ($WTIC, -2.37%) has fallen 2 bucks today and now trades at 81.50; accordingly, energy (XLE, -1.69%) is the worst performing sector today
Market Outlook
Yesterday, the Dow Jones and S&P 500 both had opportunities to close at all-time highs.....and failed. We're failing so far today on both of these indices as well. The NASDAQ 100 ($NDX) hasn't reached its early-September high, but it could be printing the up-sloping right side of a neckline within a bullish inverse head and shoulders continuation pattern. Take a look:
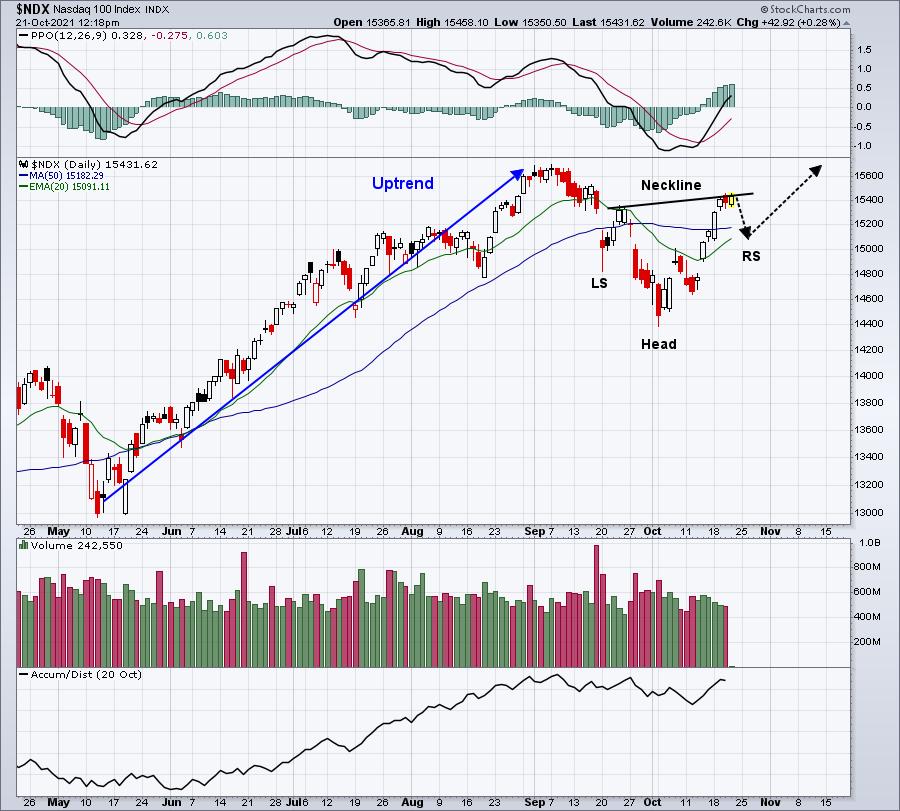
There's no guarantee that this pattern will continue to form. The market remains quite bullish after recently breaking out of its A-B-C selloff pattern. But knowing that history isn't exactly kind to U.S. equities over the next week leaves me at least considering the possibility of a short-term pullback. We'll see.
Sector/Industry Focus
International Business Machines (IBM), or "Big Blue", should be renamed "Big Black and Blue" because its chart appears as though it's been through a 10-year fight between the bulls and bears:
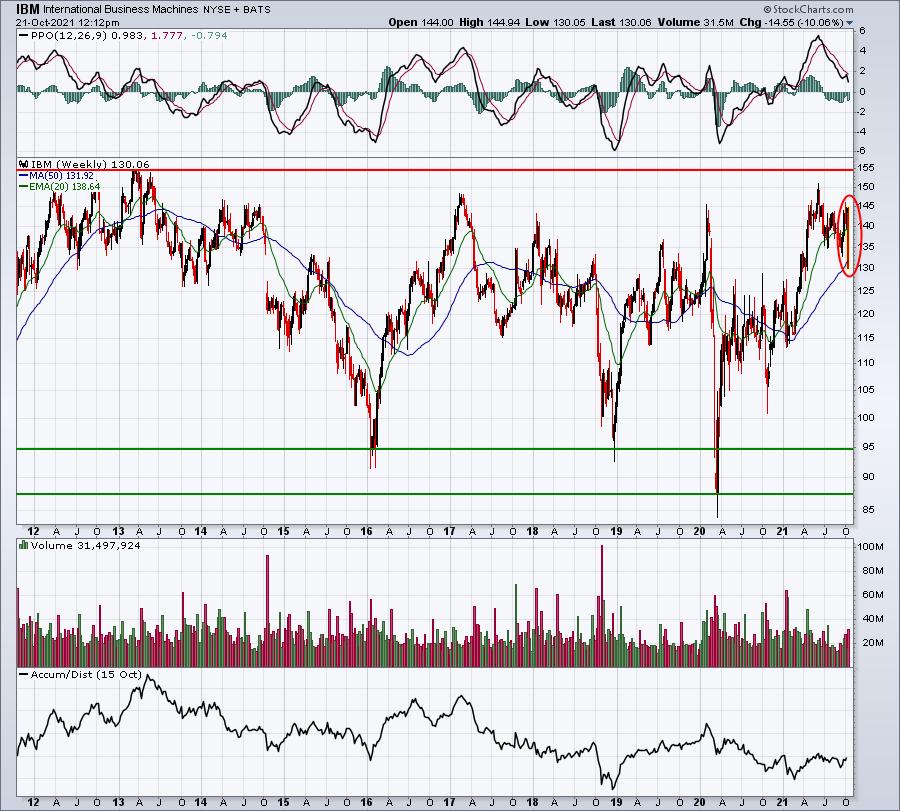
What bull market? IBM now trades at 130, close to 20% below the high it set in early 2013. By comparison, the S&P 500 has nearly tripled over the same time frame.
ChartLists/Strategies
I don't know if history (October 22 through October 27 is historically the worst week of the year) results in a short-term pullback or not, but if it does, those that have false breakouts today could be the most vulnerable. Here are a few stocks that could potentially suffer IF they fail to hold intraday breakouts:
TSLA:
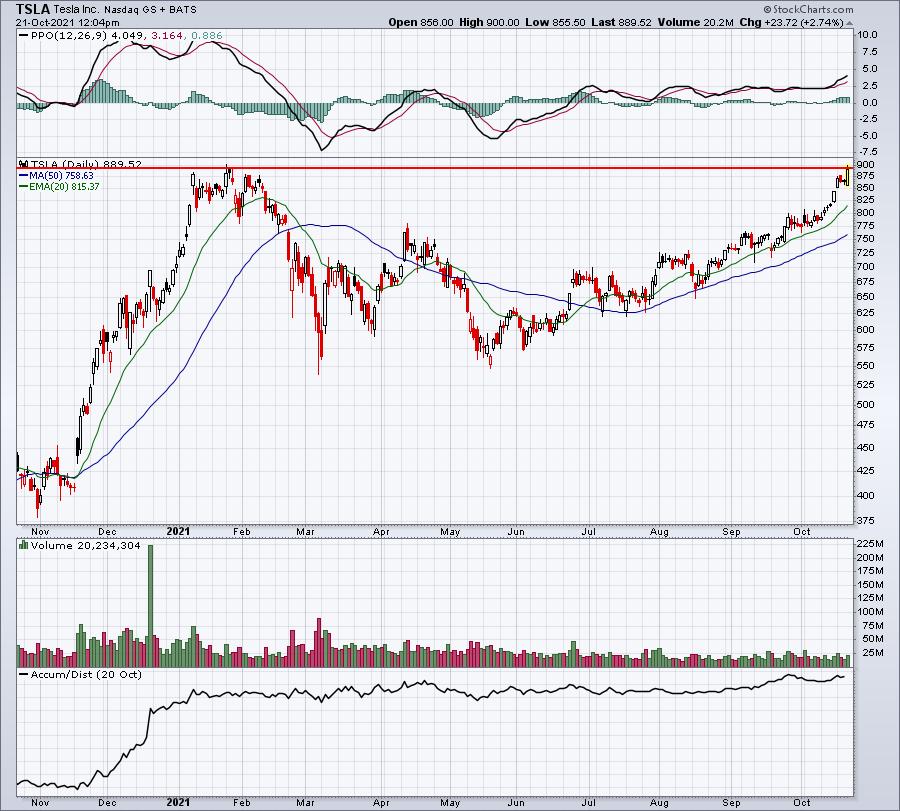
I'm a HUGE fan of TSLA, but we can't assume it's going to roll right through a major resistance level. It might, but hitting 900 could be a psychological obstacle as well.
AMBA:
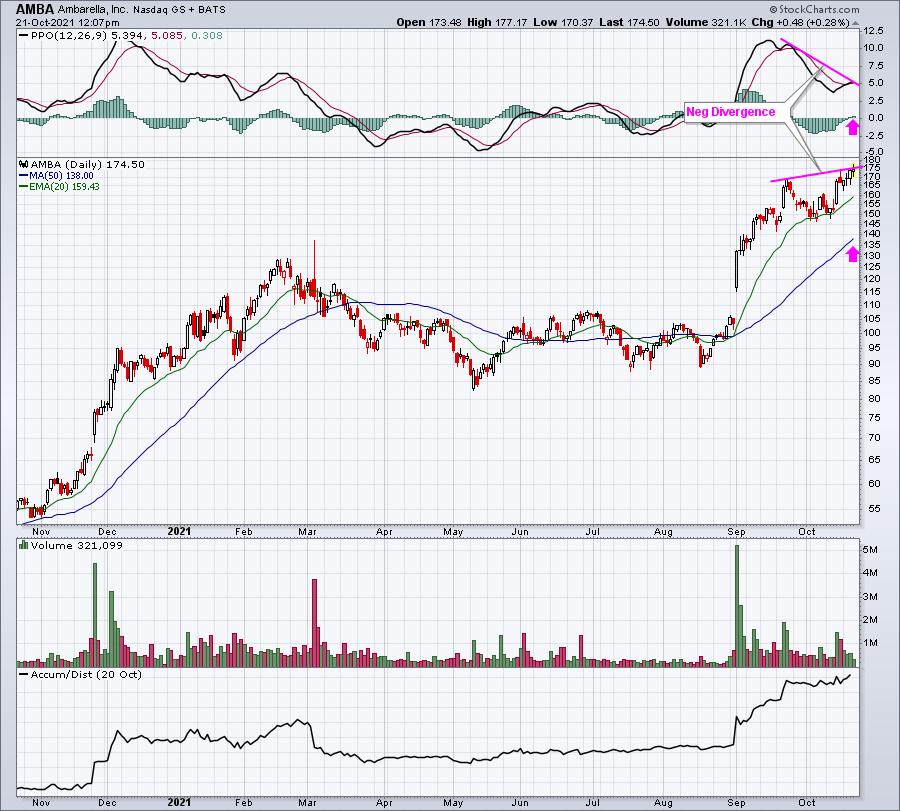
This is a great chart. Volume trends are strong, the AD line is soaring, and AMBA looks like it'll eventually reach higher levels. But it would likely be a mistake to ignore any reversing candle that might appear, given that negative divergence. I've included pink arrows to mark the PPO centerline and 50 day SMA, two areas that are tested many times after negative divergences print.
AN:
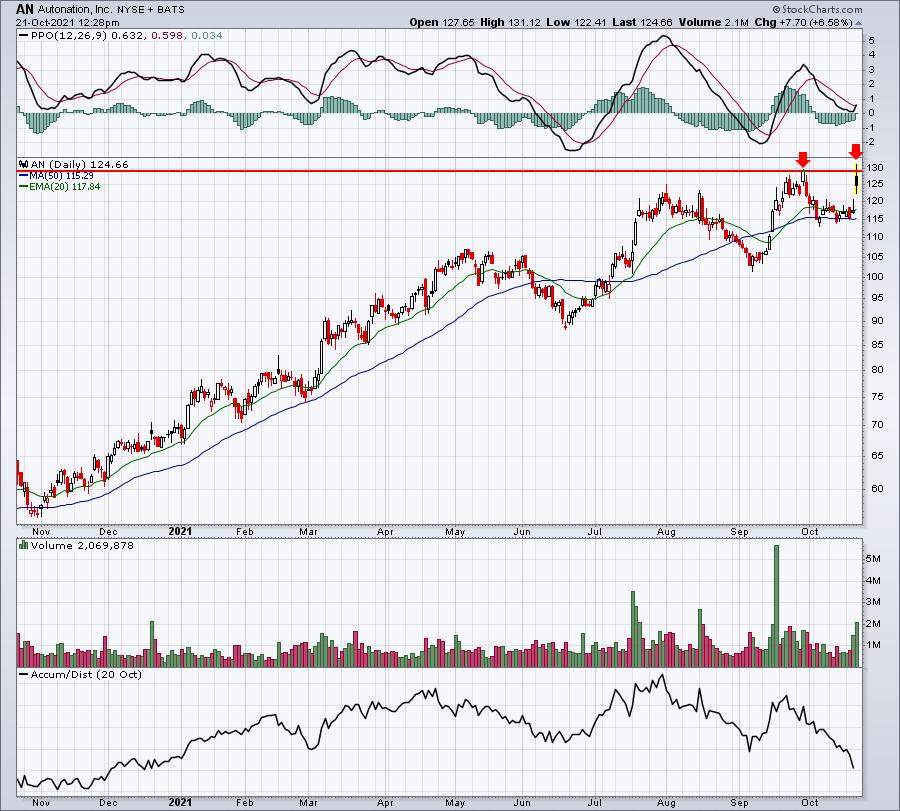
Earnings were strong on AN, but a failed breakout on heavy volume is not a good look. Short-term, 115 could come into play and if AN's selling were to accelerate, I wouldn't rule out 103. Now, if AN can reverse back to the upside later this afternoon and close at a fresh high, then I'd be much more bullish.
Earnings Reports
Here are the key earnings reports for the next two days, featuring stocks with market caps of more than $10 billion. I also include a few select companies with market caps below $10 billion. Finally, any portfolio stocks that will be reporting results are highlighted in BOLD. If you decide to hold a stock into earnings, please understand the significant short-term risk that you are taking. Please be sure to check for earnings dates for any companies you own or are considering owning.
Thursday, October 21:
INTC, DHR, T, SAP, UNP, SNAP, BX, MMC, ABB, FCX, CMG, IQV, DOW, SIVB, VLO, NUE, LUV, RCI, TSCO, KEY, ALLY, POOL, CE, GPC, DGX, IPG, WRB, WHR, AAL, RHI, WAL, ALLE, SNA, EWBC, CSL, CROX, AN, OLN, ALK, MAT, GTLS, OZK, TPH, SCHN
Friday, October 22:
HON, AXP, HCA, ROP, SLB, VFC, RF, STX, CLF, GNTX, ALV, SMPL
Economic Reports
Initial jobless claims: 290,000 (actual) vs. 300,000 (estimate)
October Philadelphia Fed Manufacturing Index: 23.8 (actual) vs. 25.0 (estimate)
September existing home sales: 6,290,000 (actual) vs. 6,030,000 (estimate)
September leading indicators: +0.2% (actual) vs. +0.5% (estimate)
Happy trading!
Tom