
EB Daily Market Report - Friday, October 22, 2021
Executive Market Summary
- Futures were fairly flat overnight, though NASDAQ futures were weak on a relative basis
- The NASDAQ has remained under a bit of selling pressure throughout the day
- Cryptocurrencies have sold off for a second consecutive day after bitcoin ($BTCUSD, -3.86%) set its all-time high on Tuesday; it's now dropped more than 8% over two days
- Commodity prices are mostly higher as crude oil ($WTIC, +1.54%) nears $84 per barrel; gold ($GOLD, +0.79%) is just below $1800 per ounce
- The 10-year treasury yield ($TNX) is down 2 basis points to 1.65%
- Financials (XLF, +1.27%) lead the S&P 500 higher today, while significant weakness is found in communication services (XLC, -2.36%)
- Internet stocks ($DJUSNS, -3.51%) are extremely weak after Snap, Inc. (SNAP, -25.82%) reported revenues below expectations and lowered future revenue guidance due to Apple privacy issues on mobile devices
Market Outlook
A few weeks ago, I wrote about materials (XLB) and how key price support needed to hold. That support held. Now the group has rallied back to key short-term price resistance. So the question today is whether this resistance level holds. As a result, I'd be inclined to avoid materials UNLESS they are able to make the breakout:
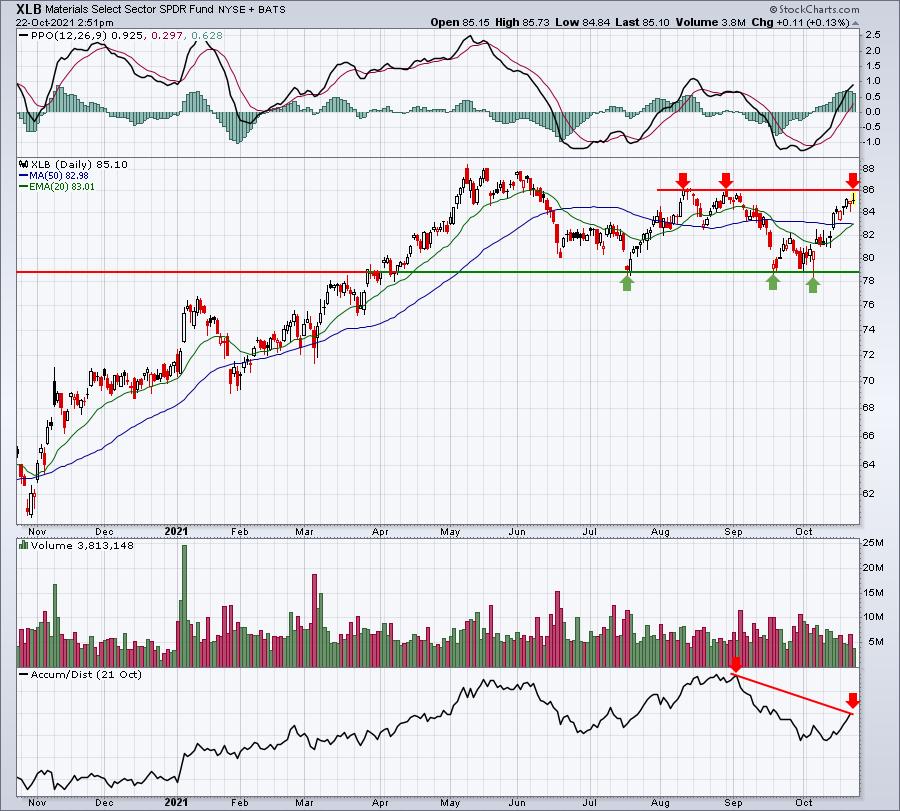
One negative is the AD line, which is well below its early-September level, while price has returned back to its previous high. Volume has been declining during October on this latest advance, so volume trends definitely are more bearish. None of this suggests that the XLB will fail to break above 86 resistance. It just simply raises a caution flag. I'd be cautious for this reason.
Sector/Industry Focus
Copper ($COPPER) is the one commodity to follow to determine what markets think of the global economy. When global economic activity picks up, copper prices rise due to increasing demand. Below is a long-term chart of copper and the correlation between copper and the S&P 500:
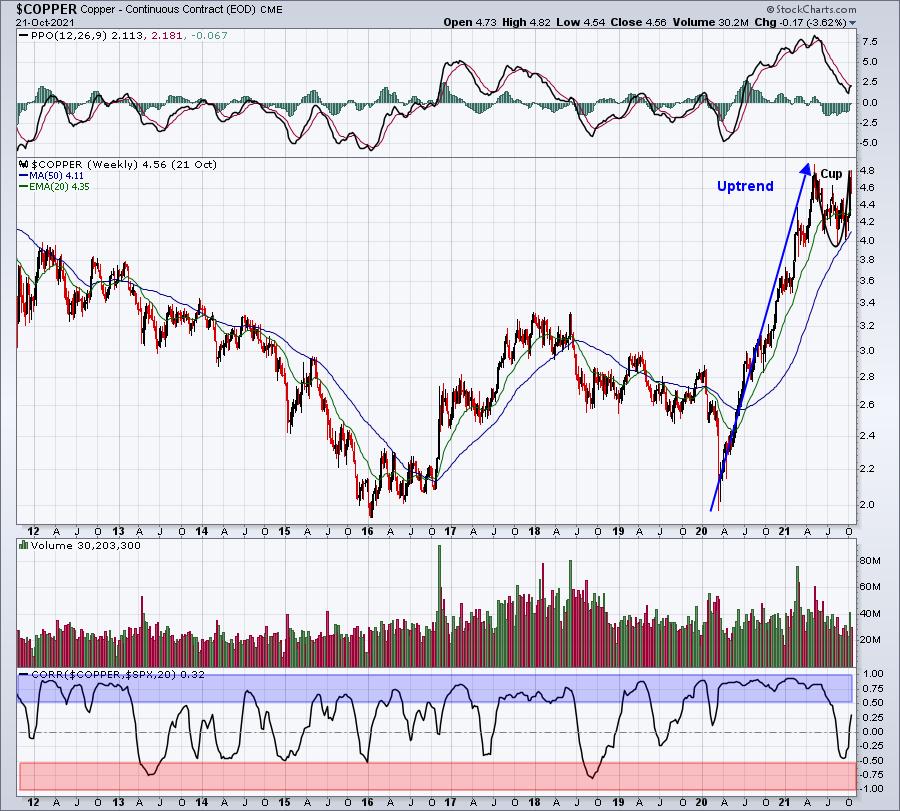
Copper prices have jumped from 2 bucks to nearly 5 bucks since the pandemic-driven low in March 2020. That's a clear indication that global demand has increased significantly, which is a very bullish sign for equities. The bottom panel shows that the correlation is almost always positive. The blue-shaded area represents positive correlation greater than 0.50. The red-shaded area represents negative, or inverse, correlation that exceeds -0.50. Correlation spends much, much more time in the blue-shaded area, so the only conclusion here is that when copper prices rise, it's a very solid indication that the S&P 500 will follow suit.
ChartLists/Strategies
Today marks the start of the worst historical week on the S&P 500 since 1950. This seasonal bearishness ends at the close next Wednesday, October 27th. While there are no guarantees that we see any selling whatsoever, I do believe we should be prudent in taking on any new positions over the course of the next week. If you do add positions, I'd consider smaller-than-normal position sizes for now.
We'll hold off on new trades this afternoon and wait for new opportunities next week.
Earnings Reports
Here are the key earnings reports for the next two days, featuring stocks with market caps of more than $10 billion. I also include a few select companies with market caps below $10 billion. Finally, any portfolio stocks that will be reporting results are highlighted in BOLD. If you decide to hold a stock into earnings, please understand the significant short-term risk that you are taking. Please be sure to check for earnings dates for any companies you own or are considering owning.
Friday, October 22:
HON, AXP, HCA, ROP, SLB, VFC, RF, STX, CLF, GNTX, ALV, SMPL
Monday, October 25:
FB, KMB, CDNS, OTIS, ARE, SUI, QSR, BRO, LOGI, CCK, PKG, LII, UHS, AGNC, MEDP, TNET, CR
Economic Reports
October PMI composite: 57.3 (actual) vs. 55.5 (estimate)
Happy trading!
Tom