
EB Daily Market Report - Tuesday, October 26, 2021
Executive Market Summary
- Futures were strong overnight and our major indices opened higher and have remained fairly strong throughout the session
- Stronger-than-expected economic reports have resulted in dollar strength (UUP, +0.18%)
- Despite dollar strength, energy (XLE, +0.78%) remains quite strong as crude oil prices ($WTIC, +0.55%) move back above $84 per barrel
- Gold ($GOLD, -1.07%) is being inversely impacted, however, as it moves back below $1800 per ounce
- Consumer discretionary (XLY, +1.17%) again leads as automobiles ($DJUSAU, +1.87%) were very strong earlier behind big gains in Tesla (TSLA, +2.67%)
- Semiconductors ($DJUSSC, +1.77%) are powering ahead as well, led by NVIDIA (NVDA, +7.35%) and Advanced Micro Devices (AMD, +2.27%)
- Earnings are starting to pour in, so please be sure to check the earnings dates for any companies you own; Microsoft (MSFT), Alphabet (GOOGL), and AMD all report after the closing bell today
- United Parcel Services (UPS, +7.61%) surprised to the upside with its revenue and EPS, helping to fuel another transportation rally ($TRAN, +1.30%); the TRAN is threatening to close at an all-time high today
Market Outlook
What does the long-term monthly chart look like on the S&P 500? Well, I believe it remains incredibly bullish, though overbought by most standards:
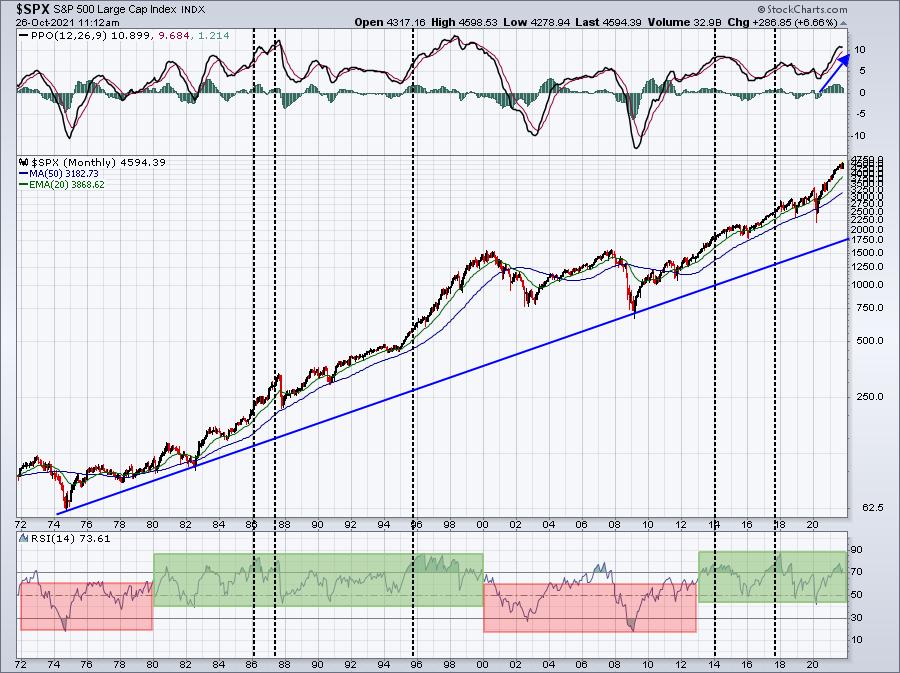
The black-dotted vertical lines mark secular bull market periods where the monthly RSI has moved into the mid-70s. We've seen continued strength in such circumstances in the past, especially in the second half of the 1990s. I believe sitting out overbought conditions, waiting for big selloffs is a huge mistake. To me, it's worth the downside risk to remain invested - especially if you're a long-term investor.
Sector/Industry Focus
At this point, I believe it's rather clear that money is pouring into the consumer discretionary (XLY) space. Energy (XLE) has been hot for sure, but the XLY is making headway against all sectors right now. This is easy to see in the Sector Summary for the past week:
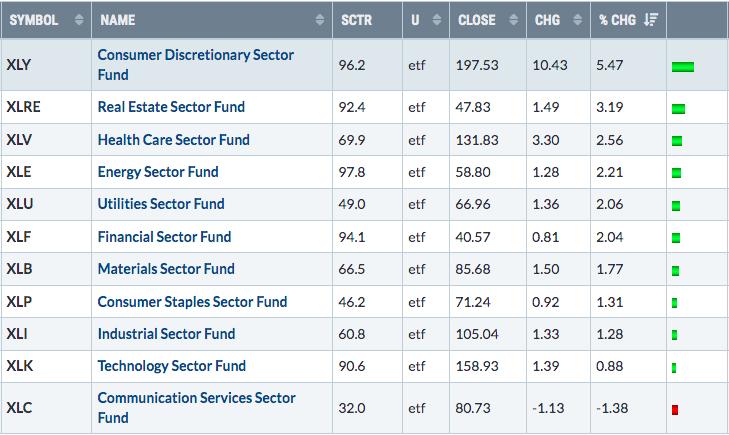
The XLY is 2nd among sectors over the past month (XLE leads) and 3rd over the past three months (XLE and XLF lead). It's storming up the sector leaderboard, so we want to see which industry groups are driving this action. One easy way to do it is simply look at the Industry Summary for the past month. Here it is:
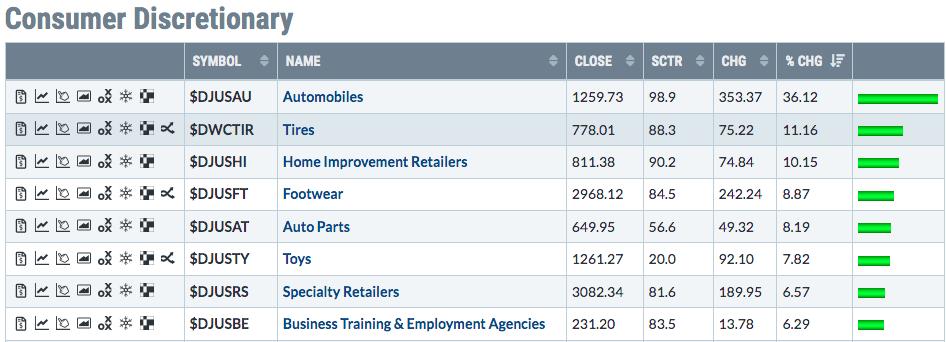
Autos are the primary reason for the XLY's surge higher, but there are plenty of other groups to consider as well. One surprise for me was toys ($DJUSTY), which is beginning to show a bit of leadership after a very rough 2021. The daily chart now shows price action above its key moving averages, but the longer-term weekly chart shows a key test approaching:
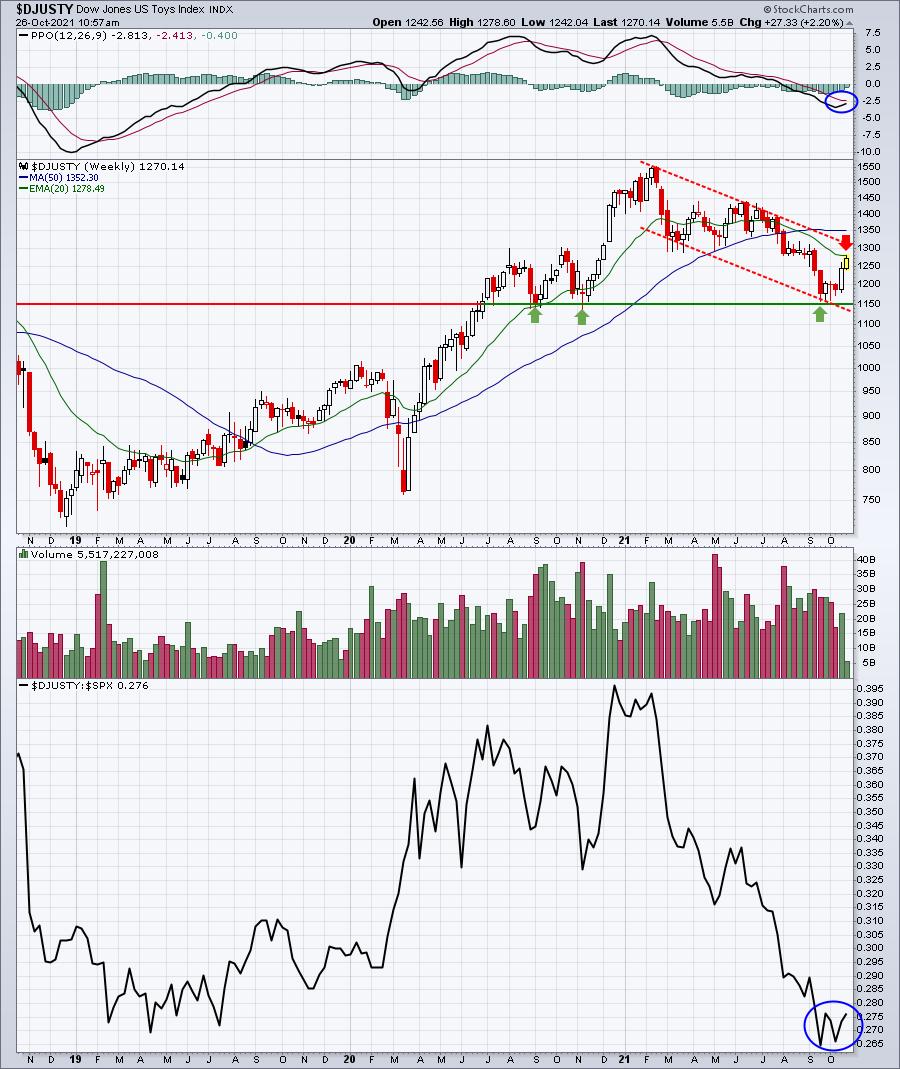
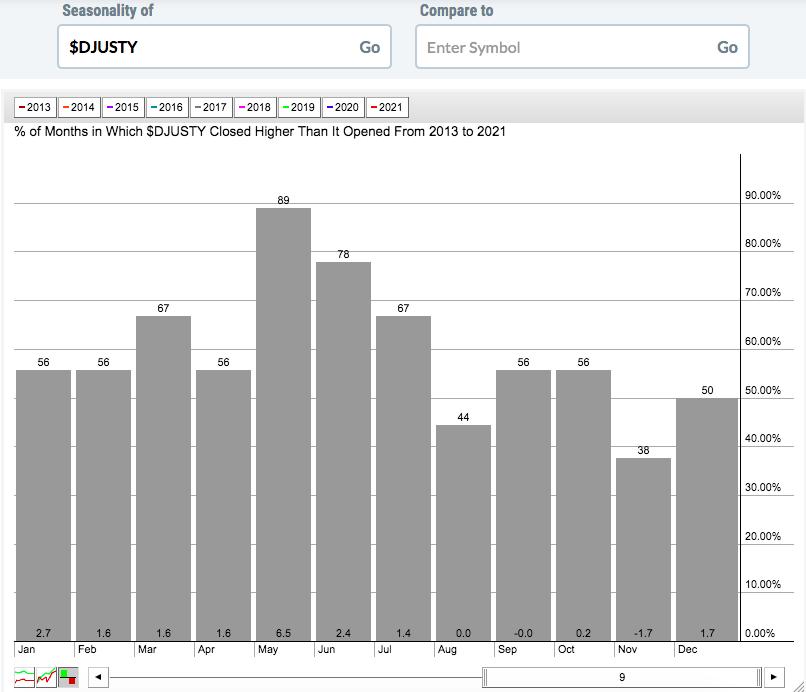
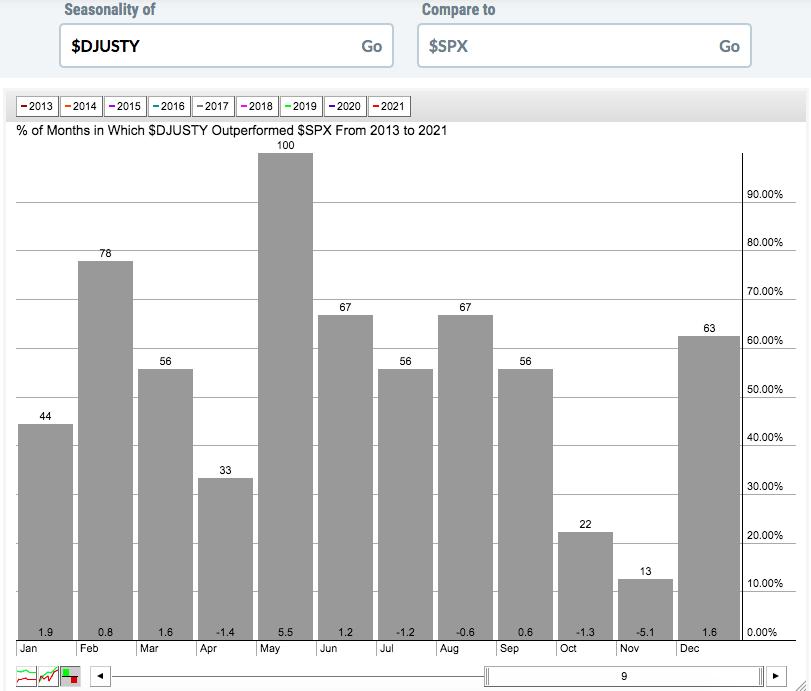
Let's watch the 20-week EMA resistance, together with the current down channel. Clearing both would be very bullish, but there's more work left to do here. Seasonality suggests that we hold off on this group until we see the technical picture improve further. Since 2013, toys have performed very poorly during the month of November, its worst month of the year on both an absolute and relative basis. Check this out:
DJUSTY (absolute returns by month):
DJUSTY (relative returns vs. S&P 500 by month):
Anything is possible in the stock market, which we should all know by now, but the odds certainly appear to be favoring investing in other areas of consumer discretionary at the moment. Of course, we'll keep following the action and report technical changes and developments as they occur.
ChartLists/Strategies
Sticking with the theme of strong automobiles and transportation stocks, here are two charts that are worth considering:
XPEV:
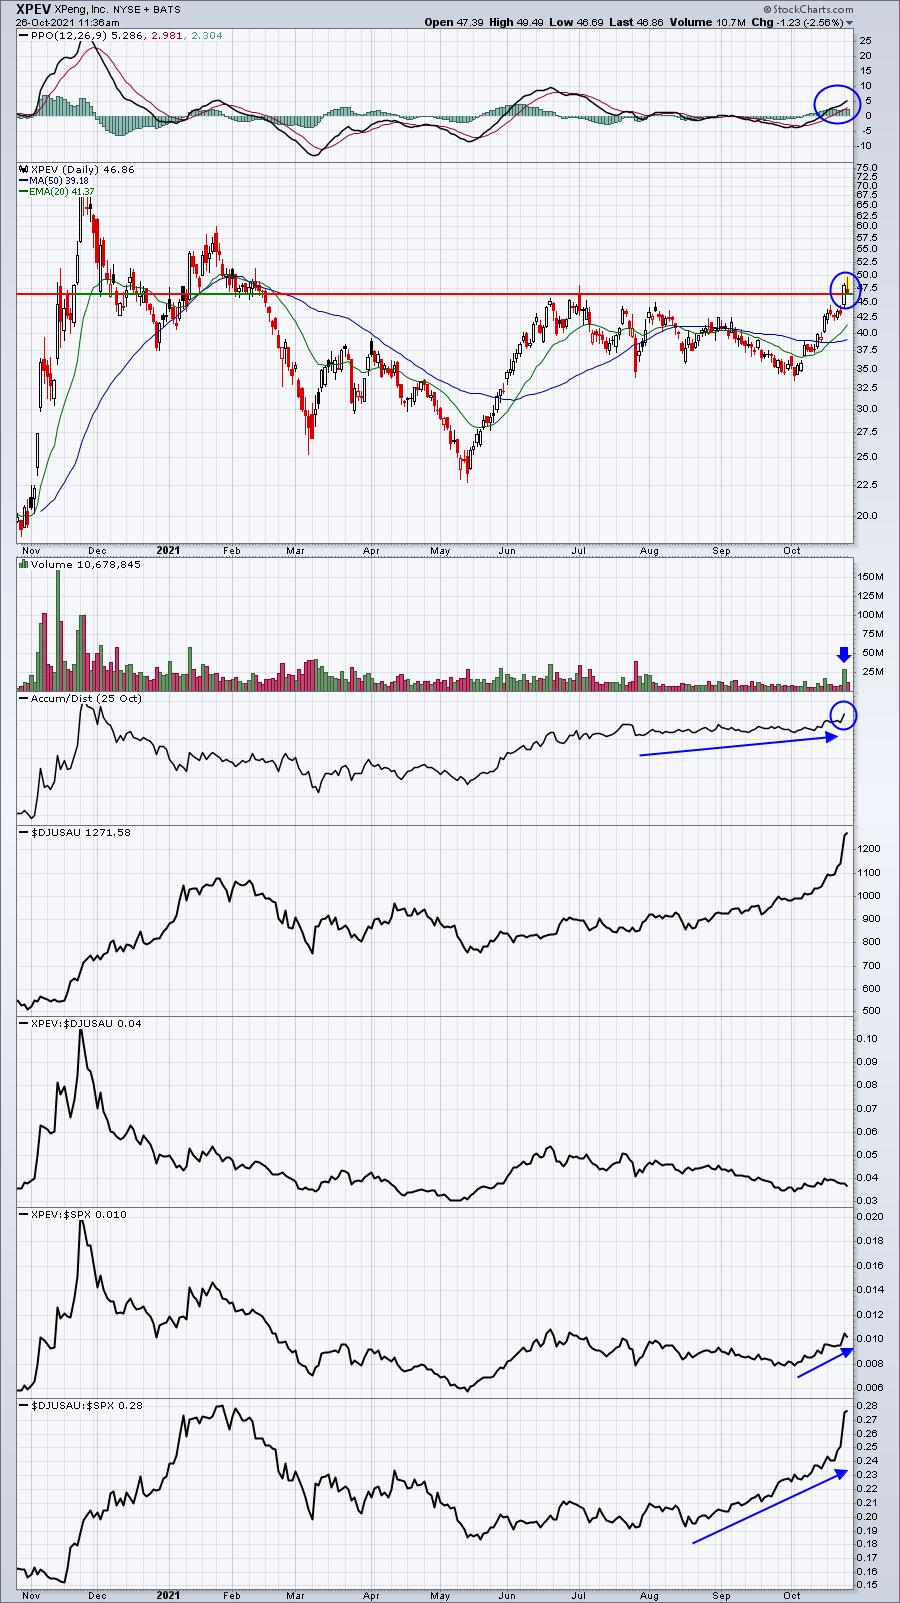
I like the Monday breakout on increasing volume. Today's pullback could be providing an opportunity for entry, though I will emphasize this is a fast-moving stock that carries considerable risk. Be sure you're willing to accept that elevated risk before trading.
MATX:
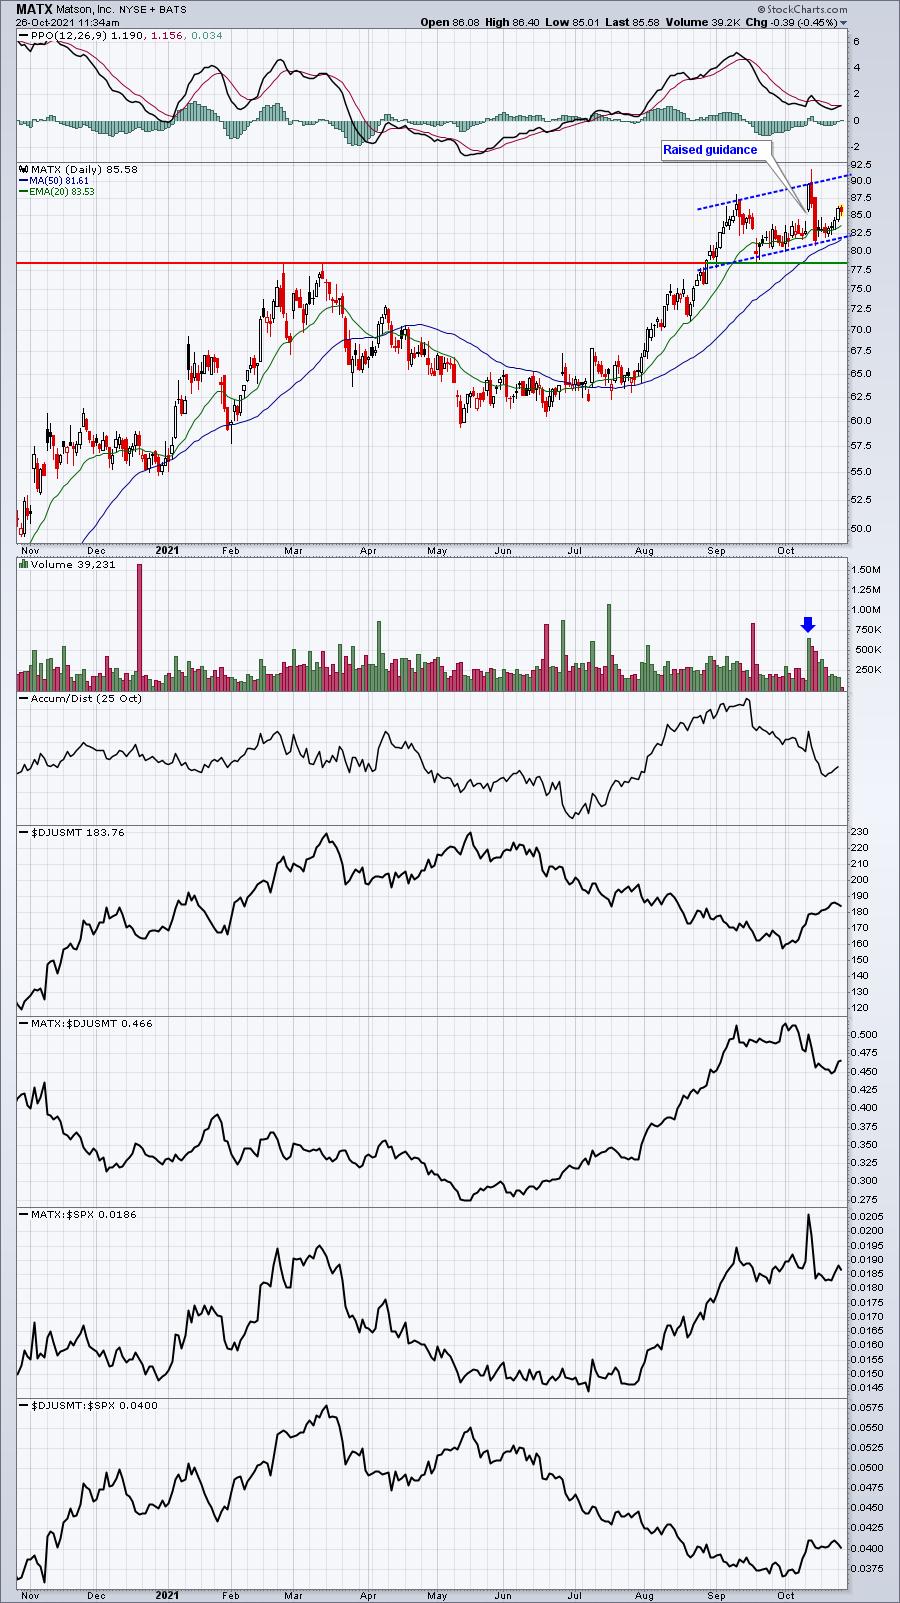
MATX soared after raising its guidance recently. It filled its gap before starting its recent trend higher. MATX reports its results on 11/3 and we very well could see the stock return to its recent high by the time earnings are released.
Finally, I want to point out one of our Short Squeeze stocks that could draw considerable buying interest among short sellers, especially if it strengthens into the close.
OCGN:
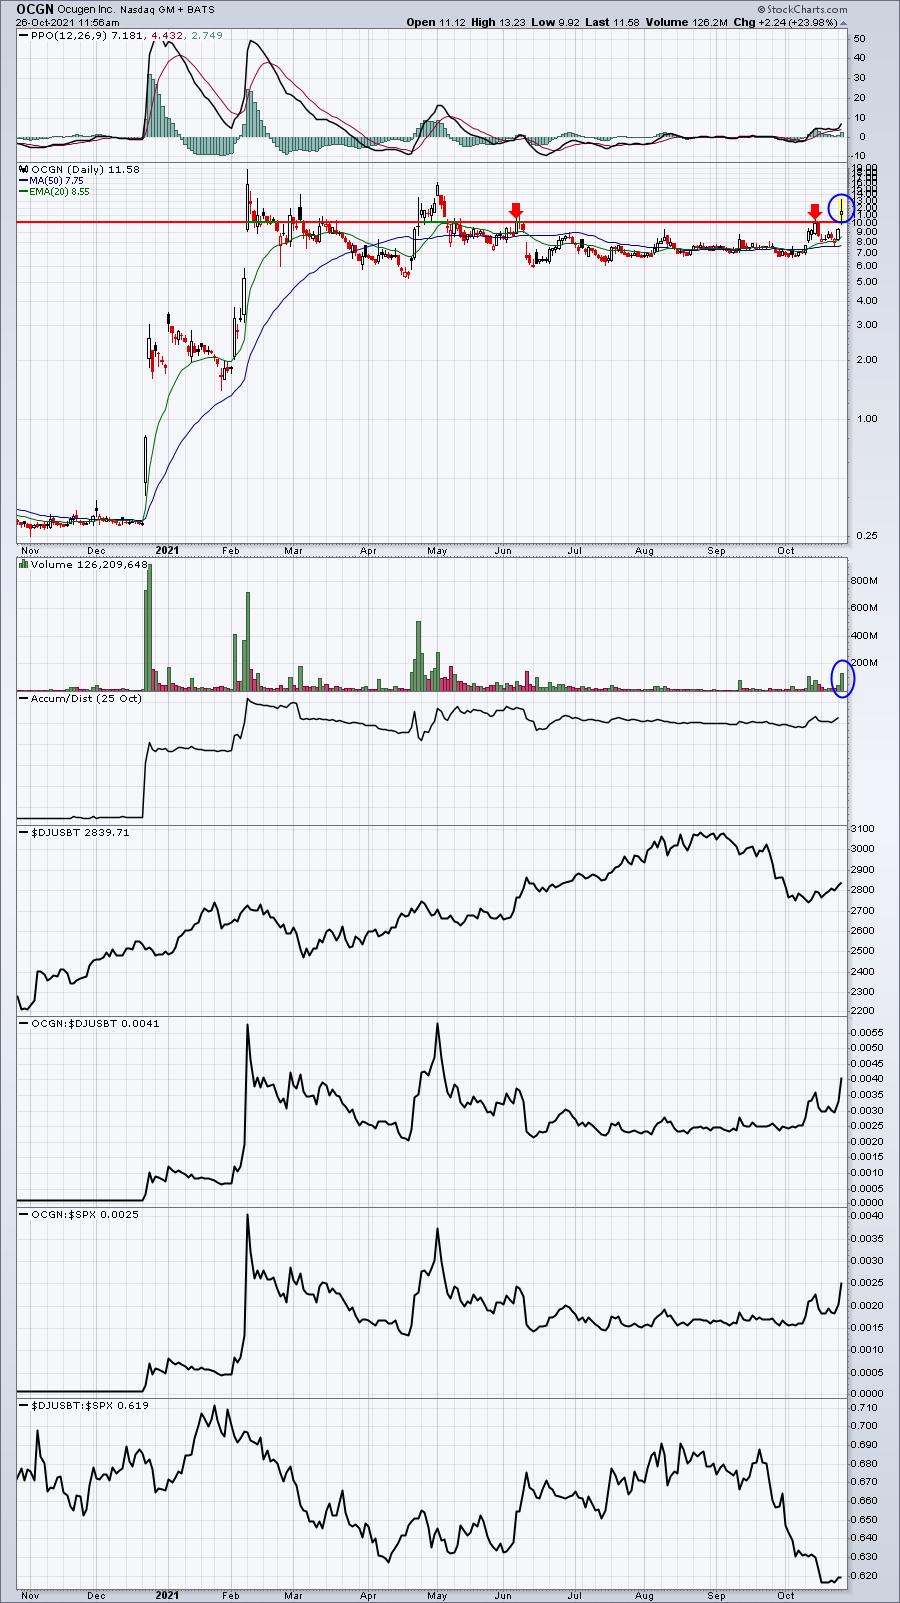
This is EXTREMELY RISKY. OCGN has a short percentage of float above 27%. A lot of traders are betting against this company and many times it's for good reason. The positive here, however, is that anyone who shorted this stock since early May is underwater right now. Given the massive increase in volume, a short squeeze could be underway. OCGN could be 15 later today or tomorrow, or it could be right back down below 10. Earnings are due out on 11/5.
Earnings Reports
Here are the key earnings reports for the next two days, featuring stocks with market caps of more than $10 billion. I also include a few select companies with market caps below $10 billion. Finally, any portfolio stocks that will be reporting results are highlighted in BOLD. If you decide to hold a stock into earnings, please understand the significant short-term risk that you are taking. Please be sure to check for earnings dates for any companies you own or are considering owning.
Tuesday, October 26:
MSFT, GOOGL, V, LLY, NVS, TXN, UPS, AMD, RTX, GE, SPGI, MMM, LMT, CB, SHW, COF, WM, ECL, UBS, MSCI, TWTR, DLR, CNC, CSGP, ADM, HOOD, AMP, GLW, EQR, PCAR, CAJ, ENPH, TRU, ESS, AGR, TER, PFG, BXP, ENTG, IEX, UDR, MASI, TECK, FBHS, CHRW, PHM, HAS, FFIV, PNR, IVZ, MANH, HUBB, QS, ARCC, JNPR, ST, PII, BYD, RRC, TENB, MTDR, JBLU, SSTK, APAM, XRX, DAN, CVLT, NAVI, NBR
Wednesday, October 27:
TMO, KO, MCD, NOW, BMY, BA, GSK, ADP, GM, CME, FISV, EW, NSC, F, BSX, TWLO, GD, EBAY, KLAC, TEL, APH, ALGN, ORLY, SPOT, KHC, XLNX, CTSH, HLT, AFL, ODFL, WCN, SU, AVB, GRMN, HES, YNDX, URI, YUMC, UMC, EXR, INVH, ARES, MAA, DTE, DT, TDOC, TYL, RJF, DRE, TDY, IP, CINF, ROL, VICI, AVY, WAB, MOH, ACGL, PPD, MAS, AEM, BMRN, NLY, BG, TEVA, RE, SCI, AZPN, PEGA, WOLF, CONE, OC, PAG, EQT, KRC, MKSI, UPWK, SLAB, HOG, CHX, MC, MXL, MTH, ALSN, MEOH, TMHC, LC, BOOT, FORM, SIMO, IRBT, SNBR, UCTT, OII, NTGR
Economic Reports
August Case-Shiller home price index: +1.4% (actual) vs. +1.3% (estimate)
August FHFA house price index: +1.0% (actual) vs. +1.3% (estimate)
September new home sales: 800,000 (actual) vs. 760,000 (estimate)
October consumer confidence: 113.8 (actual) vs. 109.0 (estimate)
Happy trading!
Tom