
EB Daily Market Report - Thursday, October 28, 2021
Executive Market Summary
- Futures were higher overnight and our major indices gapped up at the opening bell
- The 10-year treasury yield ($TNX) is up 3 basis points to 1.56%, despite mostly weak economic reports
- Commodities are mostly lower as crude oil ($WTIC) has dipped back beneath $82 per barrel
- Energy (XLE, -0.13%) is the only sector that's lower today, likely due to falling crude prices
- Consumer discretionary (XLY, +1.33%) is once again today's leading industry group, followed by materials (XLB, +1.09%)
- Automobiles ($DJUSAU, +3.21%) are leading discretionary higher as Tesla (TSLA, +3.10%) provides leadership there
- Retailers are mostly higher as the widely-diversified retail ETF (XRT, +1.77%) bounces back from two days of selling
- Renewable energy ($DWCREE, +4.20%) is strong one day after Enphase Energy (ENPH, +2.03%) posted excellent quarterly results and gained nearly 25%
Market Outlook
Consumer discretionary (XLY) continues to crush consumer staples (XLP) and that's been one of the best bullish signals this century. There are multiple ways to visualize this outperformance. First, let's use the Sector Summary at StockCharts.com. The following is the one-month performance of all sectors:
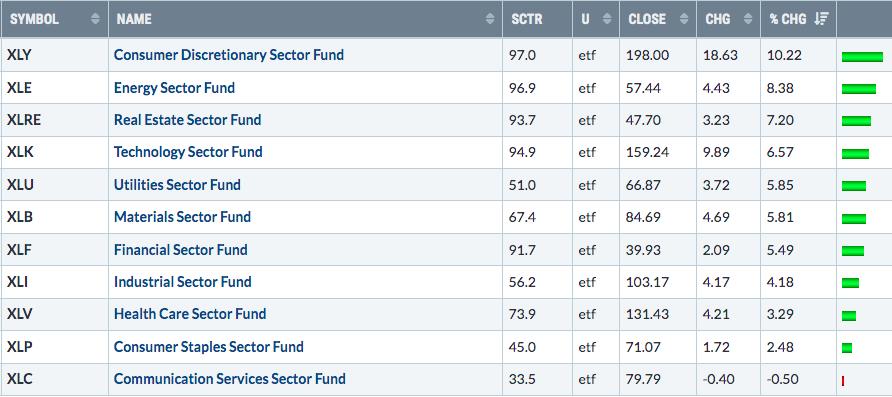
Discretionary is the best of 11 sectors, while staples are 10th. Then there's the price relative chart that I like to use. On this chart, you can see that the XLY has been significantly outperforming the XLP and this ratio is at an all-time high. Check out the positive correlation in the panel below the relative price action:
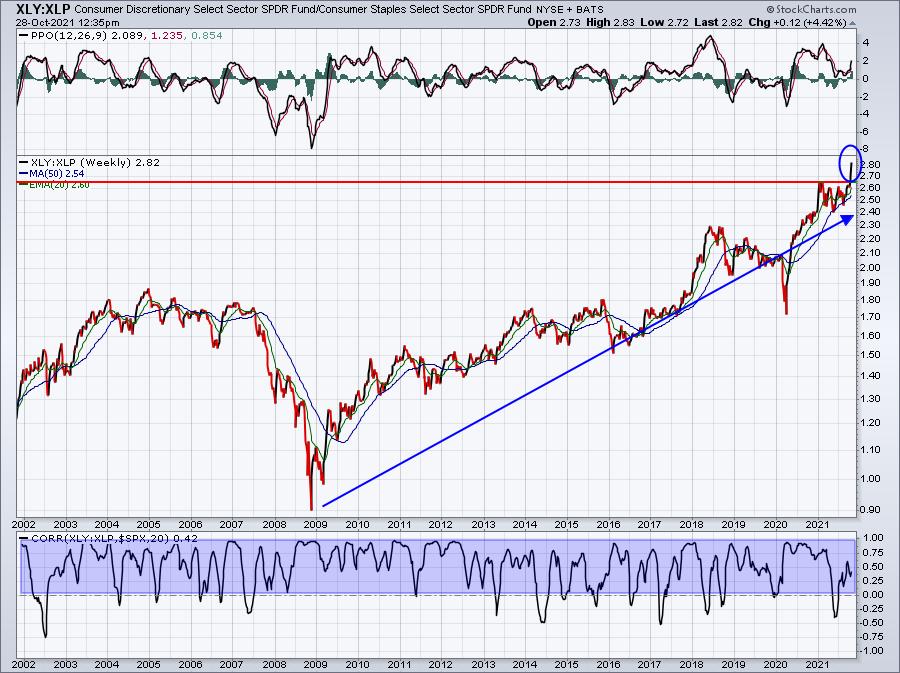
The blue-shaded area highlights the positive correlation between the direction of the XLY:XLP ratio and the direction of the S&P 500. I think it's pretty clear. When the XLY:XLP is rising, you want to be long U.S. equities.
Finally, one last way to visualize the relative performance of these two sectors is by using an RRG chart:
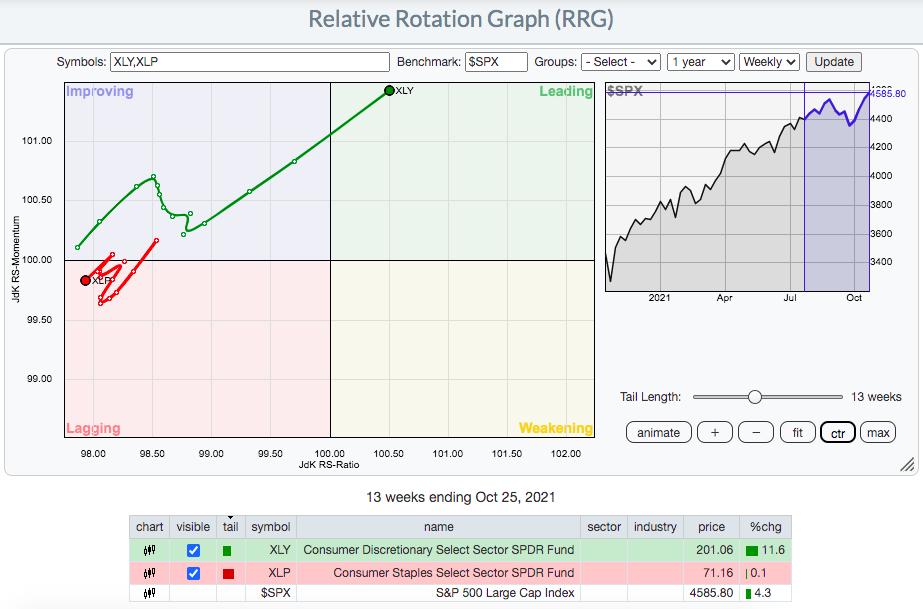
The "tail" is 13 weeks long. You can see that 13 weeks ago, these two sectors were both in the "improving" quadrant. That's where their 13-week journey began. Since that time, could these two sectors be moving any more diametrically opposed?
Sector/Industry Focus
Renewable energy ($DWCREE) and automobiles ($DJUSAU) led the huge market rally in 2020 off the pandemic low. Autos have been leading the latest rally and renewable energy is about to join the party:
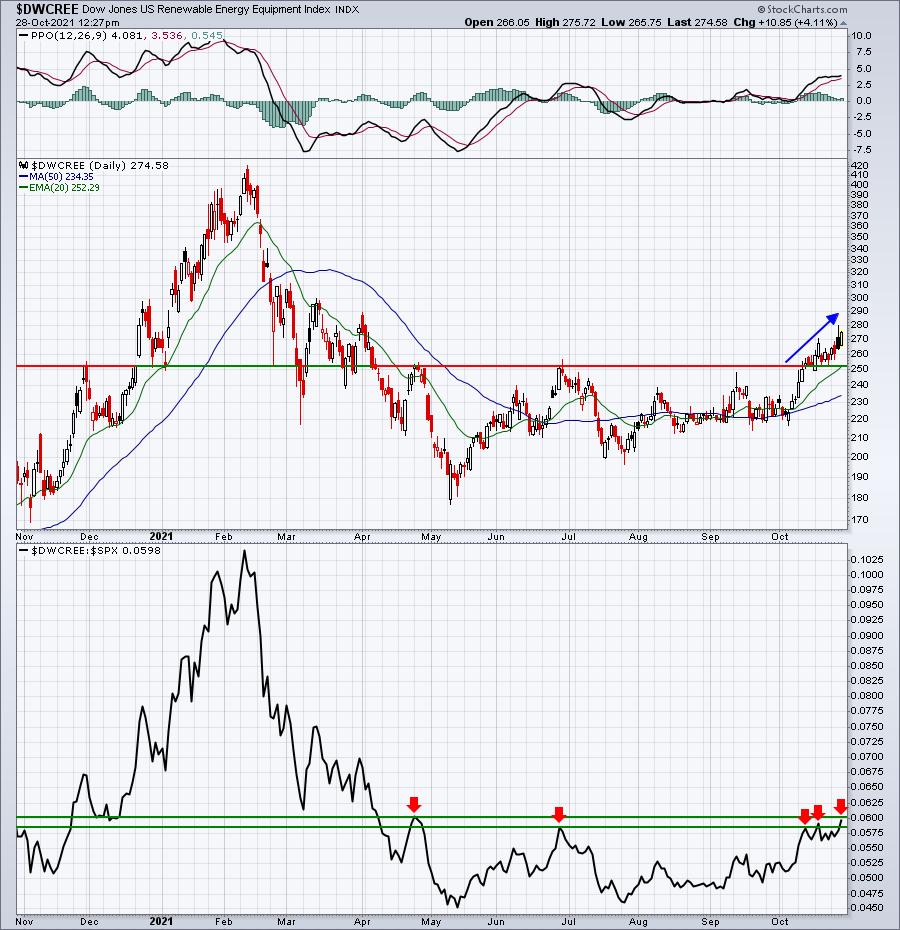
The absolute breakout has already been made. Now we just need to see the relative breakout to a 6-7 month high. I believe it's coming based on how component stocks are reacting to strong earnings results.
ChartLists/Strategies
Market makers prey on the emotions of traders. They can accumulate shares when traders are panicked and they can distribute shares when traders are greedy. It's the reason that candlestick analysis is so important to a short-term trader. I honestly would struggle without candlesticks, because I view them as BUY and SELL signals. For instance, check out the false breakout on Twitter (TWTR) just a few days before its earnings:
TWTR:
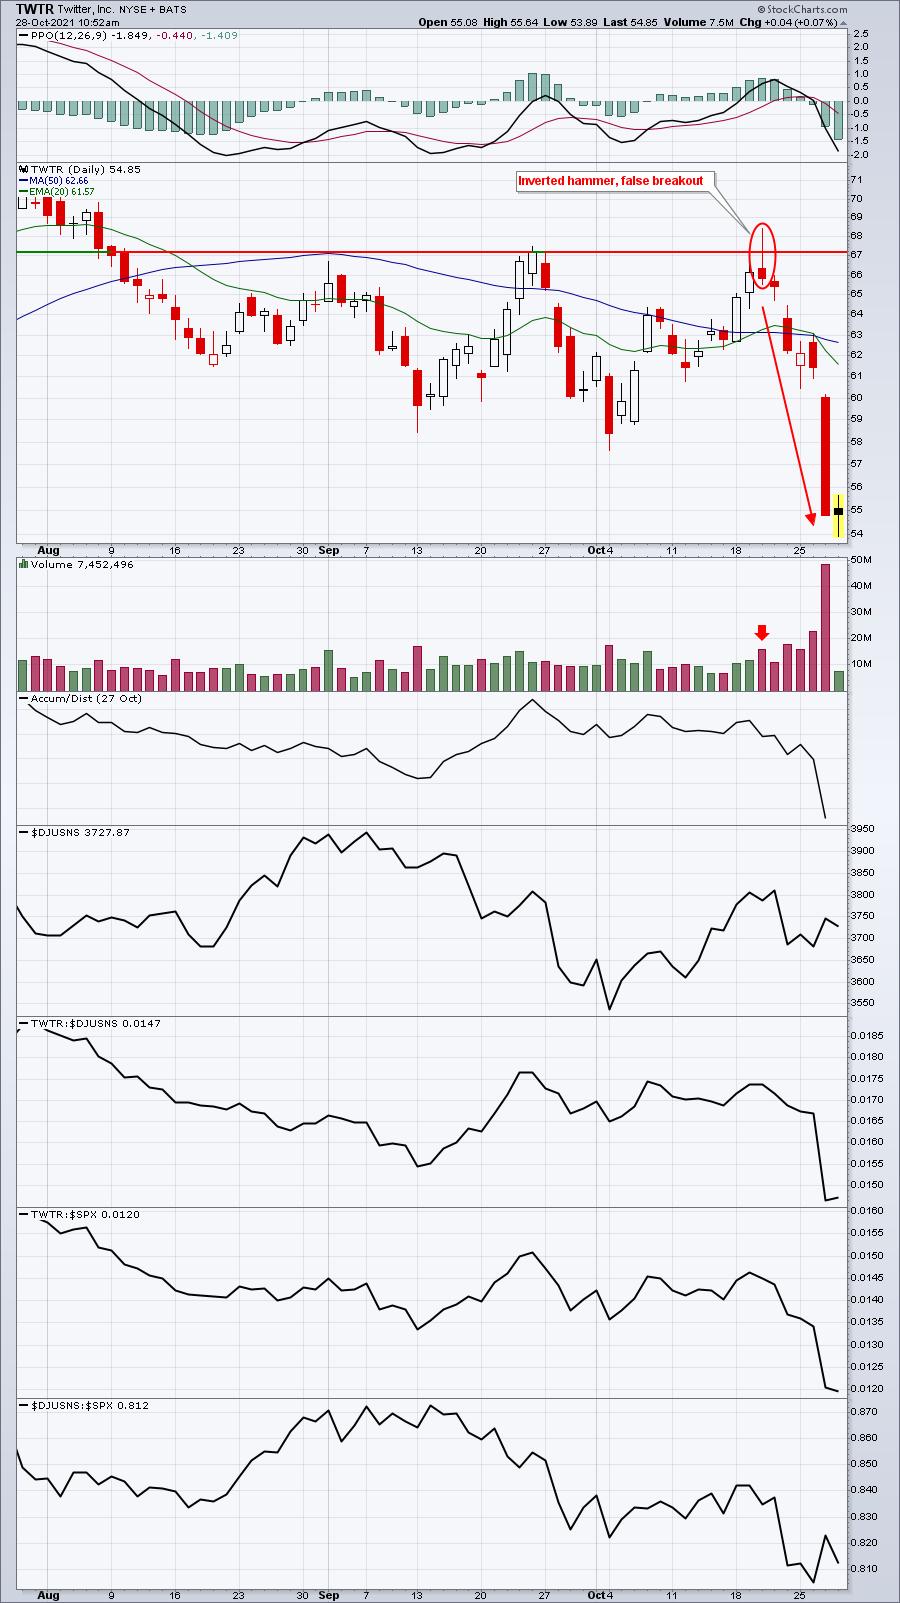
If a market maker is trying to sell shares for an institution, doing so into the teeth of an increasing volume breakout is PERFECT. I'm always very skeptical of false breakouts. Two days ago, I wrote a Don't Ignore This Chart blog article about 30-45 minutes into the trading day and pointed out that CrowdStrike Holdings (CRWD) was breaking out, but I questioned whether it was a true breakout or if it was a false breakout. We simply don't know until the closing bell. Check out the link provide above and look at that CRWD chart. It certainly looked like a breakout, right? Well, here's a current look at the chart:
CRWD:
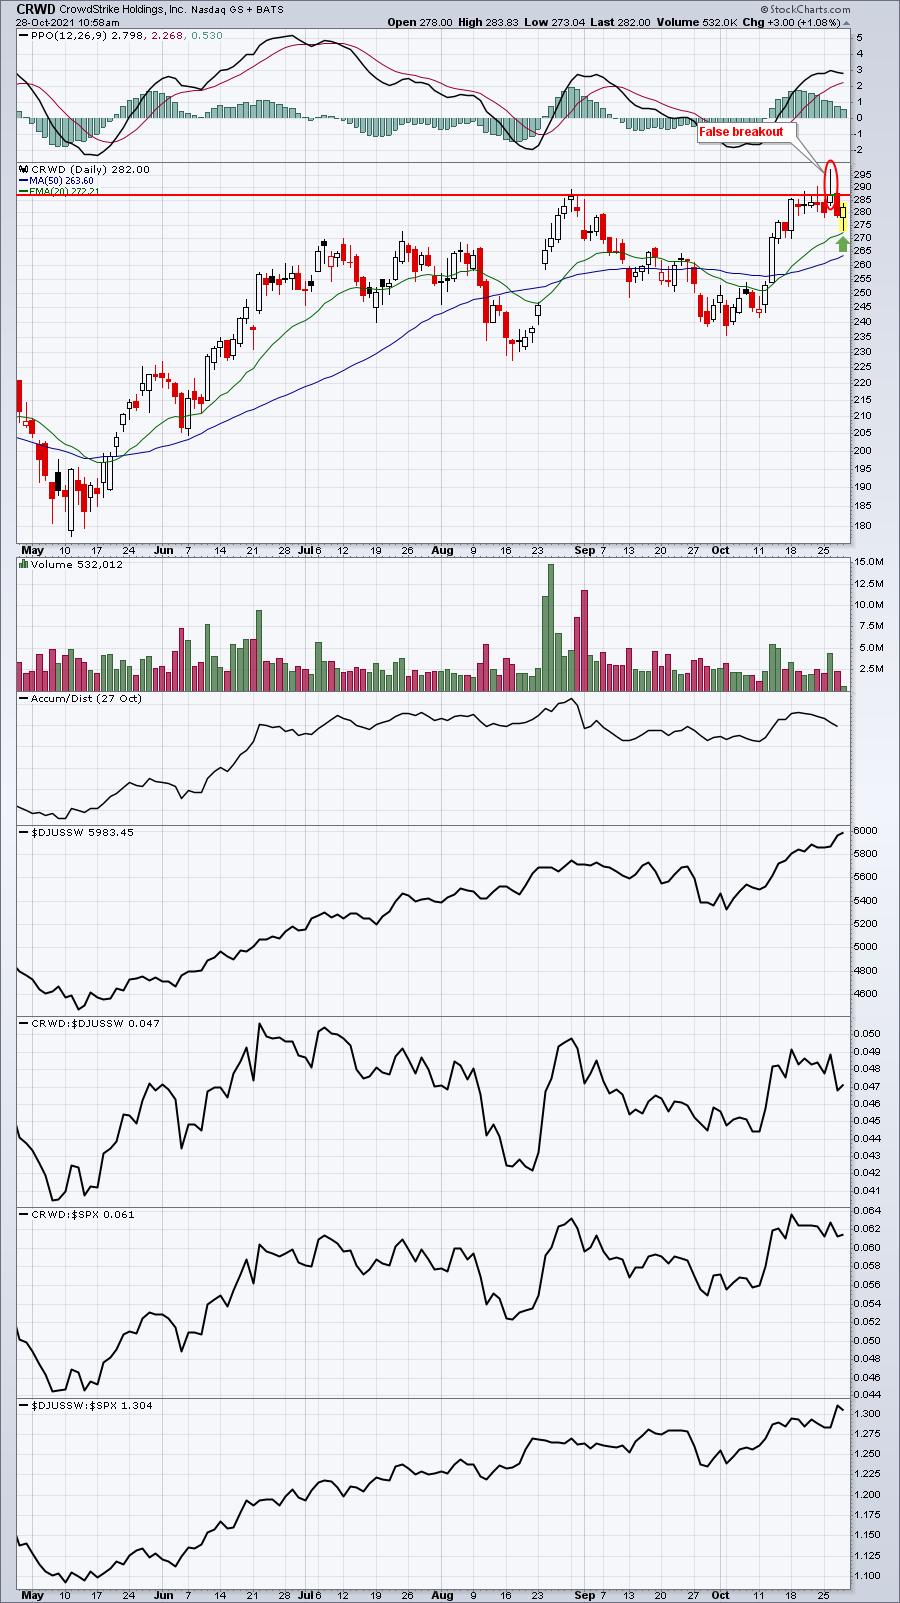
Market makers not only sell on behalf of their clients, but they also trade for their own benefit. So when a stock fails to breakout, we really don't know whether it's failed breakout that could last for a long, long time, or whether it's simply a short-term failure. In the case of CRWD, I believe we'll soon see that breakout. I look at it as a failed short-term breakout. I like the fact that after pulling back to its rising 20-day EMA, it's bouncing. That provides me the confidence that it's just a matter of time before we see a breakout that sticks.
Let me show you another example. Cleveland-Cliffs, Inc. (CLF) appeared to be breaking out on Tuesday, but it's fallen back a couple bucks after failing to CLOSE in breakout territory. Check this one out:
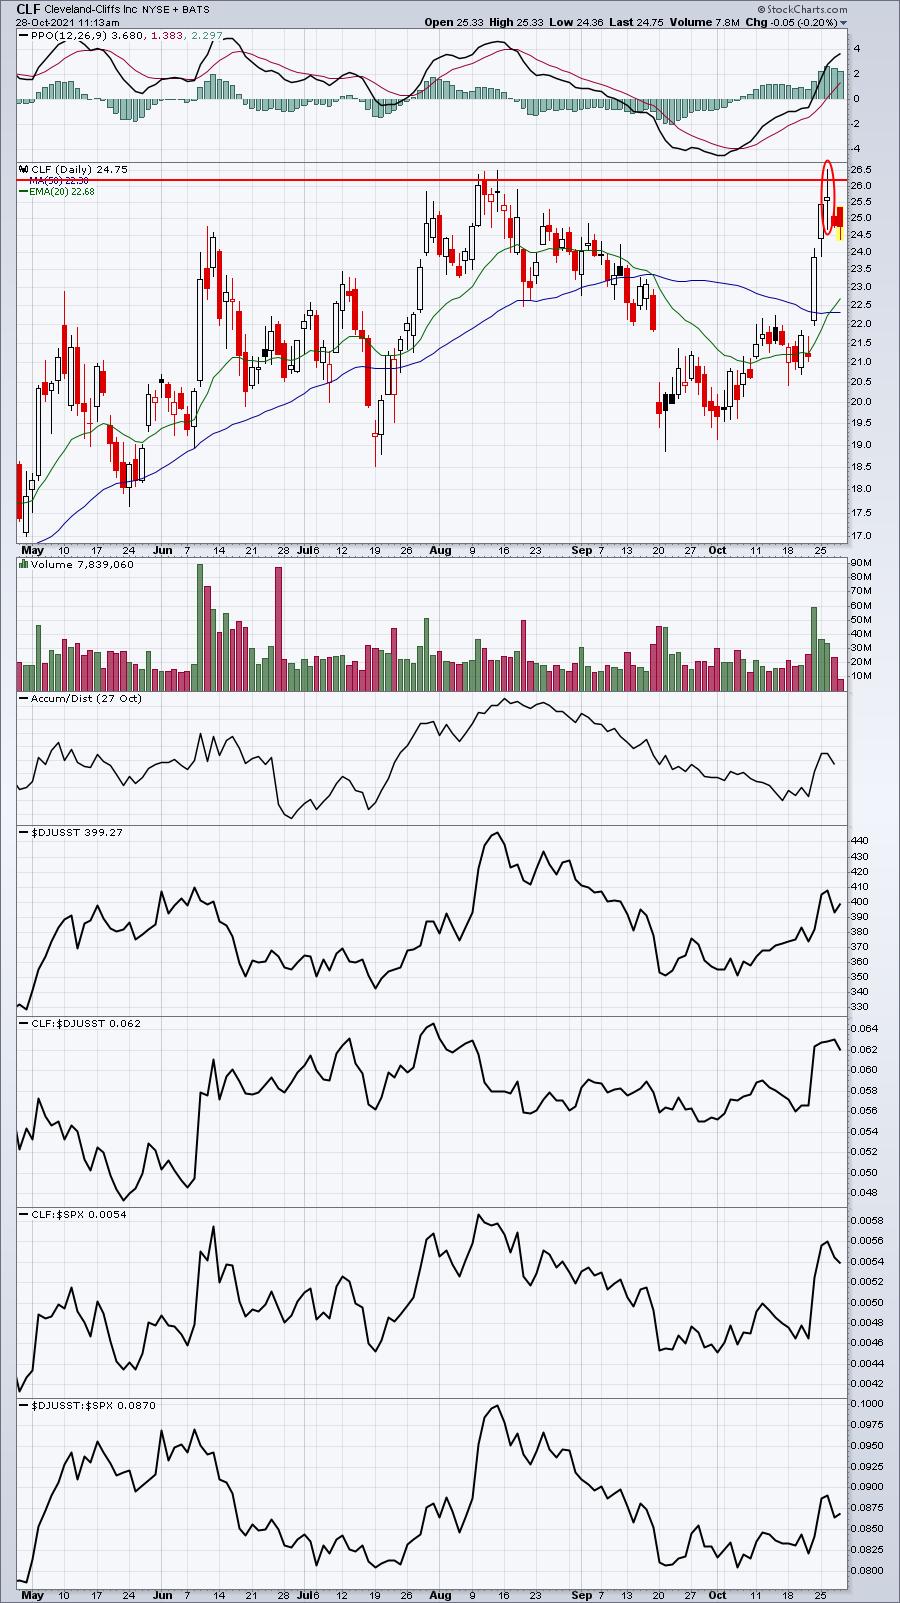
Again, what we're banking on here are odds. When a stock fails to hold a breakout, the first thing I think is that market makers have shorted. Retail traders are going to buy a breakout, not sell it. So any failure is very likely due to positions taken by market makers. While this may not matter to long-term investors, it's extremely important to traders as opportunity costs arise after a failed breakout. When a trader holds a failed breakout and waits for the actual breakout, capital is invested in a non-performing trade. That capital could be used elsewhere.
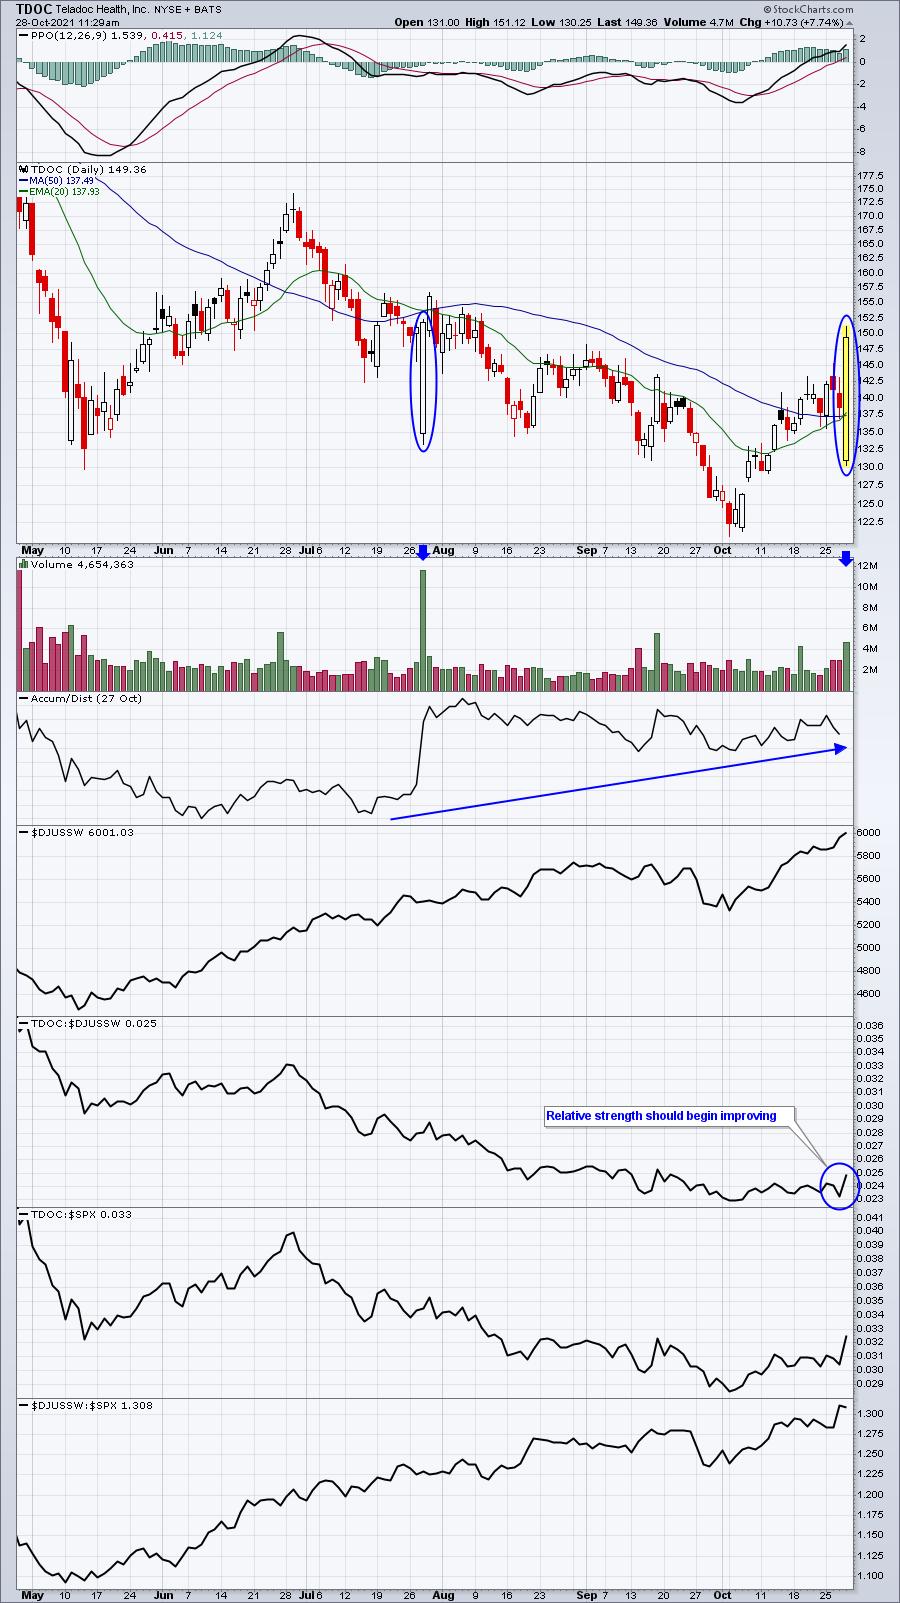
One last chart. I love what's been happening with Teledoc Health (TDOC). The accumulation today after earnings plus last quarter after earnings tells me that the sellers are gone. Every selloff now turns into a buying opportunity. I expect to see much higher prices on this stock over the next quarter:
TDOC:
Earnings Reports
Here are the key earnings reports for the next two days, featuring stocks with market caps of more than $10 billion. I also include a few select companies with market caps below $10 billion. Finally, any portfolio stocks that will be reporting results are highlighted in BOLD. If you decide to hold a stock into earnings, please understand the significant short-term risk that you are taking. Please be sure to check for earnings dates for any companies you own or are considering owning.
Thursday, October 28:
AAPL, AMZN, MA, CMCSA, MRK, RDS/A, SHOP, LIN, SONY, SBUX, AMT, SNY, CAT, SYK, MO, GILD, ICE, MCO, ITW, NOC, TEAM, DXCM, KDP, CARR, NEM, AEP, RSG, BAX, STM, RMD, YUM, HSY, CBRE, XEL, AJG, SGEN, NOK, WLTW, WST, SWK, FMX, LH, FTV, HIG, HBAN, VRSN, SIRI, MPWR, ALNY, BIO, AVTR, FE, TW, CG, SSNC, WDC, TFX, CMS, CHKP, TXT, LKQ, ABMD, CPT, ZEN, RGEN, EMN, ARGX, CLVT, LPLA, MHK, NVCR, MPW, DVA, GLPI, TFII, DECK, AOS, AGCO, RS, TAP, TPX, OSK, MSTR, SKX, HLI, NLSN, X, COLM, TXRH, POWI, ACHC, AUY, PRFT, FTDR, OSTK, TEX, WERN, SWI, TREE, FLWS, EB, VCRA, ATEN
Friday, October 29:
XOM, CVX, ABBI, CHTR, AON, PBR, CL, LHX, PSX, LYB, WY, IMO, GWW, RCL, CERN, FTS, CHD, WPC, CBOE, SJR, BAH, CCJ, NWL, HUN, LAZ, CRI, COWN
Economic Reports
Q3 GDP (initial estimate): 2.0% (actual) vs. 2.7% (estimate)
Initial jobless claims: 281,000 (actual) vs. 290,000 (estimate)
September pending home sales: -2.3% (actual) vs. +1.7% (estimate)
Happy trading!
Tom