
EB Daily Market Report - Monday, November 1, 2021
ChartList Updated
I have updated our Strong AD ChartList (SADCL), but still need to complete the Raised Guidance ChartList (RGCL). I hope to have this one completed by tomorrow, along with both the November Seasonality and Short Reports.
Executive Market Summary
- Futures were weak overnight after two major NASDAQ names saw poor reactions to their quarterly results
- Amazon.com (AMZN, -3.01%) missed its revenue and EPS estimates and lowered guidance, citing supply chain issues
- Apple, Inc. (AAPL, -2.30%) missed its revenue estimate, and simply matched its EPS consensus estimate
- After early selling, treasuries saw buying throughout the day and the 10-year treasury yield ($TNX) dropped a basis point to 1.56%
- Health care (XLV, +0.73%) showed leadership today, while real estate (XLRE, -1.14%) was the primary laggard, though it had competition
- 8 of the 11 sectors lost ground as of the time of this writing
- Technology (XLK, +0.12%) is the second best sector today, surprising given that AAPL's earnings didn't impress; however, both renewable energy ($DWCREE, +1.95%) and software ($DJUSSW, +1.16%) are higher
Market Outlook
As I mentioned on my Trading Places LIVE show this morning, I believe the S&P 500 Mid Cap Index ($MID) has broken out and is now trending higher. If you agree, one way to trade it is to simply buy the ETF that tracks this index, or MDY. Here's the chart of $MID:
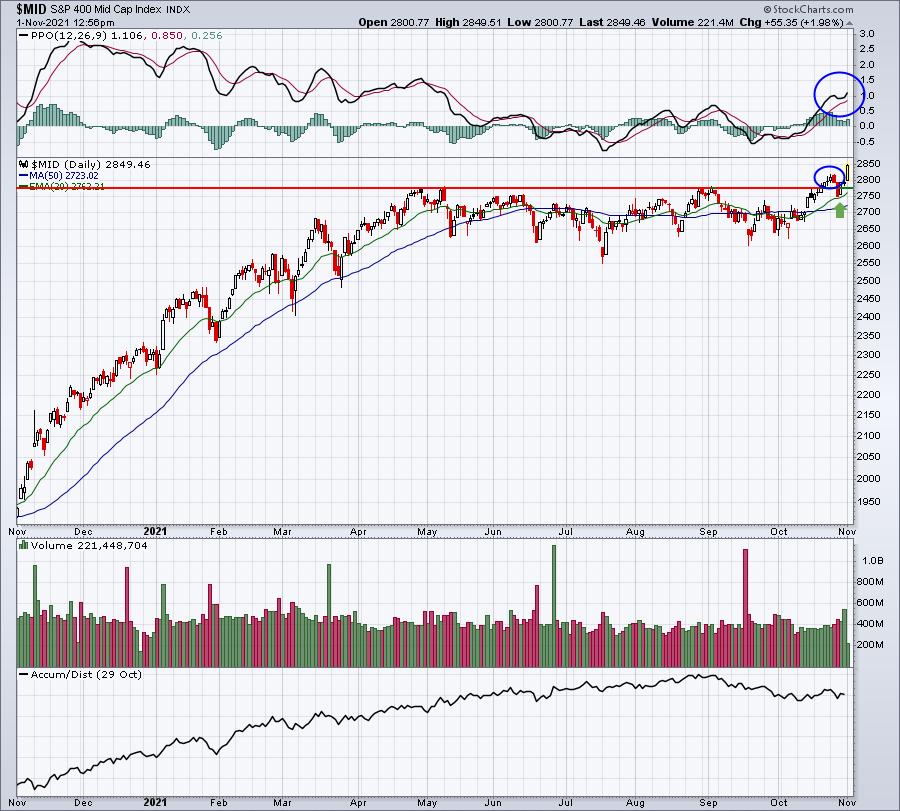
Another strong day today is helping to confirm that we're in a new uptrend phase. I like the MDY as a core holding right now.
Sector/Industry Focus
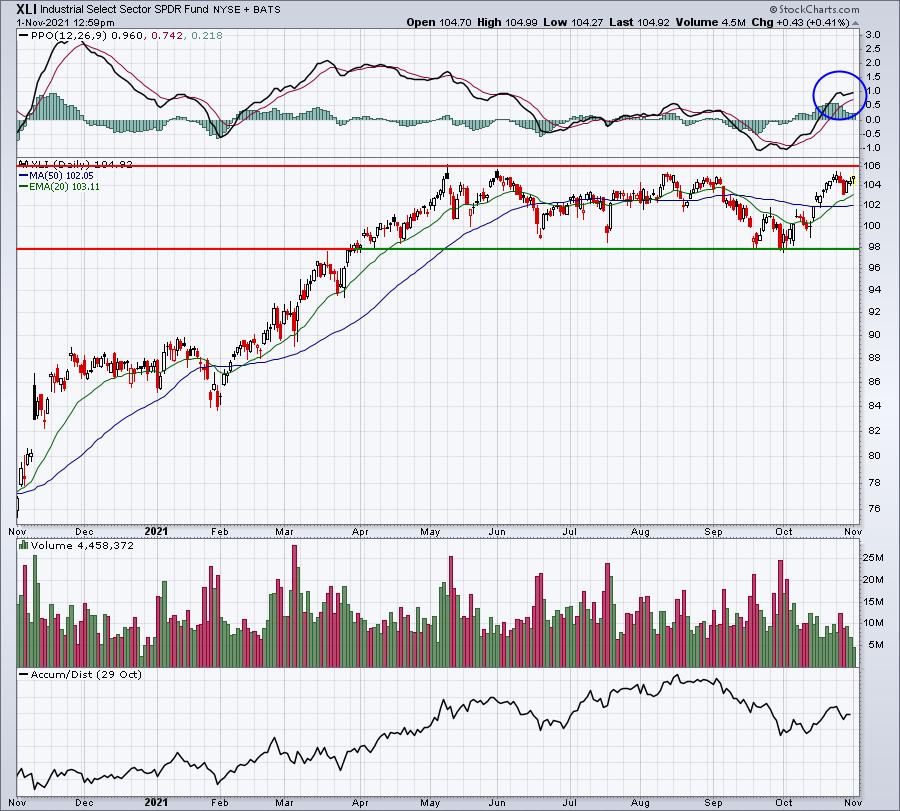
Watch industrials (XLI). This sector LOVES November and it's on the verge of a very significant breakout above 105.50-106.00, a level that it has struggled to negotiate. Given it's seasonal success in November, I'd be very bullish a breakout here. Also, on the chart below, note that the XLI is beginning to trend above its rising 20-day EMA, which also crossed its 50-day SMA recently. The configuration of price and moving averages support an uptrend. We simply need to see the breakout:
ChartLists/Strategies
U.S. equities, overall, have been quite strong, but the Short Squeeze ChartList (SSCL) is beginning to receive a lot more love as I mentioned on Friday. These stocks can move very quickly and are extremely risky. Please keep this in mind before deciding (1) whether to trade any of them and (2) what position size you're willing to take. Of the 9 that I listed on Friday, 3 of those 9 have found their way into the top 5 Short Squeeze ChartList performers today. Here they are:
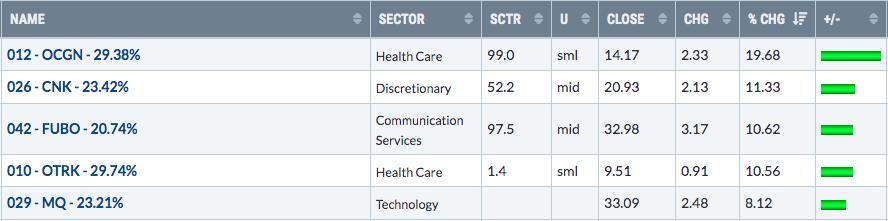
The volume on the three mentioned - OCGN, FUBO, and MQ - is expanding. Here's a quick look at the 3 charts:
OCGN:
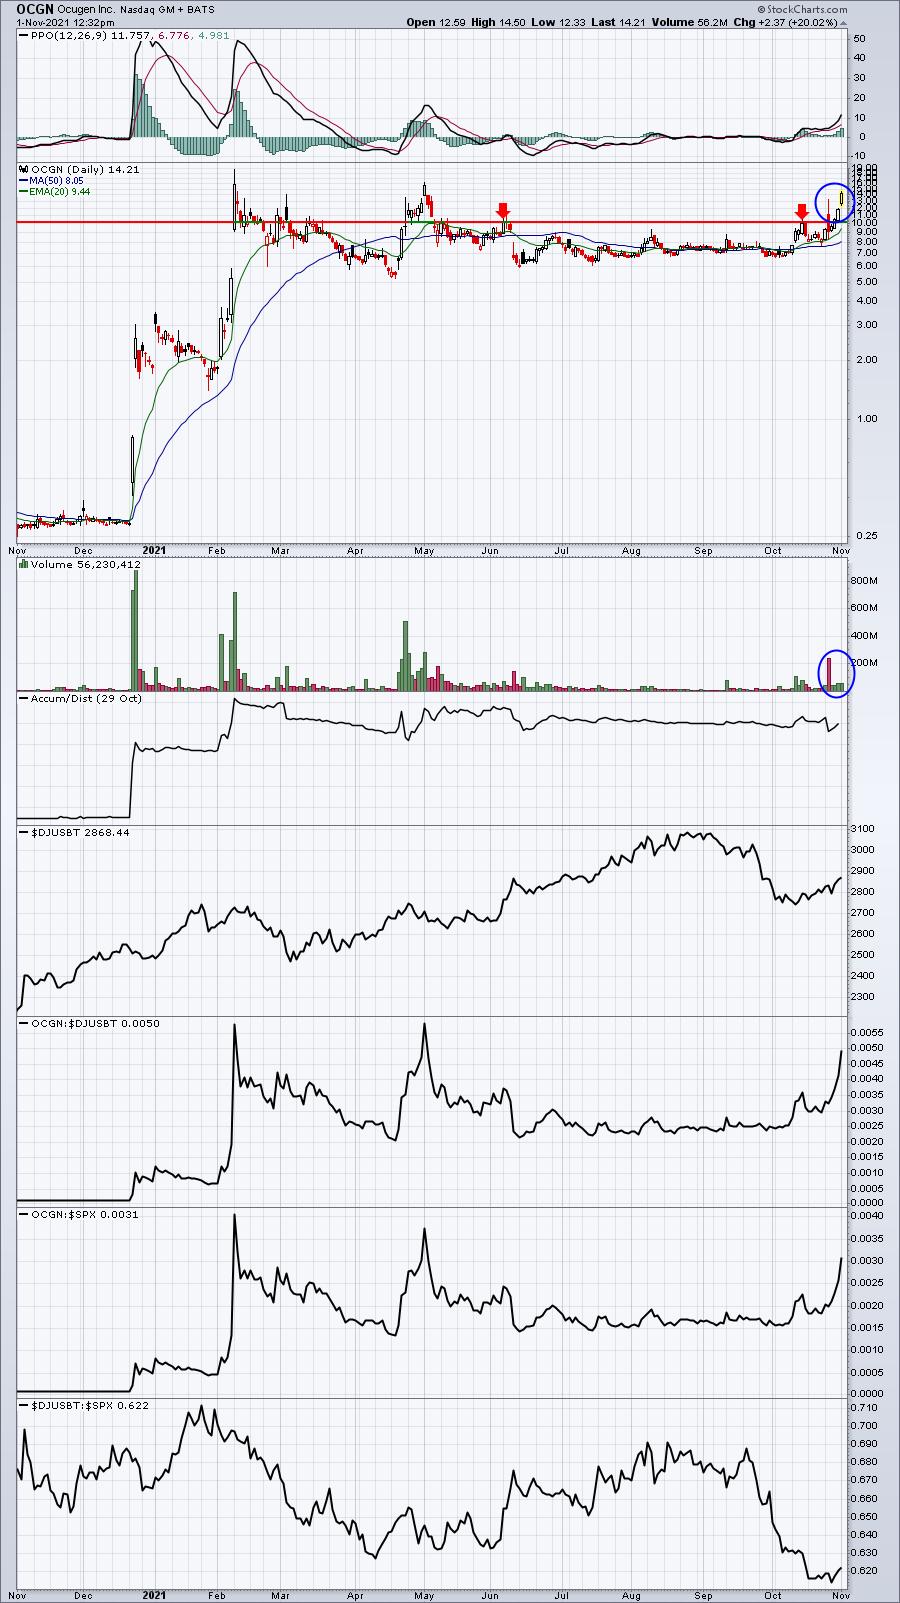
When I first mentioned OCGN last week, I indicated that it could quickly move to 15 or be back below 10. I didn't realize both might happen within a week!
FUBO:
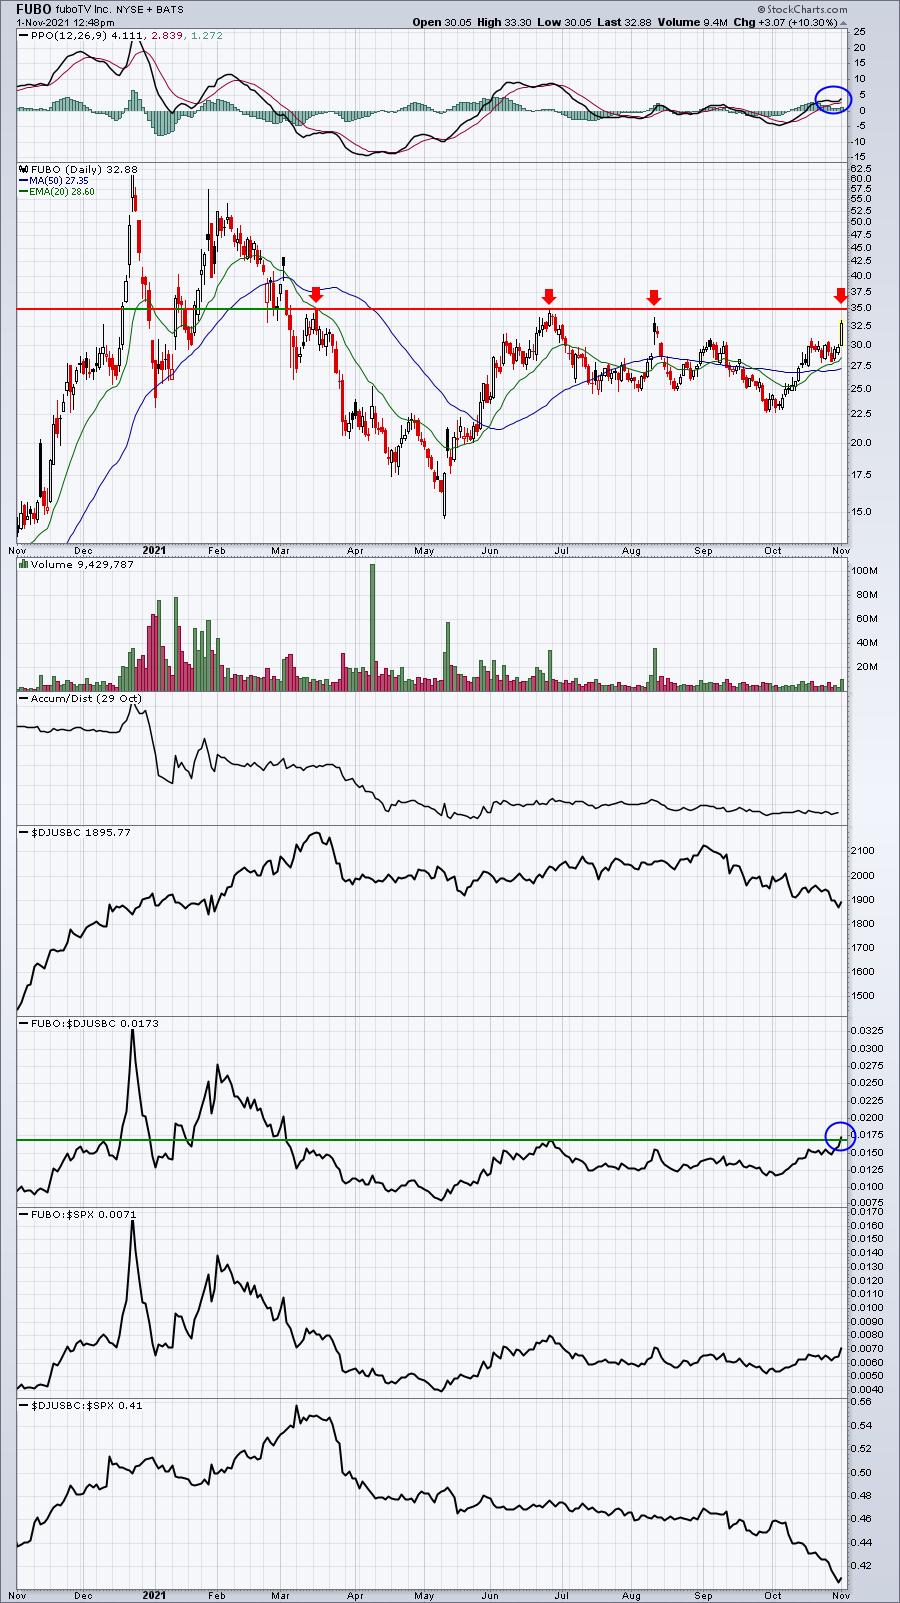
Momentum is building here, but a breakout above 35 would likely put most short sellers in an underwater position, increasing the odds of a significant short squeeze. Volume is building.
MQ:
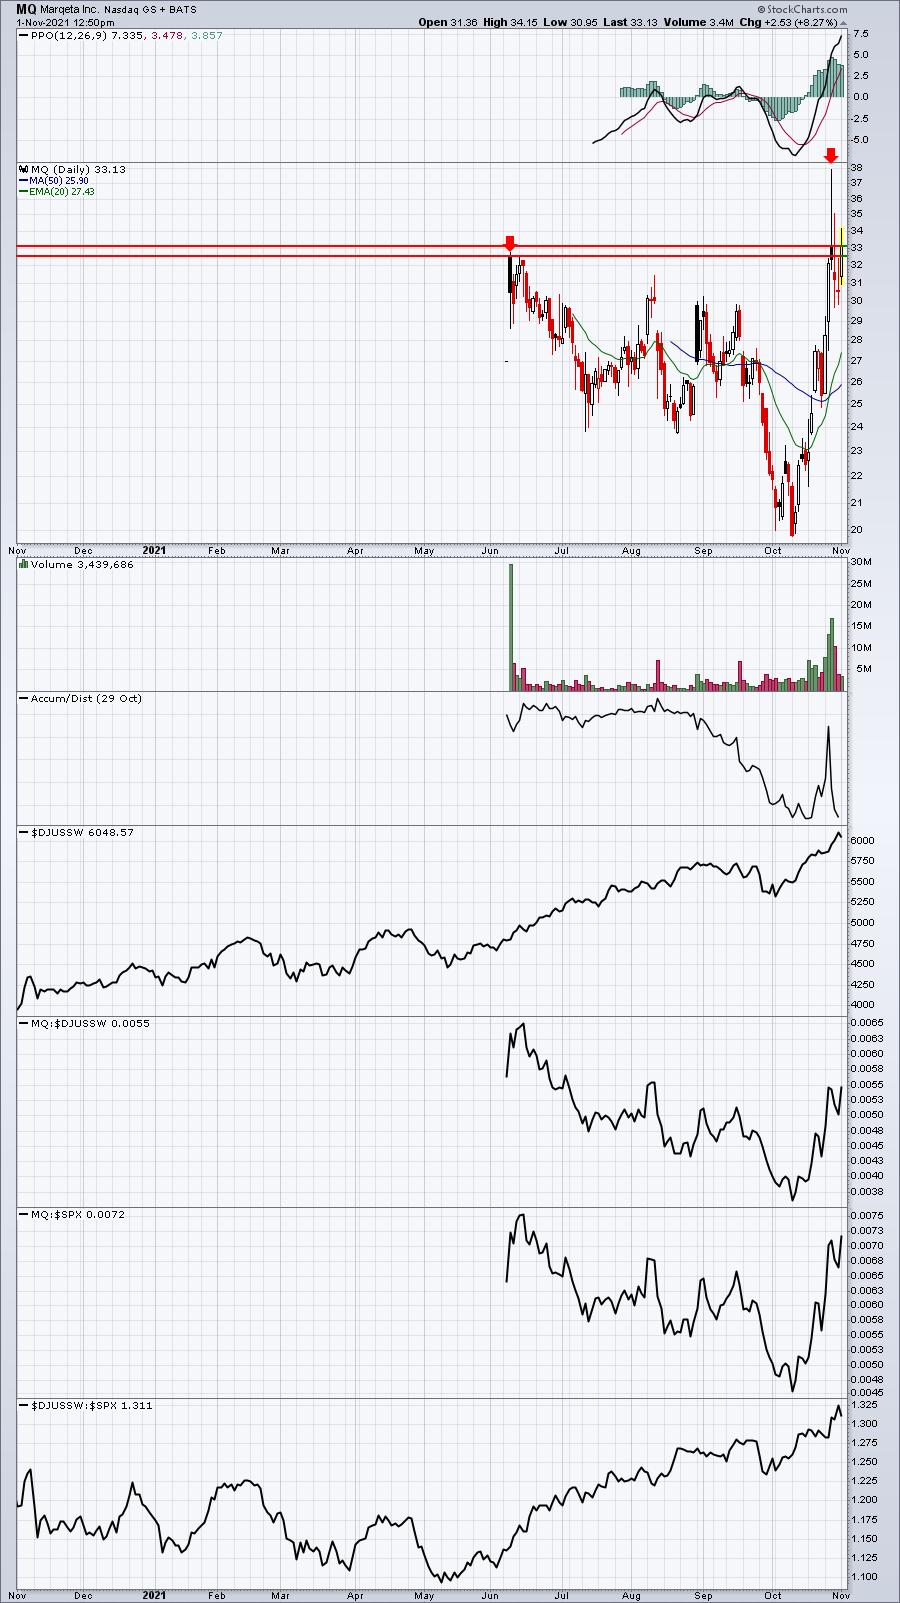
MQ is in the hot software space and it's threatening a breakout. Knowing that there's a 23% short percentage of float adds to the likelihood of buying pressure on a breakout. The volume pace could result in today being a top 5 volume day for MQ since going public.
Earnings Reports
Here are the key earnings reports for the next two days, featuring stocks with market caps of more than $10 billion. I also include a few select companies with market caps below $10 billion. Finally, any portfolio stocks that will be reporting results are highlighted in BOLD. If you decide to hold a stock into earnings, please understand the significant short-term risk that you are taking. Please be sure to check for earnings dates for any companies you own or are considering owning.
Monday, November 1:
PSA, NXPI, SPG, NTR, SBAC, WMB, MCK, ANET, O, PCG, ZI, CLX, FANG, ON, HOLX, MOS, BEN, CNA, BRKR, WTRG, CAR, NBIX, CHGG, VNO, VRNS, AMG, LEG, NSP, CRUS, FN, KMT, RMBS, RIG, SKT, HLIT
Tuesday, November 2:
PFE, TMUS, AMGN, EL, COP, BP, MDLZ, ETN, ATVI, TRI, IDXX, EPD, VRTX, KKR, PRU, RACE, MTCH, MPC, GPN, ROK, DD, CMI, VRSK, PEG, PAYC, AWK, GNRC, MPLX, AME, ES, OKE, WEC, ZBRA, DVN, IT, ZG, MLM, EIX, CZR, XYL, STE, CTLT, WAT, TECH, PKI, PEAK, AMCR, APO, SEDG, MKL, AKAM, EXAS, LYFT, IEP, INCY, LDOS, FNF, FRSH, WLK, FMC, AFG, MMP, LSI, HSIC, UAA, LEA, DOX, XPO, BHC, LSCC, RL, SEE, IPGP, APPS, WU, SPT, CHK, SRCL, UNM, HLF, MIME, COUR, AYX, LPSN, LGIH, RAMP, SGRY, ARNC, CDLX, EGHT, MYGN, BLMN, KAR, EXTR, ICHR, TVTY, VECO, CERS, DENN
Economic Reports
October PMI manufacturing: 58.4 (actual) vs. 59.2 (estimate)
October ISM manufacturing: 60.8 (actual) vs. 60.3 (estimate)
September construction spending: -0.5% (actual) vs. +0.5% (estimate)
Happy trading!
Tom