
EB Daily Market Report - Friday, November 5, 2021
Executive Market Summary
- Futures were strong as we opened this morning, buoyed by a solid October nonfarm payrolls number
- Jobs totaled 531,000 vs. 450,000 and unemployment ticked down another point to 4.6% from 4.7%
- Among cryptocurrencies, etherium ($ETHUSD, +0.60%) is up today, while bitcoin ($BTCUSD, -0.08%) is slightly lower, adding to etherium's recent relative strength
- Gold ($GOLD, +1.37%) jumps to its highest absolute value in two months, but it remains a serious relative laggard vs. the S&P 500
- Crude oil ($WTIC) is jumping 3% today after closing yesterday below $80 per barrel for the first time in nearly a month
- Energy (XLE, +1.65%) is riding the crude oil wave higher today; an early reversal in the dollar (UUP) to the downside is no doubt helping
- Health care (XLV, -1.30%) is the only sector that's in negative territory as Moderna's (MRNA) 20% plunge after earnings is weighing on the space
- Yesterday was the single biggest day in terms of earnings reports released and one beneficiary from earnings results is Expedia (EXPE, +14.92%)
- Industrials (XLI, +1.10%), while not today's leader, is breaking out to a new all-time high after consolidating since May
Market Outlook
Welcome the latest addition to the ALL-TIME HIGH party - the industrials (XLI) sector. We've been anxiously awaiting a breakout of the XLI after months and months of consolidation. Well, it appears that it's arrived with the group's first-ever close above 106 likely - barring a final hour selloff:
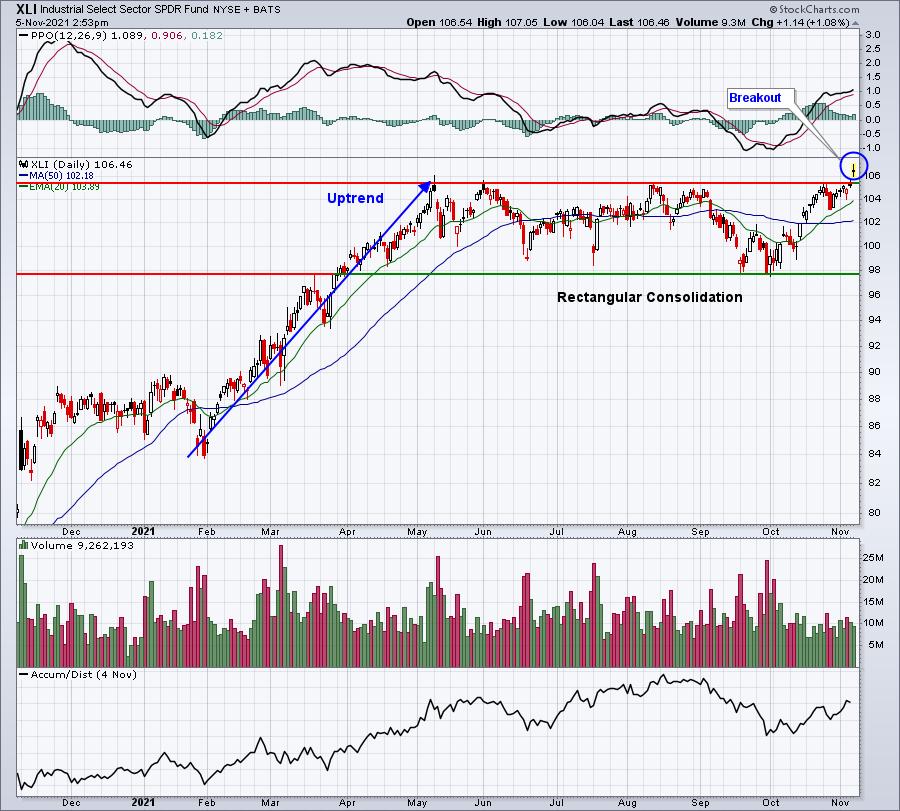
Rectangular consolidation represents a continuation pattern that executes upon a breakout. I'm looking for further gains ahead and don't be surprised if the XLI becomes a relative leader among sectors. It had reached a relative support level on the weekly PPO, as reflected below:
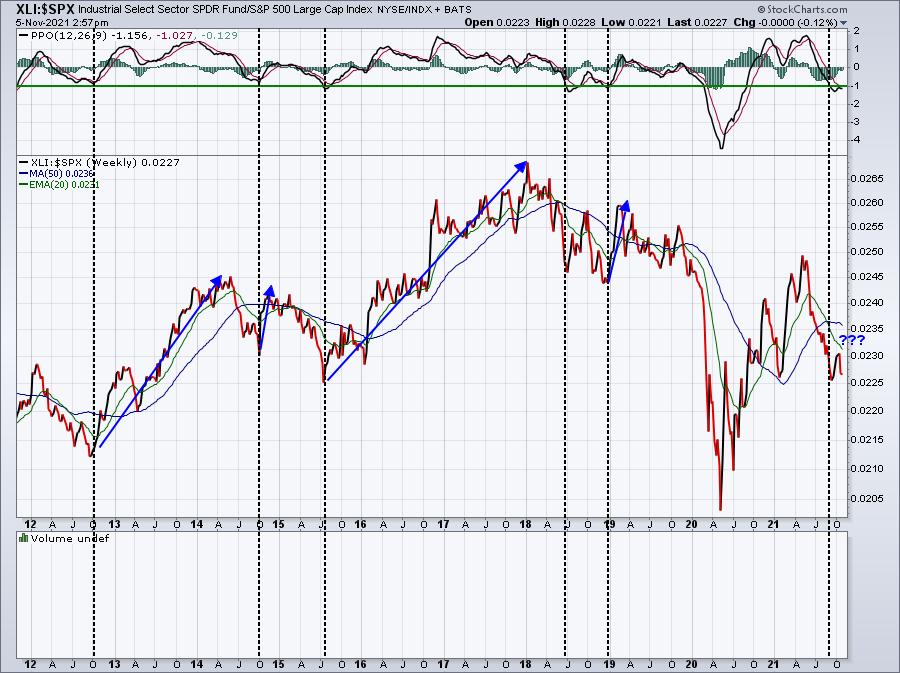
We have no guarantees, but odds suggest we're about to enjoy a period of relative outperformance by the XLI. I pointed out this same type of relative PPO support on the XLY recently and we've seen tremendous relative strength in that sector ever since. Let's see if the XLI does the same.
Sector/Industry Focus
Small caps broke out this week and now we have industrials breaking out. On the chart below, you'll see that the small cap industrials ETF (PSCI) is breaking out vs. its large cap industrials ETF counterpart (XLI):
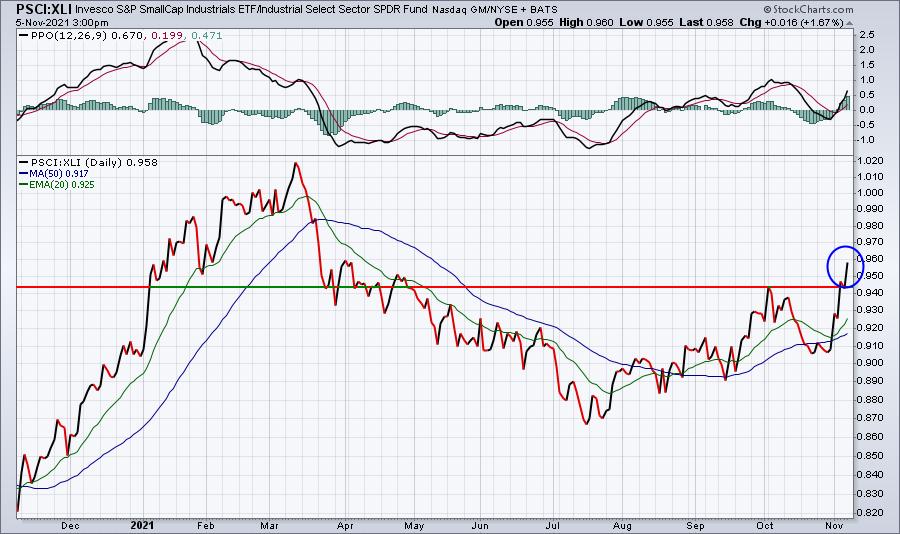
While the XLI might represent a solid investment for the balance of 2021, perhaps the small cap industrials alternative (PSCI) could represent an even better investment. More on the components of this ETF below.
ChartLists/Strategies
Let's look at the components (Top 10 holdings) of that small cap industrials ETF, first by placing them all on a RRG chart with XLI being the benchmark:
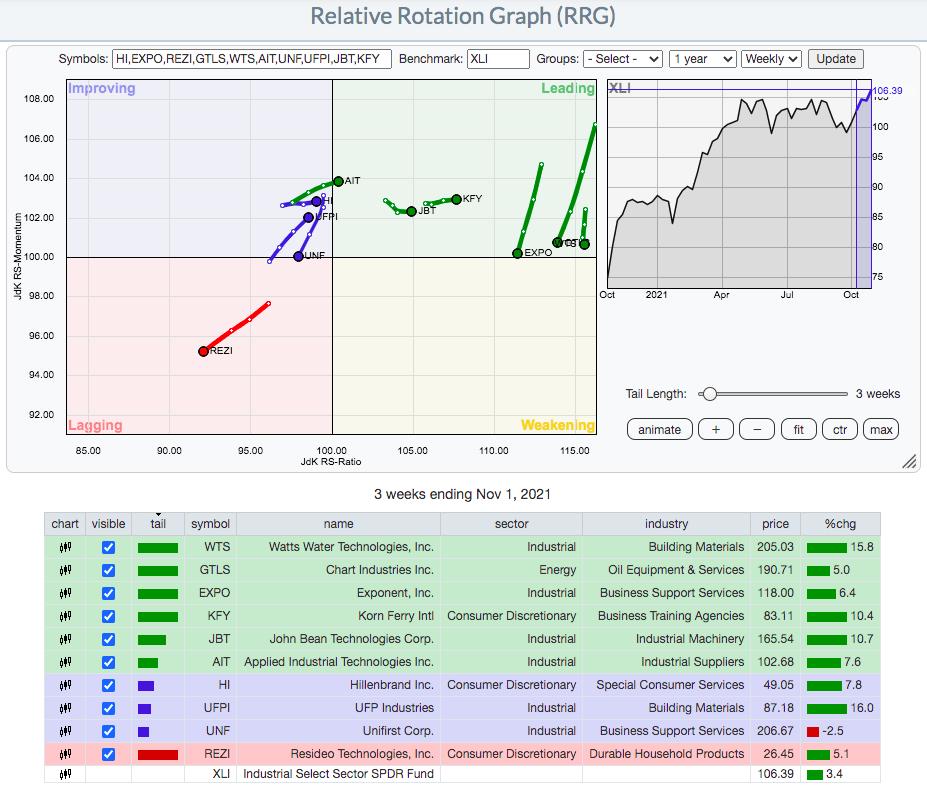
REZI is weakening in the lagging quadrant. UNF is rotating back from improving to lagging, a bearish development. Meanwhile, the three stocks that are furthest to the right are WTS, GTLS, and EXPO. Here are the price charts for those 3:
WTS:
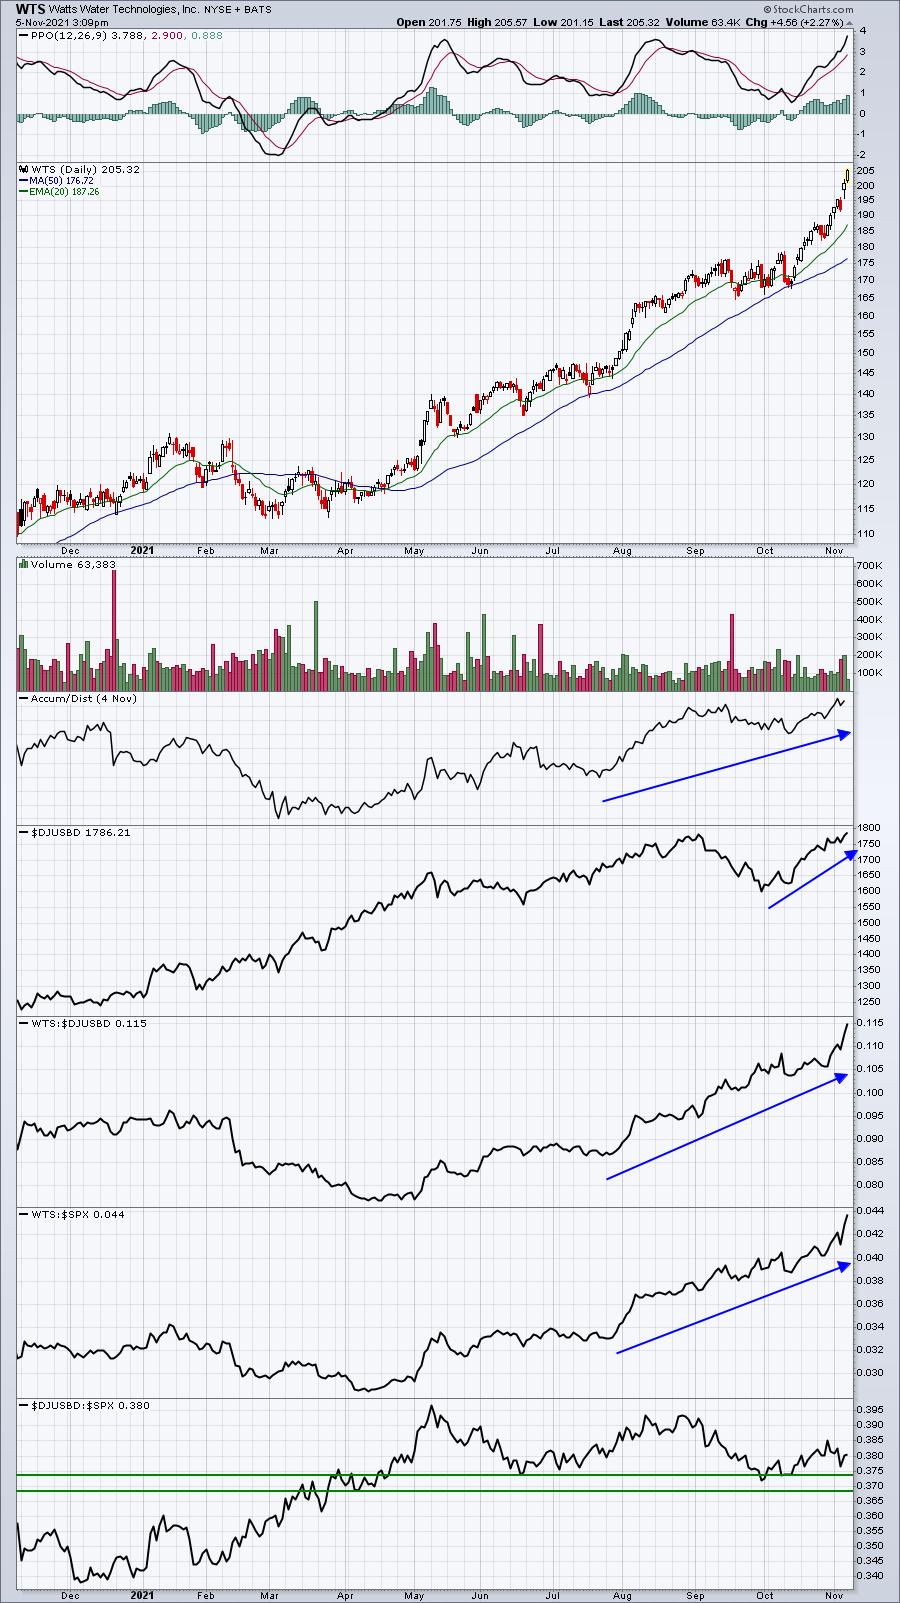
WTS has been soaring, obviously it's a favorite of Wall Street. But I can't, in good conscience, consider buying a stock this overbought. Also, the volume here is lighter than I like to trade. But it's easy to see why WTS has such a favorable look on an RRG chart.
GTLS:
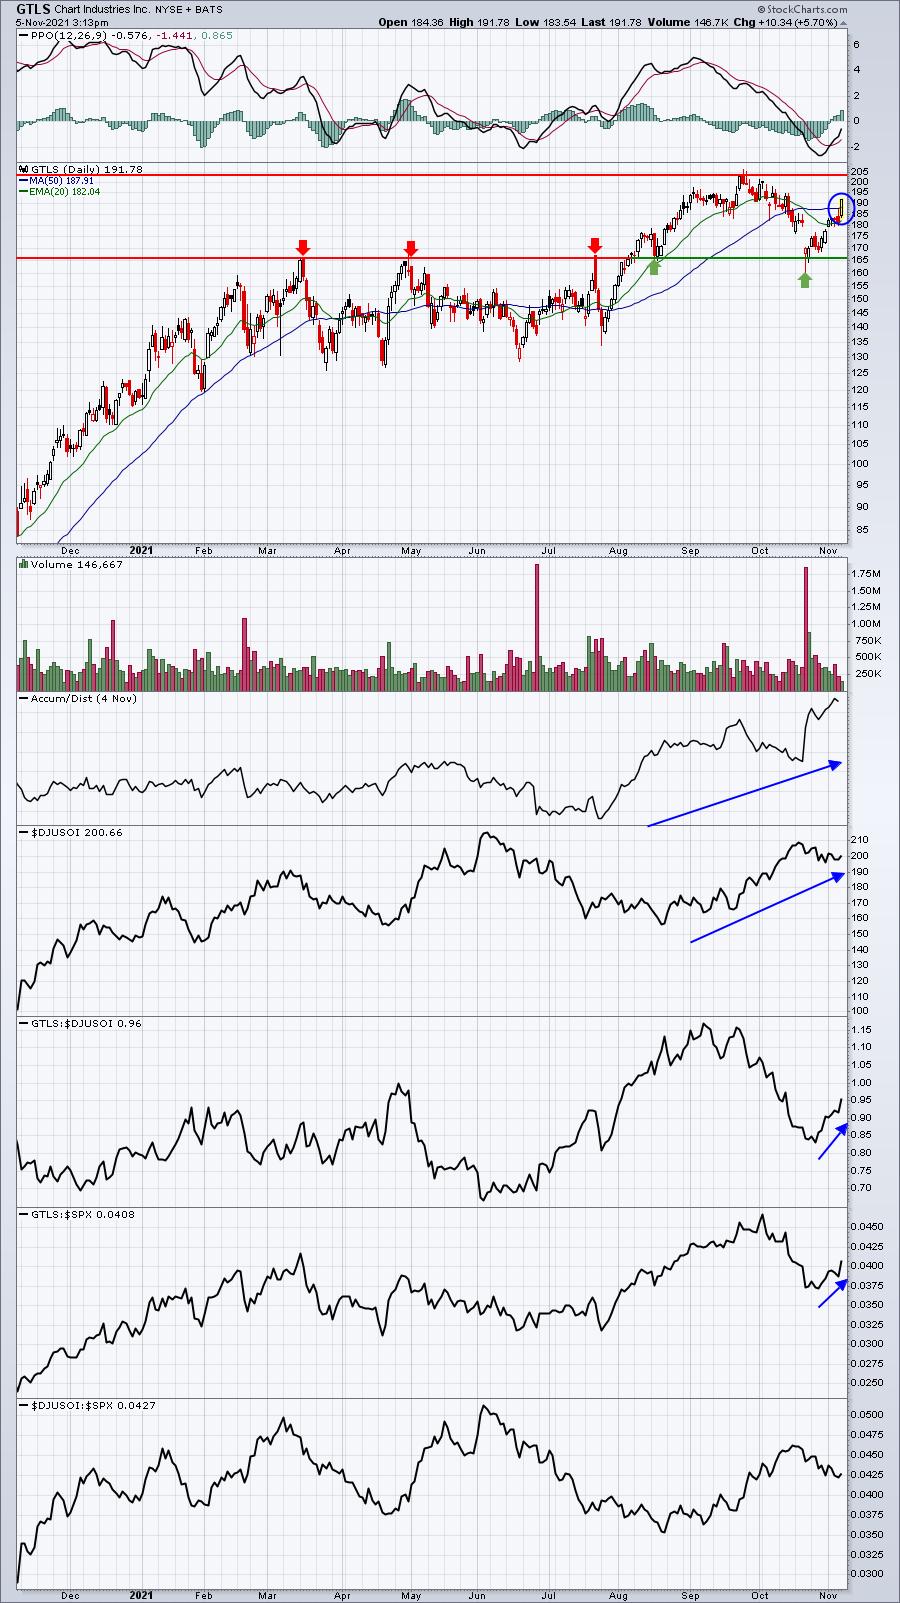
GTLS is currently in a trading range, but today's action is bullish as we're clearing key moving averages on today's strength. I see GTLS making another run eventually to 204 price resistance.
EXPO:
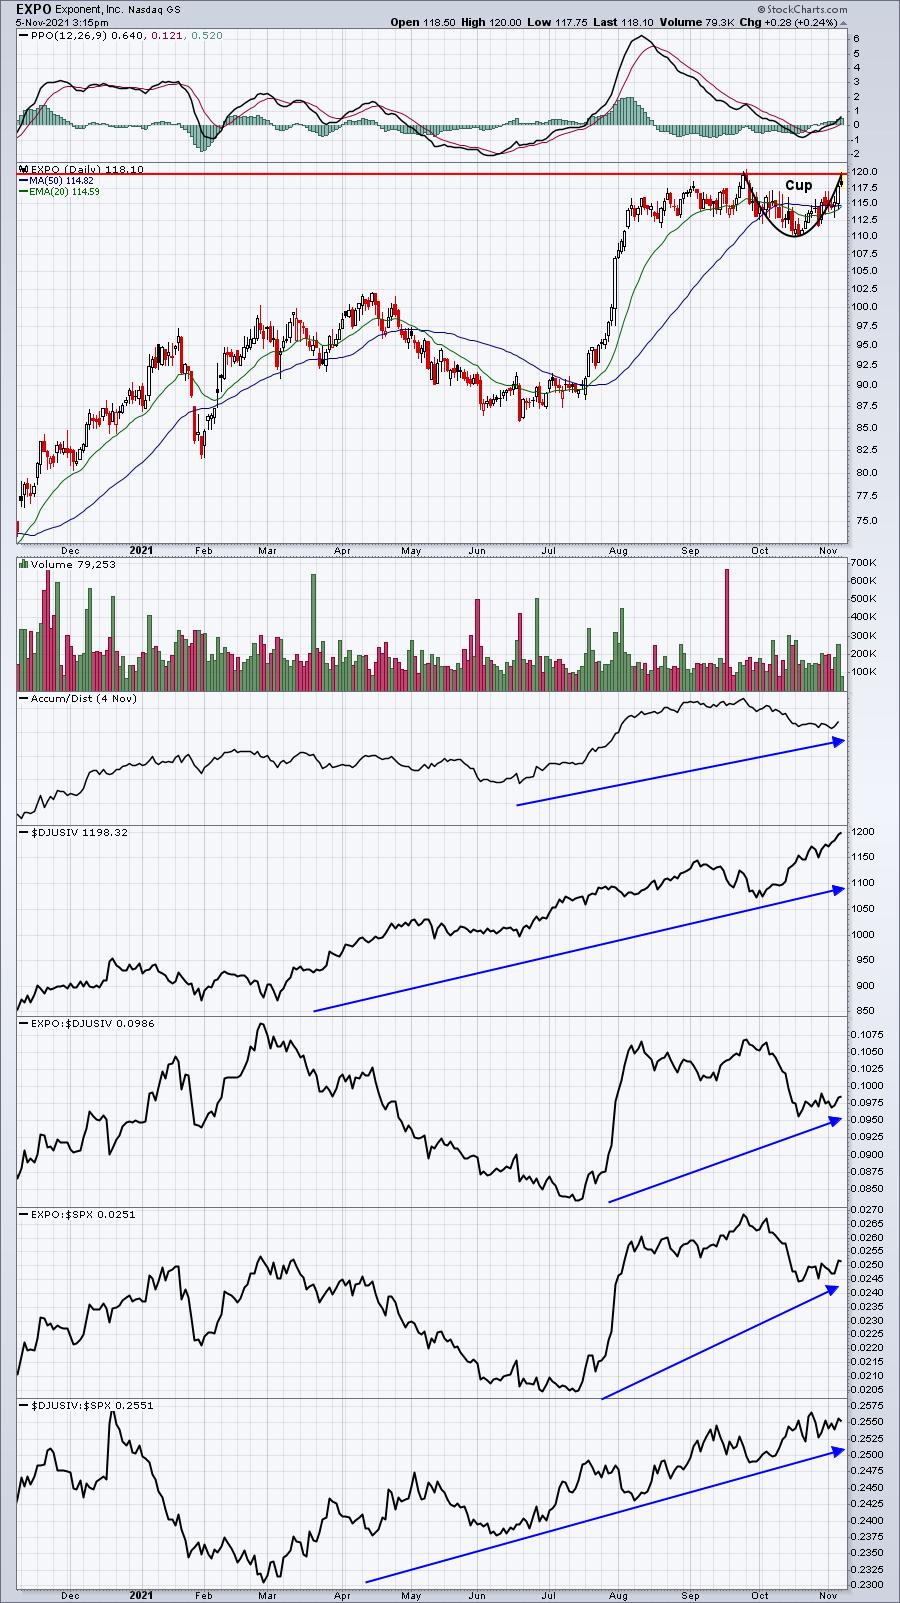
Of the 3 charts, I think EXPO is my favorite. It's also a little light in terms of volume, but we just completed the right side of a cup today. A pullback to test the rising 20-day EMA would likely be a great entry opportunity. EXPO is in the business support services ($DJUSIV) area, which has been consistently outperforming the S&P 500. Should that continue, which I believe it will, look for EXPO to break out of this cup with handle continuation pattern. But we may need to be a bit patient to allow the handle to form.
Earnings Reports
Here are the key earnings reports for the next two days, featuring stocks with market caps of more than $10 billion. I also include a few select companies with market caps below $10 billion. Finally, any portfolio stocks that will be reporting results are highlighted in BOLD. If you decide to hold a stock into earnings, please understand the significant short-term risk that you are taking. Please be sure to check for earnings dates for any companies you own or are considering owning.
Friday, November 5:
ENB, D, TRP, JCI, HMC, SRE, TU, MGA, VTR, DKNG, ELAN, KIM, BEP, TIXT, VST, PNW, GT, CGC, GOOS, FLR, CNK, AMCX, SSP, NOG, TEN, AXL
Monday, November 8:
PYPL, RBLX, TTD, IFF, AMC, BEKE, VTRS, TME, TREX, JKHY, OSH, BKI, FIVN, SWAV, ZNGA, COTY, FSK, NVTA, NEWR, BLDP, SPCE, ENV, TRIP, LMND, DDD, TSEM, CBT, SANM, MWA, BAND, SDC, RDNT, TGLS, EHTH
Economic Reports
October nonfarm payrolls: 531,000 (actual) vs. 450,000 (estimate)
October private payrolls: 604,000 (actual) vs. 400,000 (estimate)
October unemployment rate: 4.6% (actual) vs. 4.7% (estimate)
October average hourly earnings: +0.4% (actual) vs. +0.4% (estimate)
Happy trading!
Tom