
EB Daily Market Report - Tuesday, November 9, 2021
Executive Market Summary
- Futures were mostly flat as we opened for trading, but there's been a downward bias since
- The October PPI and Core PPI were released this morning and, while much higher than the Fed would like, they came in as expected at +0.6% and +0.4%, respectively
- The 10-year treasury yield ($TNX) responded by falling nearly 7 basis points to 1.43%, the lowest level in 6-7 weeks
- Despite the big drop in yields, the U.S. dollar (UUP) is flat today
- Crude oil ($WTIC, +1.12%) has spiked to nearly $83 per barrel; nonetheless, energy (XLE, -0.60%) is lower
- U.S. equities are definitely in defensive mode today at real estate (XLRE, +0.31%) and utilities (XLU, +0.24%) lead the action
- Consumer discretionary (XLY, -1.29%) continues to see profit taking as Tesla (TSLA, -8.30%) slides nearly 100 bucks
Market Outlook
We've had a steady decline in the 10-year treasury yield ($TNX) since peaking at 1.69% a little more than two weeks ago. Despite that, banks ($DJUSBK) have held up quite well. That suggests to me that this move down in the TNX likely will not last. Here's a chart of the TNX, showing key yield and trendline support rapidly approaching.
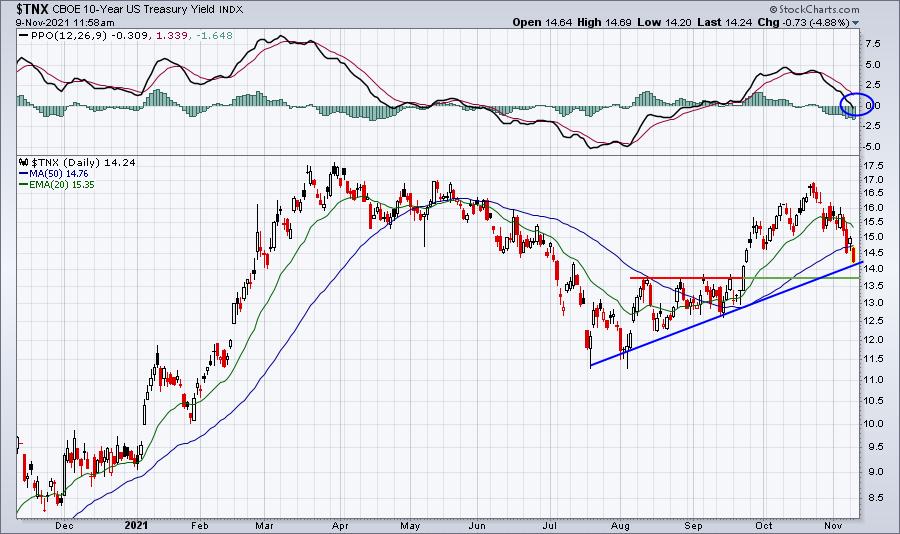
I'm still expecting a turn in the TNX somewhere between the current level and 1.38%. If it breaks below that 1.38% yield support, then growth stocks should benefit nicely. Rates remain extremely low, so I believe growth does well either way, but lower rates would increase the value of future earnings growth.
Sector/Industry Focus
Banks ($DJUSBK) have held up well during this descent in treasury yields. But there is a slight negative divergence that formed on the DJUSBK's recent top. It may not look like it at first glance, because the DJUSBK did not set a new intraday high, but PPOs are based on closing prices. The DJUSBK did actually print a higher CLOSE, which triggers the negative divergence. Note the bottom panel, which highlights the DJUSBK on a LINE CHART, rather than a candle chart:
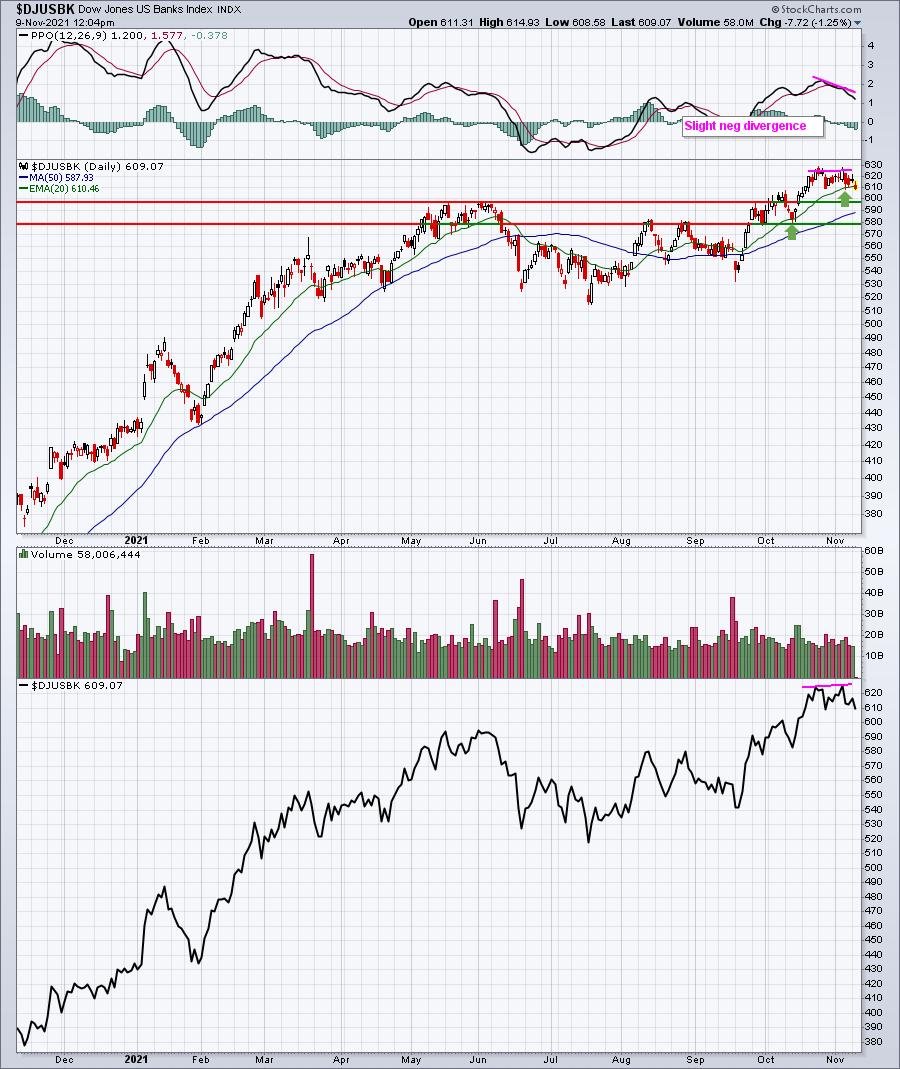
I rarely use line charts. I normally will only use them for two reasons. First, I use them on price-relative charts as they drowned out the noise from a candlestick chart. The second reason is to help identify divergences, both positive and negative, as candlesticks do not easily show higher highs or lower lows. The line charts, which only include closing prices, are much better for this purpose.
ChartLists/Strategies
If you trade or follow the Short Squeeze ChartList (SSCL), then you know how crazy volatile these stocks can be. I've been checking out these stocks with much more frequency this month as more and more begin to turn higher and put pressure on short sellers. While there are probably a dozen or so that I'm watching closely, here are 3 that are interesting to me:
BGFV:
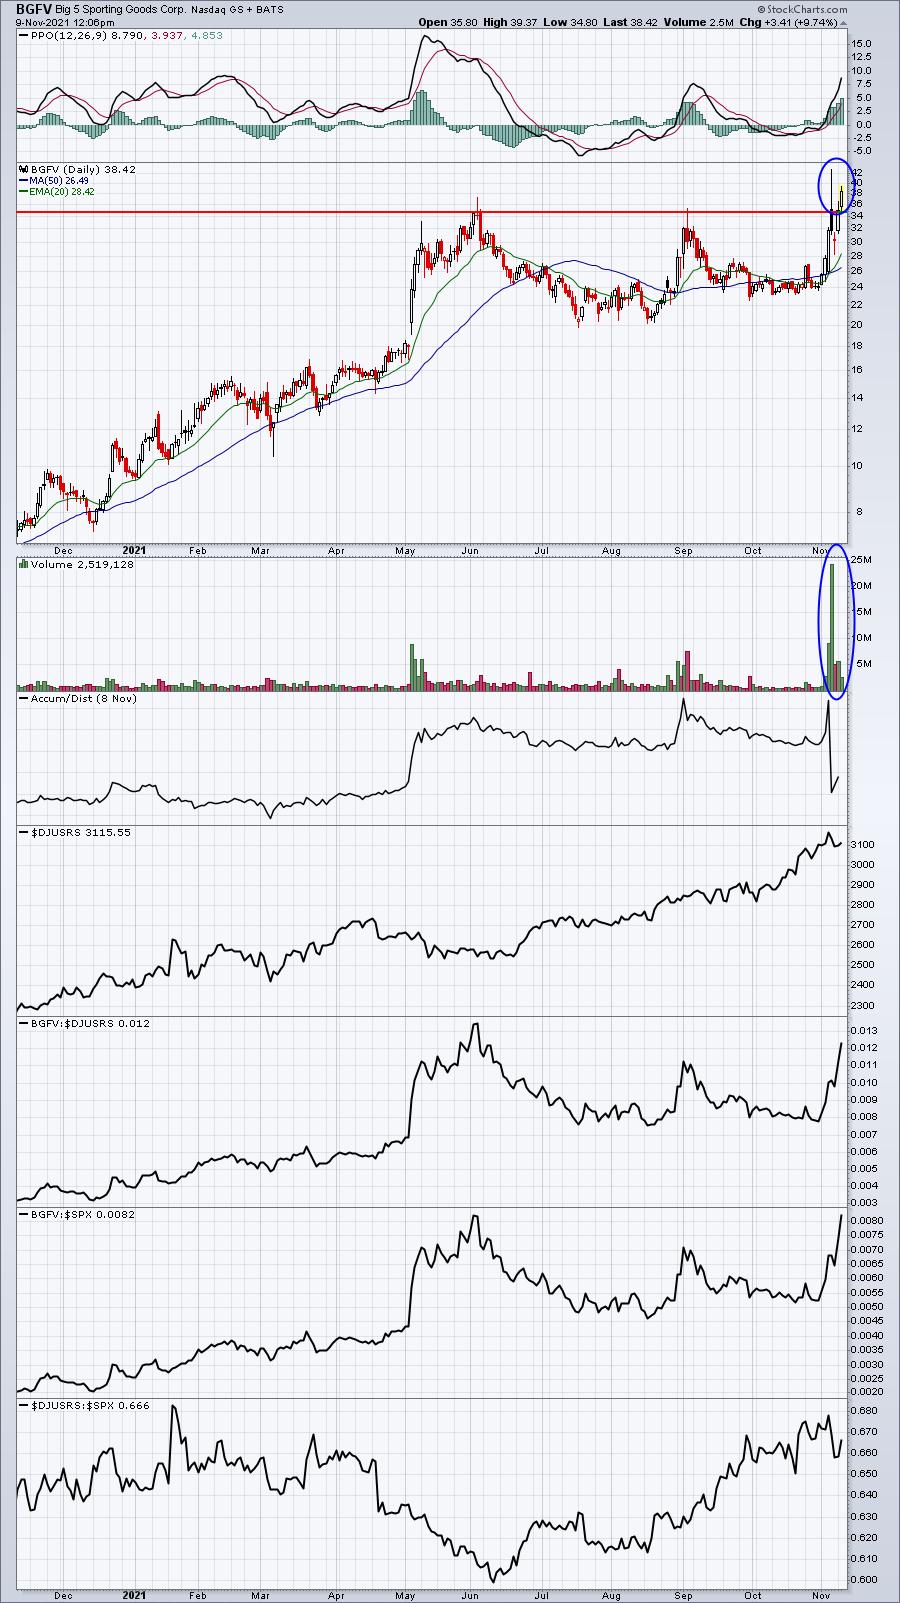
This is the obvious short squeeze candidate because of the breakout and the massive volume to accompany it. The big problem here, like it is with most short squeeze stocks, is the timing of entry. The volatility is so great that you make or lose a LOT in a very short period of time. You have to be prepared for extreme volatility.
SKLZ:
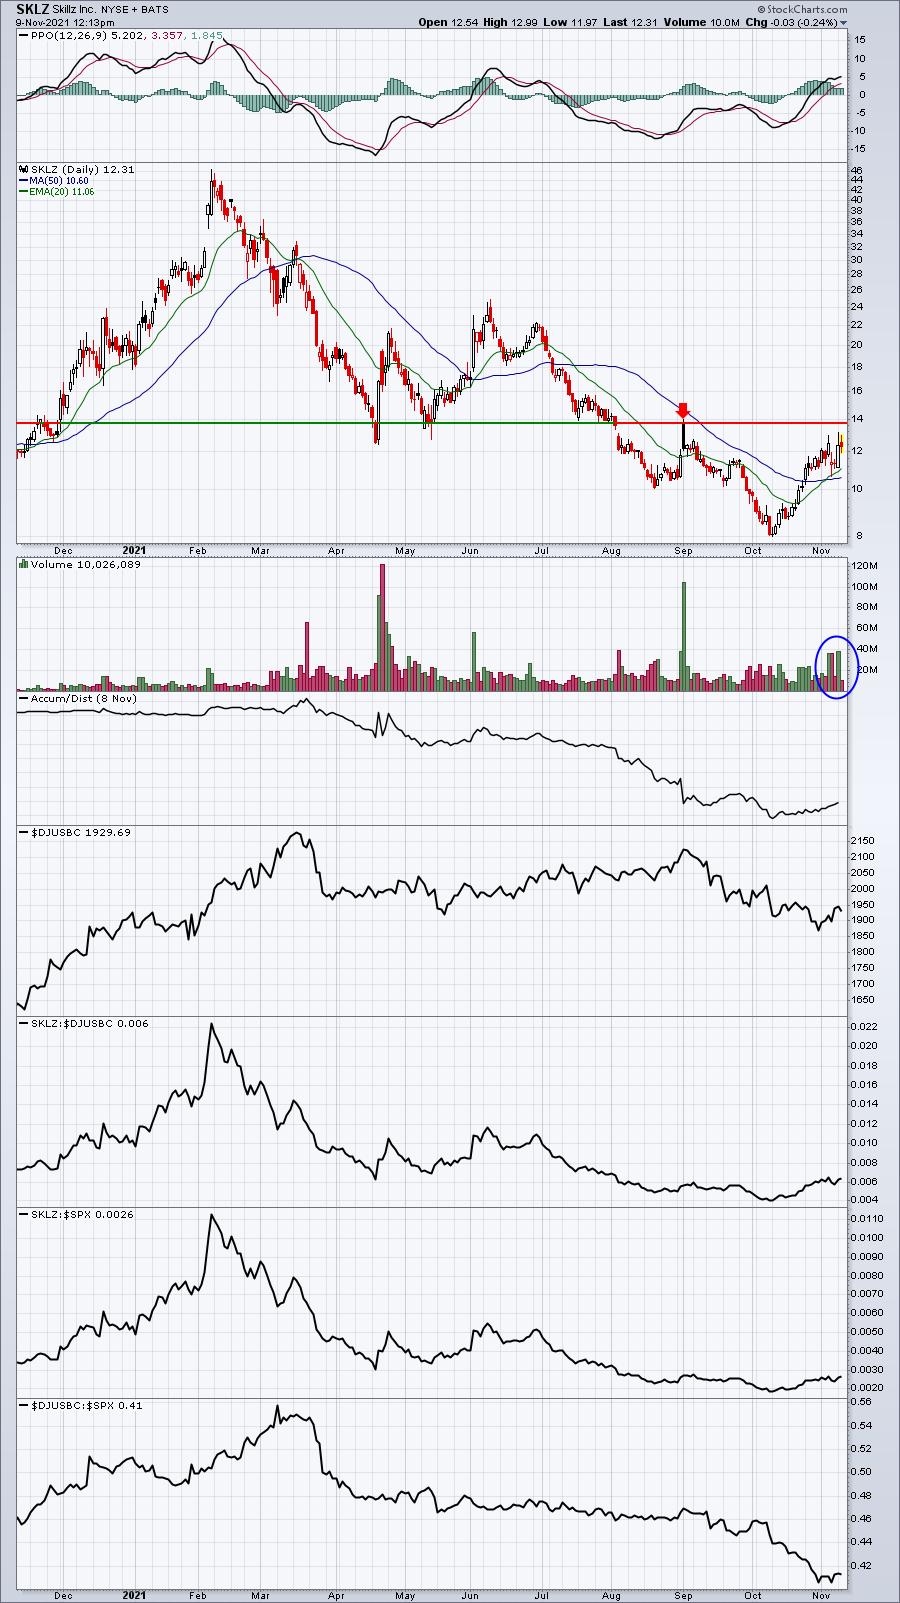
The volume on SKLZ has picked up and an uptrend seems to be in play short-term. I think, however, that we'll need to see the 14 dollar level cleared before pressure will be exerted on shorts.
VLDR:
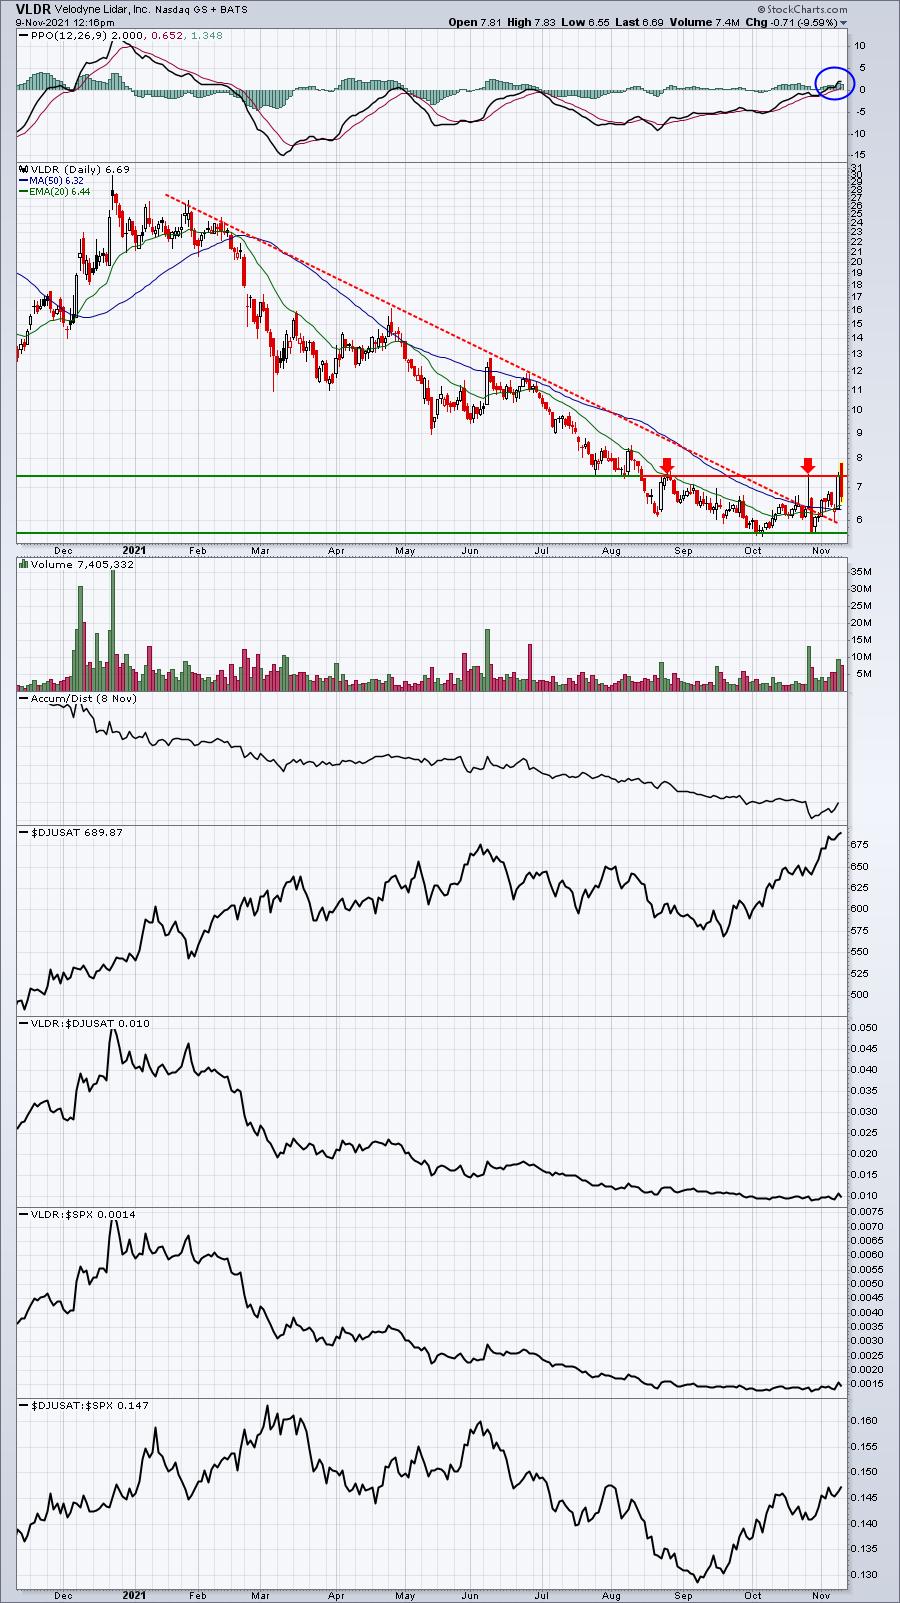
This is a very aggressive short squeeze play. It's still a little early, but VLDR has been downtrending for many months and its PPO just turned positive for the first time since February. It appeared to potentially break out this morning at the open, but it's since sold off hard. If it rallies this afternoon, however, shorts will be put on notice. Rising volume isn't a problem, it's just a matter of who's in charge at the end of the day.
Earnings Reports
Here are the key earnings reports for the next two days, featuring stocks with market caps of more than $10 billion. I also include a few select companies with market caps below $10 billion. Finally, any portfolio stocks that will be reporting results are highlighted in BOLD. If you decide to hold a stock into earnings, please understand the significant short-term risk that you are taking. Please be sure to check for earnings dates for any companies you own or are considering owning.
Tuesday, November 9:
COIN, DASH, NIO, BNTX, PLTR, U, SYY, DHI, TOST, UPST, RNG, BSY, CAH, DAR, DOCS, WRK, WYNN, MIDD, SGMS, ADT, IGT, EVBG, ELY, SEAS, MLCO, FUBO, SAIL, CARG, VCYT, HAE, NUVA, LGND, FLGT, TWNK, VCEL, NSTG, OCGN, SENS, TGI, ACB, AVID, PRPL, VERI
Wednesday, November 10:
DIS, AFRM, APP, EC, RPRX, GIB, SOFI, OLPX, GDRX, MQ, OPEN, ATO, IS, FICO, BRKS, AER, KGC, BYND, BMBL, CRCT, PRGO, TASK, FVRR, EYE, WEN, FOUR, ENR, ROOT
Economic Reports
October PPI: +0.6% (actual) vs. +0.6% (estimate)
October Core PPI: +0.4% (actual) vs. +0.4% (estimate)
Happy trading!
Tom