
EB Daily Market Report - Wednesday, November 10, 2021
Today's Event - Earnings Reaction Portfolio "Draft"
I'll be hosting a webinar later this afternoon to announce Earnings Reaction portfolio results from our inaugural quarter and to announce the 10 equal-weighted stocks that will represent this portfolio for the next 90 days. The webinar will begin at 5:30pm ET and our room will open no later than 5:00pm ET. Here's a link that you can use to join the webinar room directly:
https://earningsbeats.zoom.us/j/88398747346
If you can't make it, no worries. All of our webinars are recorded and we'll make sure you get a copy of the recording to listen at your leisure.
Executive Market Summary
- Futures were lower overnight, especially the NASDAQ as inflation data came in hotter than expected
- October CPI and Core CPI both were above expectations and signaled the short-term inflationary pressures are not over
- Selling has accelerated this afternoon
- The 10-year treasury yield ($TNX) has surged 11 basis points (up 16 basis points earlier) as bond traders react to the higher inflation
- Semiconductors ($DJUSSC, -2.88%) and software ($DJUSSW, -2.10%), two high-growth industry groups, have suffered today from the higher-than-expected CPI numbers
- That's led to technology (XLK, -1.61%) lagging badly
- Energy (XLE, -3.01%), however, is the worst performing sector as crude oil ($WTIC) has tumbled just over 3%
- Transportation stocks ($TRAN, -0.63%) have added to their Tuesday weakness as profit taking accelerates a bit
- Advanced Micro Devices (AMD, -5.66%) is continuing a very volatile stretch, tumbling today after a very impressive start to November
Market Outlook
Inflation is back and it'll likely be the catalyst to drive U.S. equity prices lower in the near-term. Selling of bonds (with corresponding rising treasury yields) and selling of growth stocks is what we can typically expect whenever there's an inflationary scare of any type. I discussed the bond market's reaction above, so let's look at the growth vs. value price relative chart (IWF:IWD):
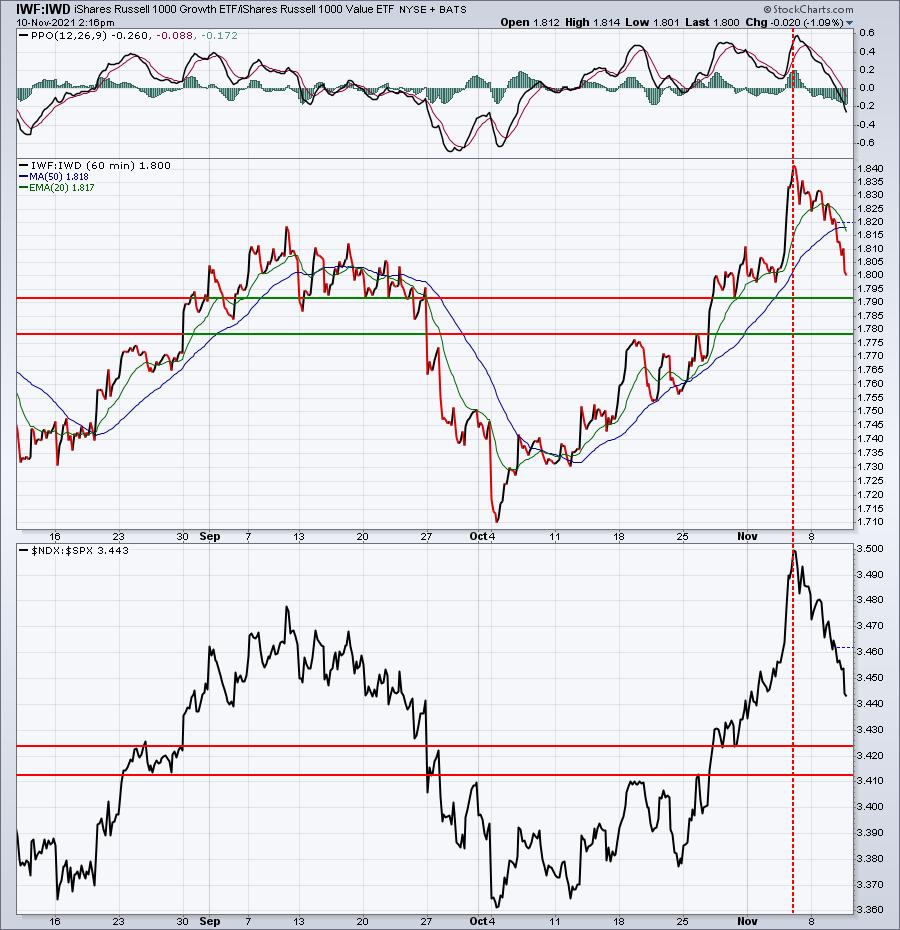
When growth stocks underperform, it's typically indicative of underperformance of NASDAQ 100 ($NDX) shares as well. That's exactly what the above 3-month hourly charts illustrates. I would expect more downside to both of these ratios before we see a market bottom. I believe we'll ultimately see at least a 20-day EMA test across our major indices, possibly more.
Sector/Industry Focus
Let's look at software ($DJUSSW), which has been a big leader in the market since May:
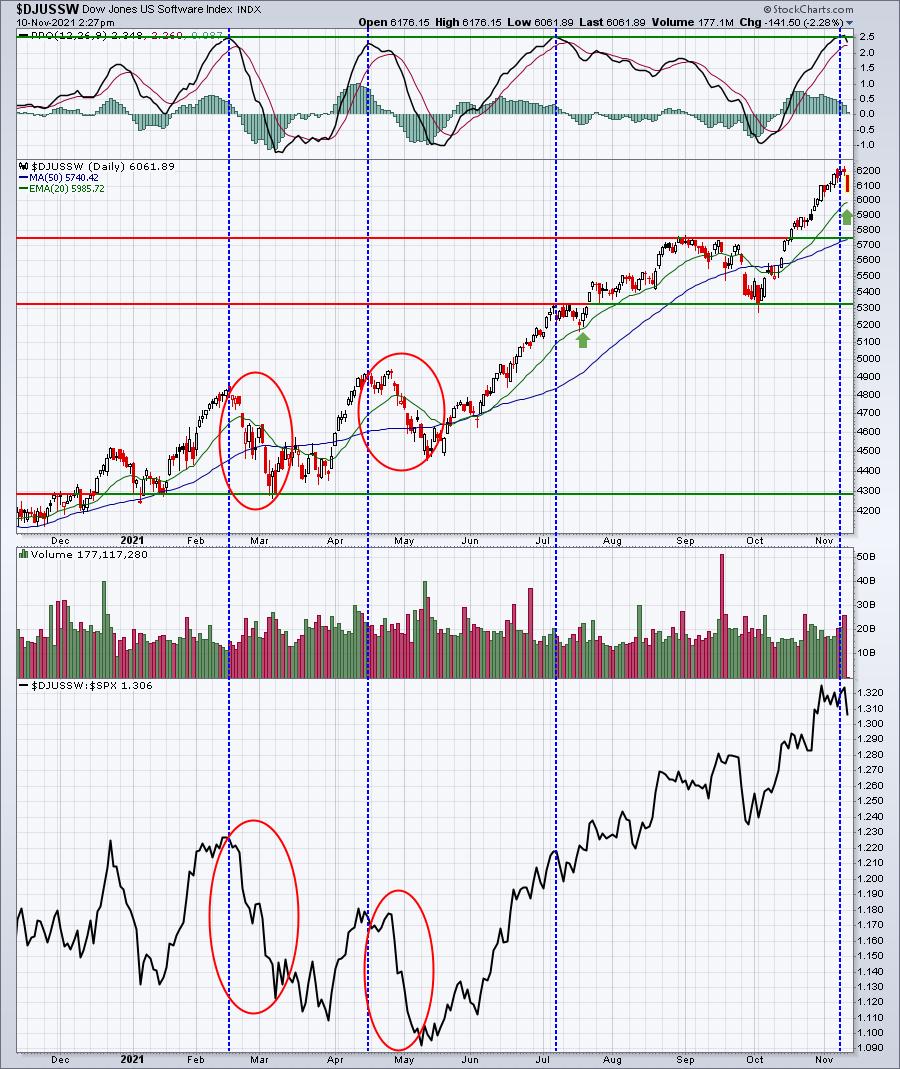
The red circles from February and May highlight how poorly software performed during the inflation scare earlier in 2021, but the green arrow in July illustrates the much more shallow pullback to test the rising 20-day EMA. A reversal off the 20-day EMA is what we'd like to see, but we cannot rule out further selling as long as inflation worries are "in the air". So if the DJUSSW were to drop swiftly below 6000, the odds of a deeper period of selling would increase substantially.
We're in the very bullish Q4, so my opinion is that this selling will not extend for weeks, but rather for days, and be of the more shallow variety.
ChartLists/Strategies
A member wrote and asked how to find small cap and mid cap stocks in the industrials (XLI) and materials (XLB) sectors. It's a great question, because both the XLI and XLB broke out recently, which followed breakouts in both the S&P 400 Mid Cap Index and S&P 600 Small Cap Index. I'd start with the following scan:
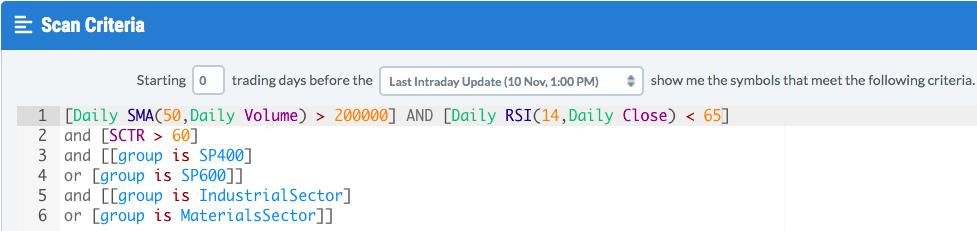
I added the SCTR > 60, average daily volume > 200,000 shares, and RSI < 65 to ensure (1) at least some relative strength, (2) liquidity, and (3) that the stock isn't excessively overbought. Here were the 19 stocks returned in SCTR order:
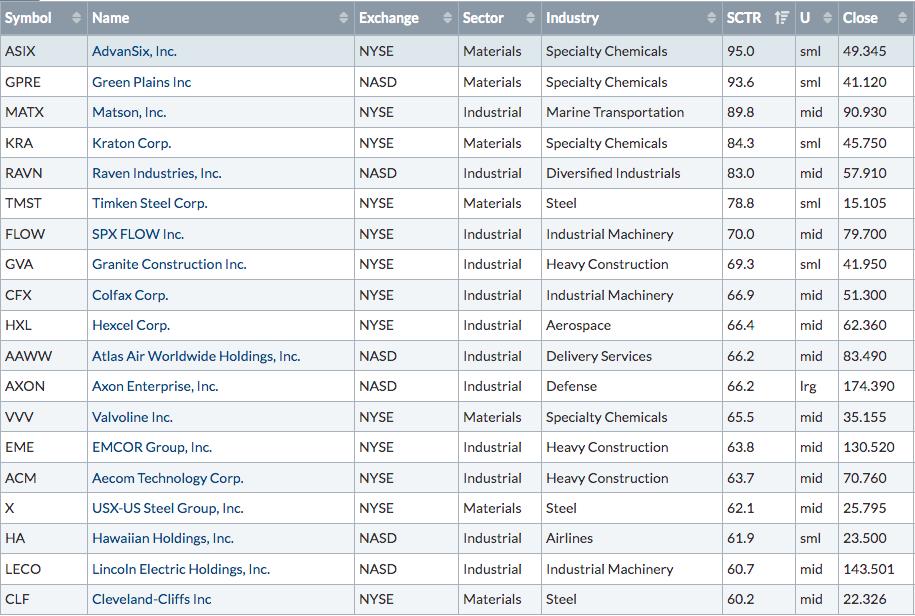
From this list of 19 stocks, the following appear interesting to me:
GVA:
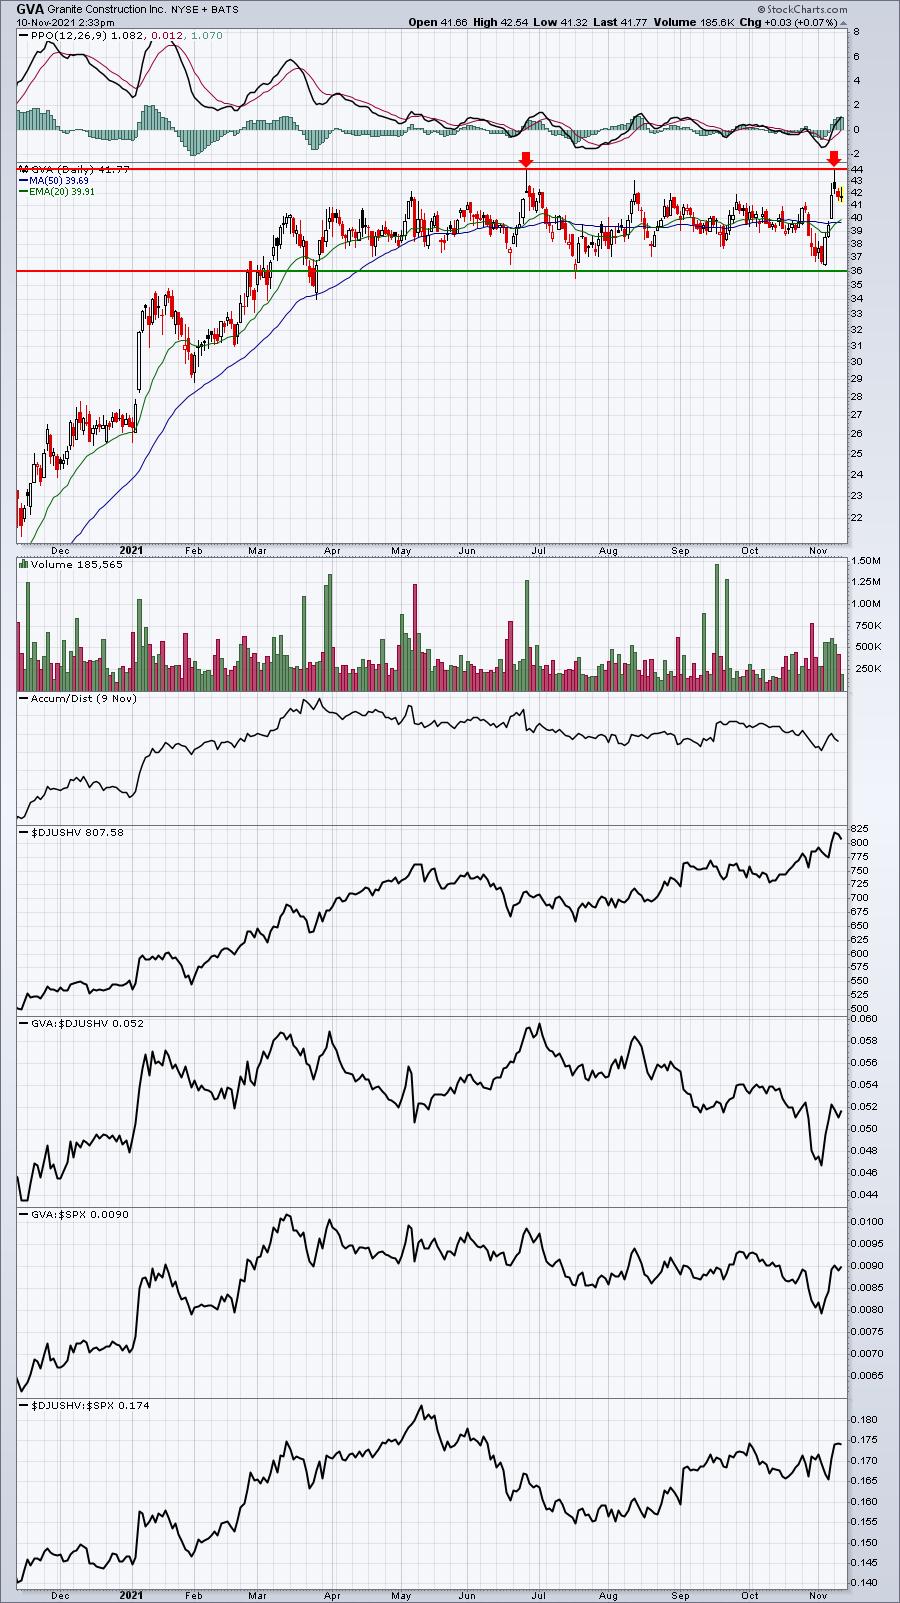
GVA has been sideways consolidating for a long time, setting up a beautiful base. An eventual breakout here would confirm another leg higher.
EME:
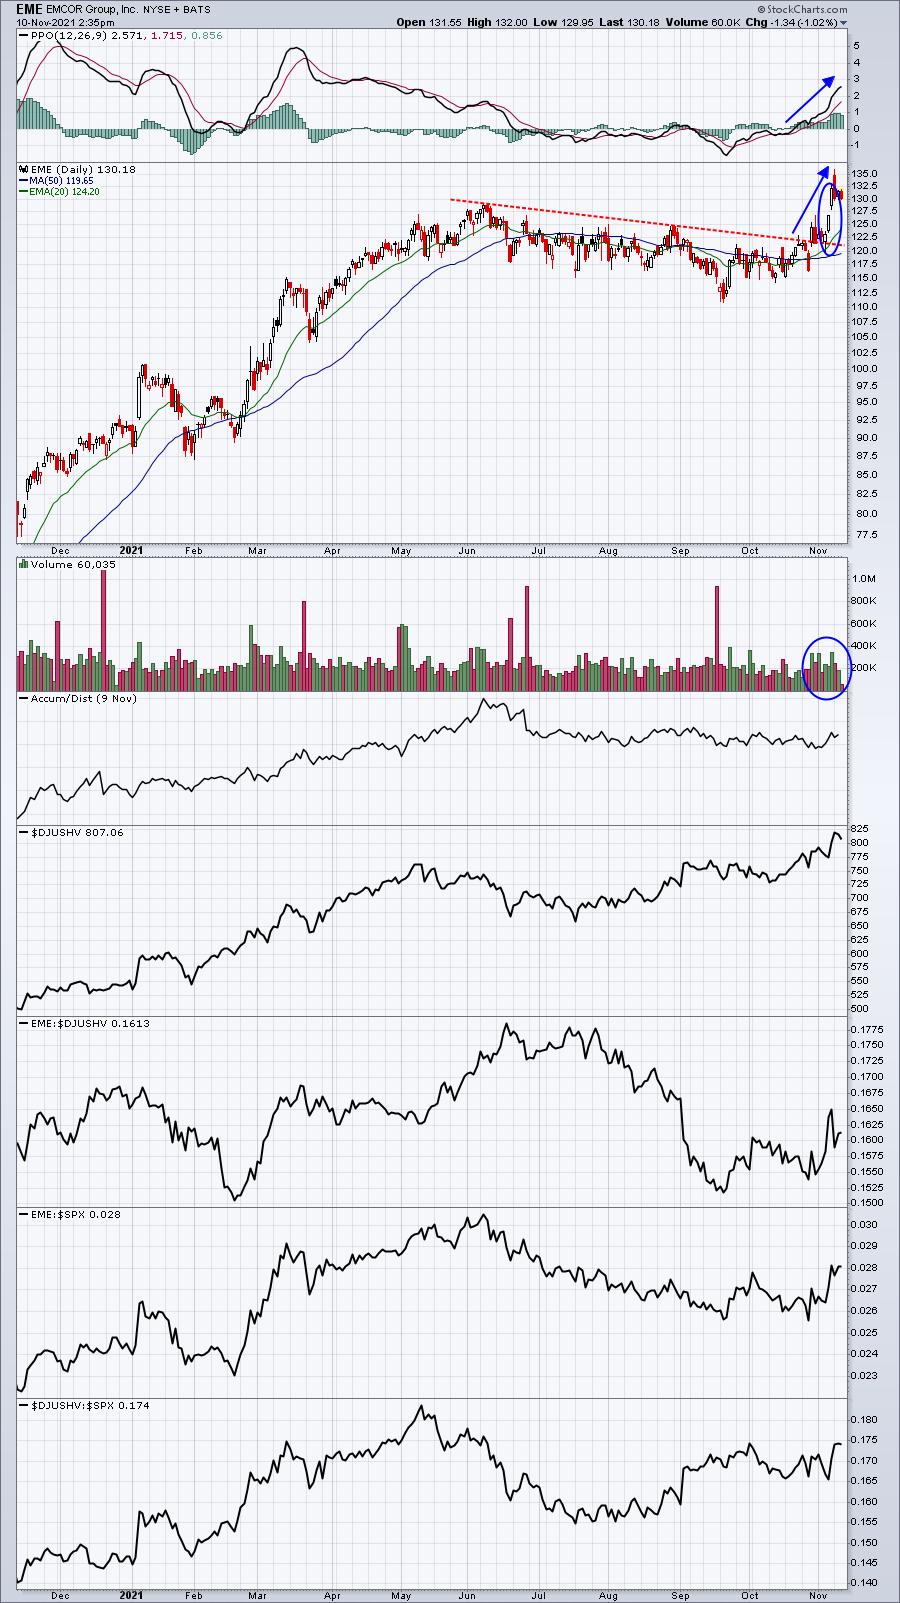
EME already made the breakout and did so with "three white soldiers", a bullish 3-candlestick pattern. EME would be a solid trade on a 20-day EMA test.
CLF:
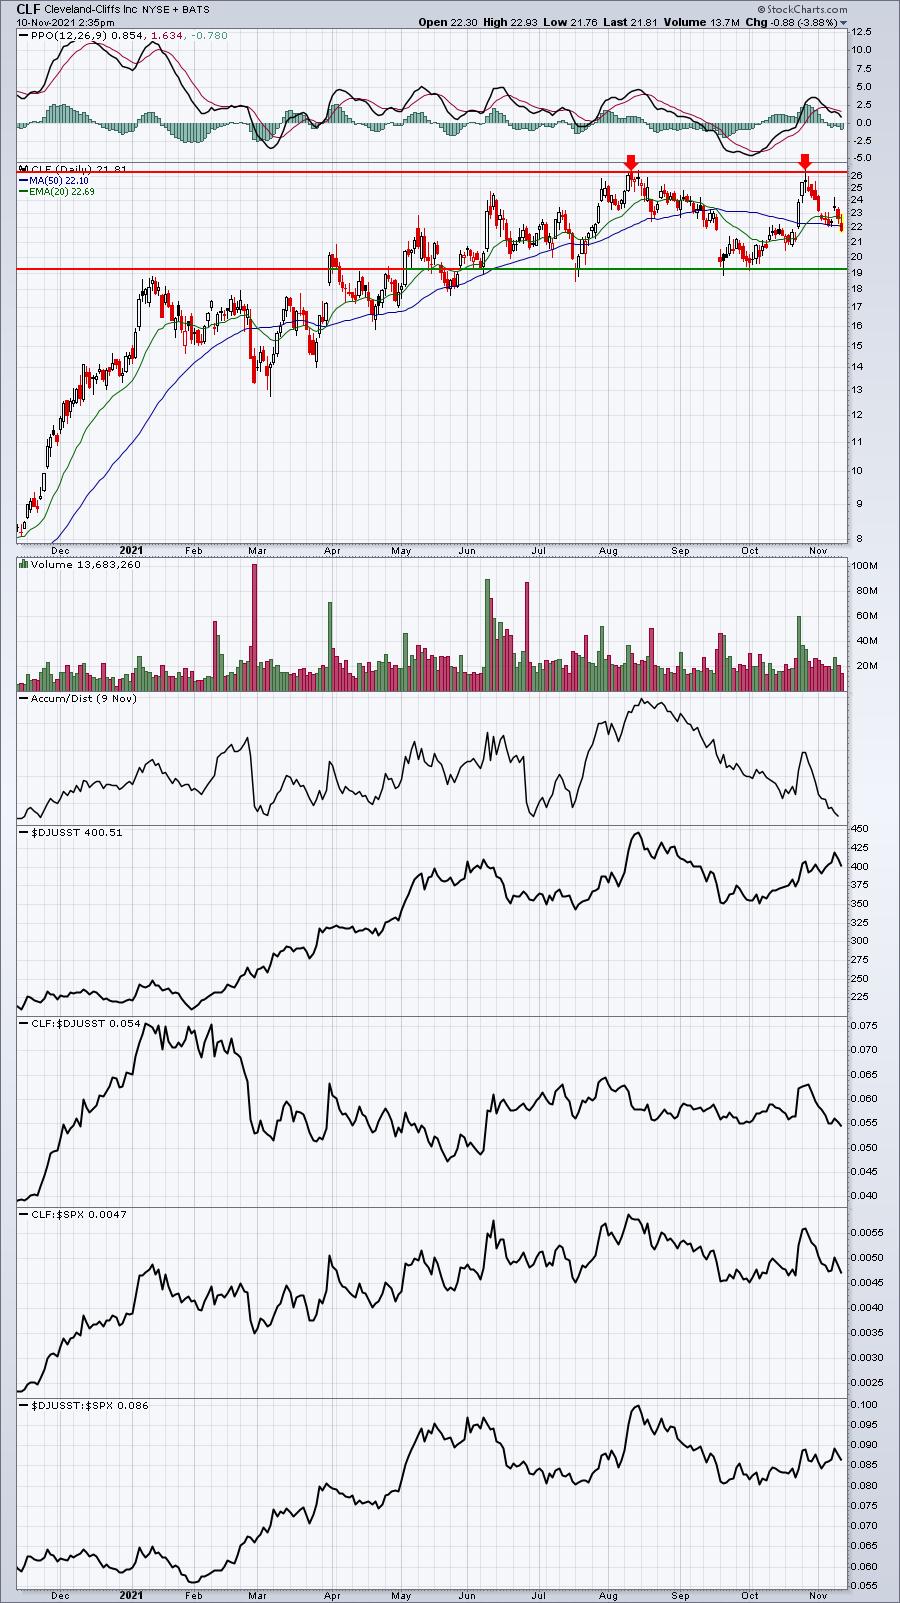
CLF is also consolidating and setting up in a very nice extended base. Generally speaking, breakouts from this type of pattern produces significant gains ahead. But we need to see that breakout.
Earnings Reports
Here are the key earnings reports for the next two days, featuring stocks with market caps of more than $10 billion. I also include a few select companies with market caps below $10 billion. Finally, any portfolio stocks that will be reporting results are highlighted in BOLD. If you decide to hold a stock into earnings, please understand the significant short-term risk that you are taking. Please be sure to check for earnings dates for any companies you own or are considering owning.
Wednesday, November 10:
DIS, AFRM, APP, EC, RPRX, GIB, SOFI, OLPX, GDRX, MQ, OPEN, ATO, IS, FICO, BRKS, AER, KGC, BYND, BMBL, CRCT, PRGO, TASK, FVRR, EYE, WEN, FOUR, ENR, ROOT
Thursday, November 11:
BAM, CPNG, CAE, CELH, FLO, ARRY, GRWG, BLNK
Economic Reports
Initial jobless claims: 267,000 (actual) vs. 271,000 (estimate)
October CPI: +0.9% (actual) vs. +0.5% (estimate)
October Core CPI: +0.6% (actual) vs. +0.4% (estimate)
Happy trading!
Tom