
EB Daily Market Report - Tuesday, November 16, 2021
Today's Max Pain Event
It's time for another max pain event! Is it just me, or are these months flying by? Anyhow, I'll be discussing max pain levels on the two ETFs that track the S&P 500 and NASDAQ (SPY and QQQ, respectively) and on several individual stocks, whose price direction could be swayed near-term by massive option imbalances. If you'd like to join me this afternoon, we'll get started at 4:30pm ET. Here's the room link:
https://earningsbeats.zoom.us/j/83309870834
The room will open at approximately 4:00pm ET. If you can't make it, no worries. We'll record the event and make sure you receive a copy of the recording so that you can review at your leisure.
ChartLists Updated
I failed to mention yesterday, but both the Strong Earnings ChartList (SECL) and the Strong Future Earnings ChartList (SFECL) were updated over the weekend. You can now view or download these ChartLists from our website.
In addition, I'm hoping to add updated versions of both the Strong AD ChartList (SADCL) and Raised Guidance ChartList (RGCL) later today or tomorrow as well.
Executive Market Summary
- Futures were mixed overnight as most key indices gapped down at the open
- We've seen strength across all indices throughout today's session, however
- Home Depot (HD, +5.79%) is easily the best performing Dow Jones component stock today after posting excellent quarterly earnings results
- Nike (NKE, +2.33%) and Microsoft (MSFT, +1.26%) are solid as well, but MSFT is sporting a nasty negative divergence on its breakout - See ChartLists/Strategies below
- Consumer discretionary (XLY, +1.62%) and technology (XLK, +0.96%) are the leading sectors, but options expiration this Friday cannot be ignored with respect to these two sectors
- Cryptocurrencies, meanwhile, are being battered as bitcoin ($BTCUSD) and etherium ($ETHUSD) are both lower by more than 5%
- Commodities are mostly lower, though crude oil ($WTIC, +0.38%) is one exception
- October retail sales were exceptionally strong, easily trouncing forecasts, and the S&P Retail ETF (XRT, +0.94%) is moving higher
- Despite strong economic reports this morning, the 10-year treasury yield ($TNX) is flat on the session
Market Outlook
The good news is that our major indices are trading higher today. The bad news is that any new high on the daily chart is likely to be accompanied by negative divergences across the Dow Jones, S&P 500, and NASDAQ. I wrote an article in my Trading Places blog earlier and showed the potential negative divergence on the S&P 500. So here let's look at the NASDAQ:
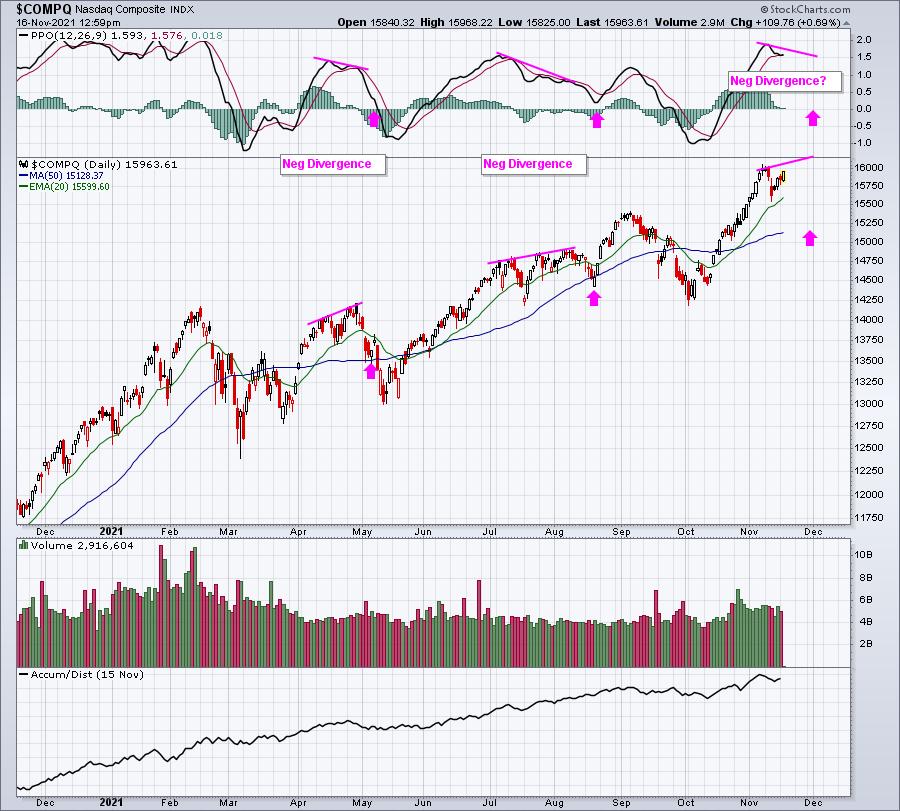
Keep in mind that we're in the midst of a very significant secular bull market advance and negative divergences guarantee us nothing. But, the risks of a decline are certainly elevated based on a few factors, including the negative divergences that are about to print.
Sector/Industry Focus
The U.S. Dollar (UUP, +0.27%) is surging higher after having broken out above highs from earlier in 2021. With strength yesterday and today, the UUP has cleared the reaction high in September 2020 and is now at a 16-month high:
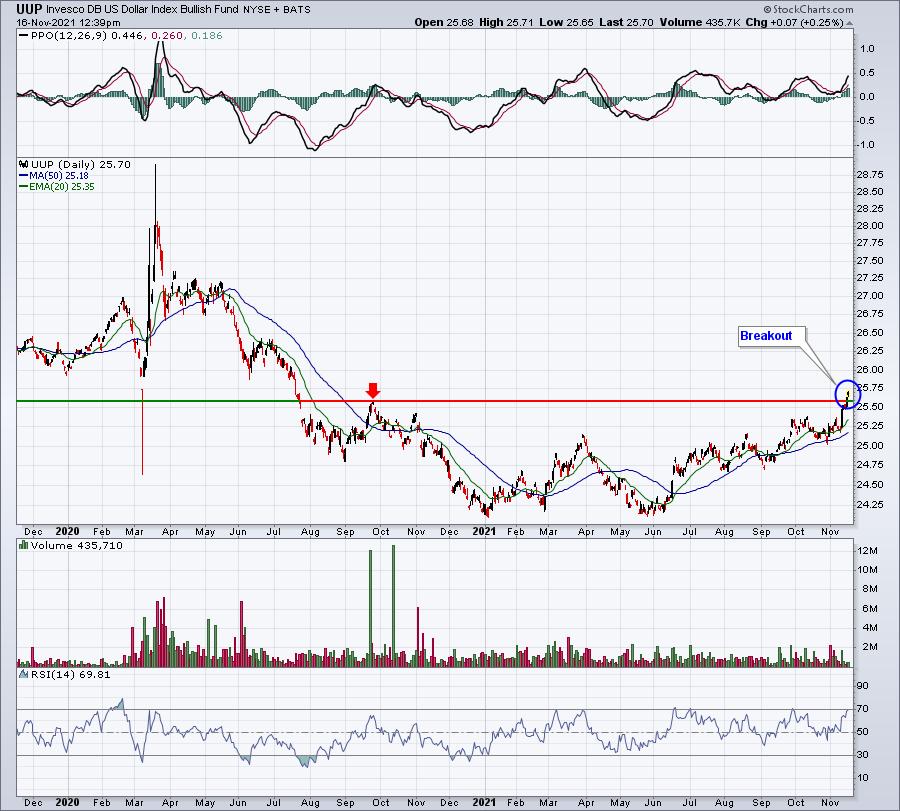
The U.S. treasury yields are moving up faster than Germany's ($UST10Y-$DET10Y) and this has been a solid indicator of dollar direction historically. If U.S. yields are moving up faster, it suggests a stronger economy here and, hence, a stronger dollar. The difference in our yields vs. Germany is at an 8-month high and not far from breaking out to a new post-pandemic high. This is great news for dollar bulls and definitely is reason to reconsider any thoughts relating to overweighting energy or materials.
ChartLists/Strategies
I'd be careful currently, as I mentioned in yesterday's DMR. I believe there are enough warning signs to rein in the bullishness. It doesn't mean we won't or can't go higher, it simply means risks are raised. Given that its options expiration week, it's one time during the month where you might consider shorting. I'd look to stocks that are heavily traded in the options world and likely having TONS of net in-the-money call premium, together with the appearance of slowing momentum (negative divergences). Here are two that most definitely fit the bill currently:
MSFT:
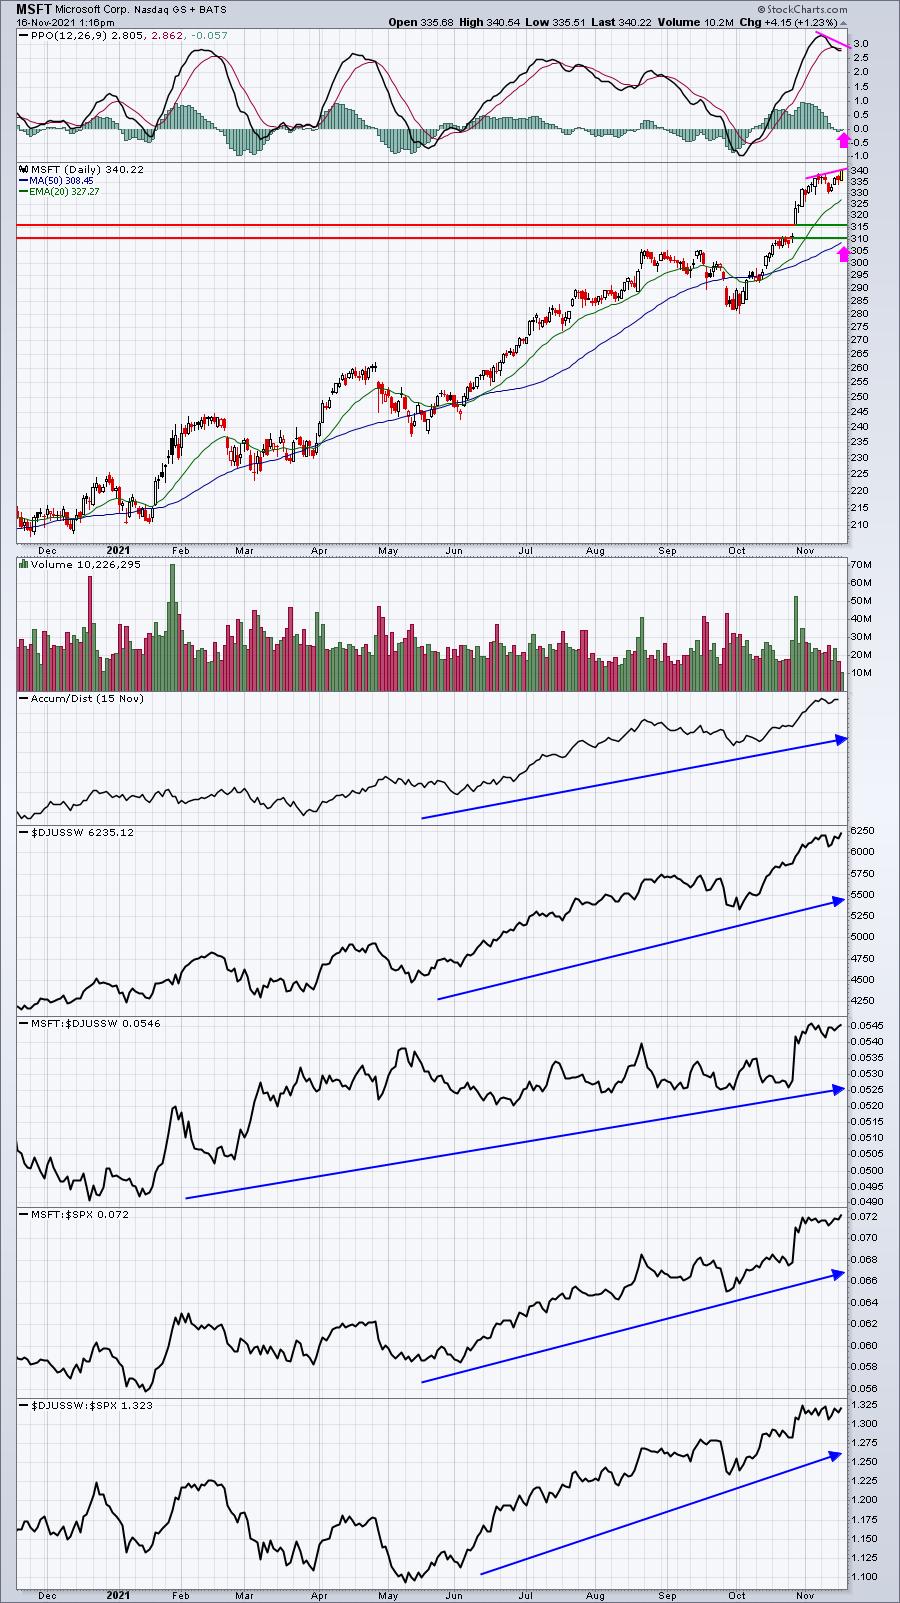
MSFT is a poster child of a "leading stock in a leading industry group", so please don't misunderstand me here. I LOVE MSFT further down the road. But, if I owned it short-term as a trader, I'd consider taking profits, selling calls against my position, buying put insurance, something. I won't be shocked if MSFT begins to struggle at some point this week and into next week.
NVDA:
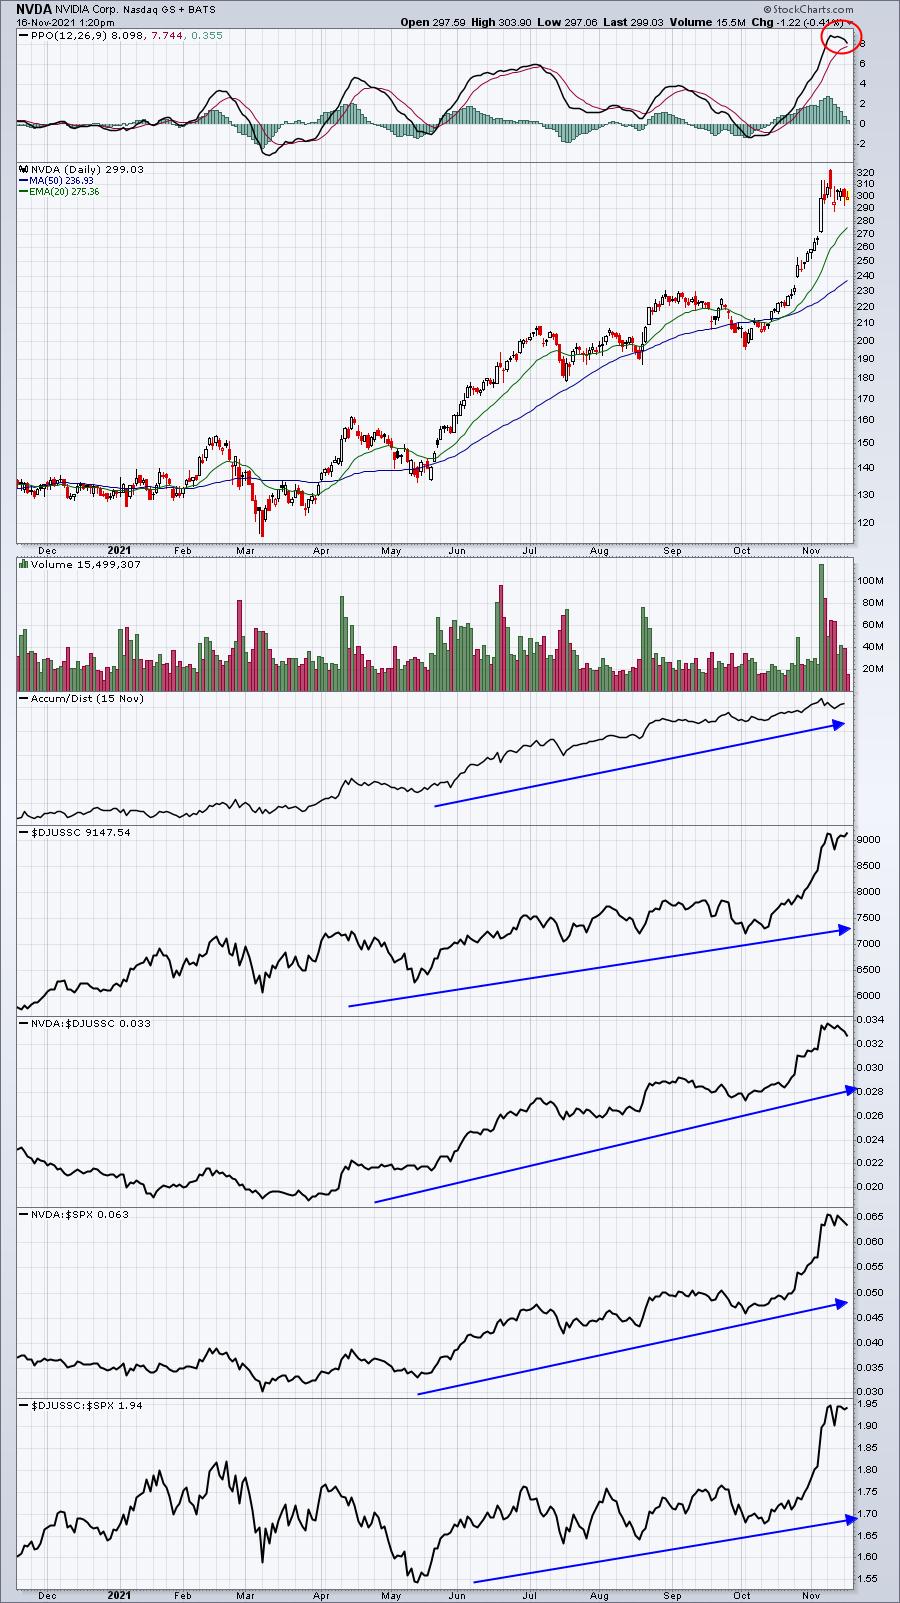
I mention NVDA because it will be reporting its quarterly results tomorrow after the closing bell. If it gaps higher with excellent results (which I believe NVDA will produce), just remain grounded. NVDA has already made a HUGE pre-earnings move higher and we could see a "buy on rumor, sell on news" event after earnings are released. NVDA also has a TON of net in-the-money calls that you need to be aware of. A quick post-earnings selloff (possibly after a gap higher) would not be a surprise at all.
Earnings Reports
Here are the key earnings reports for the next two days, featuring stocks with market caps of more than $10 billion. I also include a few select companies with market caps below $10 billion. Finally, any portfolio stocks that will be reporting results are highlighted in BOLD. If you decide to hold a stock into earnings, please understand the significant short-term risk that you are taking. Please be sure to check for earnings dates for any companies you own or are considering owning.
Tuesday, November 16:
WMT, HD, SE, NTES, TDG, ONON, GDS, ARMK, STNE, DAVA, DLB, RSKD, LZB
Wednesday, November 17:
NVDA, CSCO, LOW, TGT, TJX, BIDU, CPRT, BILI, BBWI, ZTO, TTEK, IQ, VSCO, SONO, KLIC, HI, HP
Economic Reports
October retail sales: +1.7% (actual) vs. +1.0% (estimate)
October retail sales less autos: +1.7% (actual) vs. +0.9% (estimate)
October industrial production: +1.6% (actual) vs. +0.9% (estimate)
October capacity utilization: 76.4% (actual) vs. 75.8% (estimate)
September business inventories: +0.7% (actual) vs. +0.8% (estimate)
November housing market index: 83 (actual) vs. 80 (estimate)
Happy trading!
Tom