
EB Daily Market Report - Wednesday, November 24, 2021
Fall Special
Just a quick reminder that our Fall Special runs through Saturday, November 27th, at midnight. If you'd like to see the details and savings, CLICK HERE.
Holiday Schedule
Happy Thanksgiving!
We'll be closed this Thursday for the Thanksgiving Day holiday. We will be available on Black Friday, though there will not be a Daily Market Report on Friday. The U.S. stock market will be closed on Thursday and it'll have an abbreviated session on Friday, closing at 1:00pm ET.
ChartLists Updated
I have updated both the Strong Earnings ChartList (SECL) and Strong Future Earnings ChartList (SFECL), but it hasn't been updated on our site yet. We'll likely have both of those links updated later today.
Executive Market Summary
- Futures were down overnight and we opened significantly lower across all of our major indices
- Economic reports were mostly stronger than expected, including initial jobless claims below 200,000 - the lowest level since 1969
- The 10-year treasury yield ($TNX), perhaps surprisingly, is down over a basis point to 1.65%, despite the strong reports
- The 2pm ET FOMC minutes revealed that members are ready to raise rates to combat persistently higher inflation; seeing how U.S. stocks react in the final two hours to this revelation will be important
- Copper ($COPPER) is looking to close at a 1-month high and is accelerating on a relative basis to gold ($GOLD) - this is a bullish signal for equities and bearish for inflation, in my opinion
- Real estate (XLRE, +1.01%) and energy (XLE, +0.78%) is where much of today's strength is, while materials (XLB, -0.75%) is weak on a relative basis
- Steel ($DJUSST, -2.08%) is producing headwinds for the materials group
- Gap, Inc. (GPS, -23.16%) and Autodesk (ADSK, -16.92%) are the two worst performing S&P 500 companies after releasing their respective quarterly earnings reports
Market Outlook
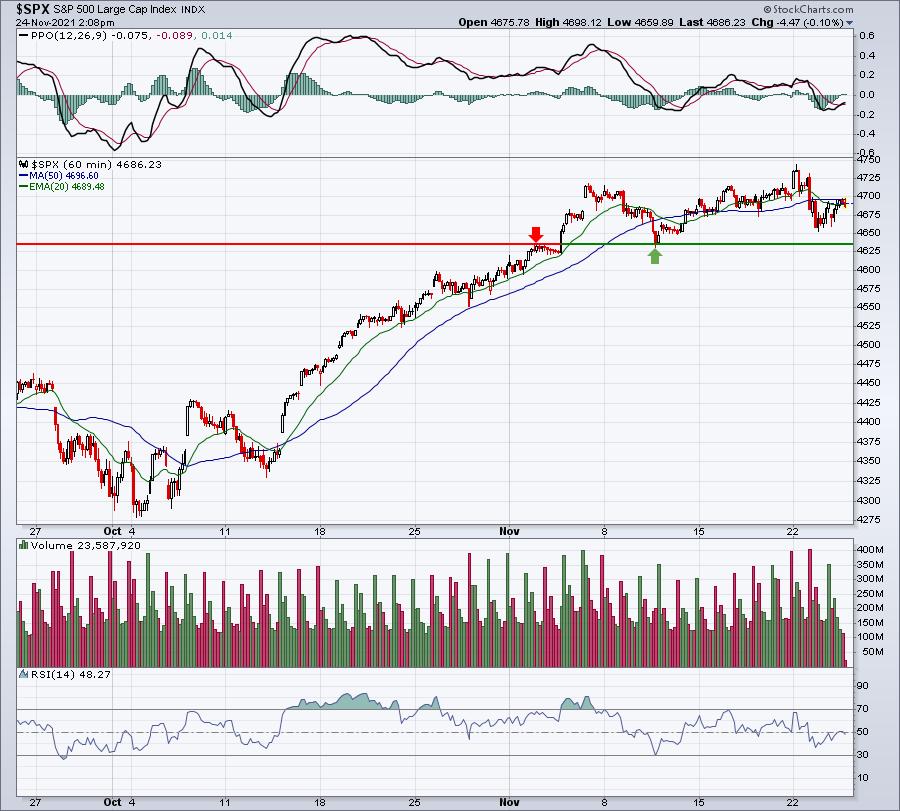
Will we see more weakness ahead in our key indices? That's a million dollar question as there's certainly that risk right now. However, we've seen the stock market rally in the afternoon two consecutive days (unless we fall apart this afternoon) and that's a sign of potential accumulation. To the downside on the S&P 500 and NASDAQ, I'd watch the annotated support levels below:
S&P 500:
NASDAQ:
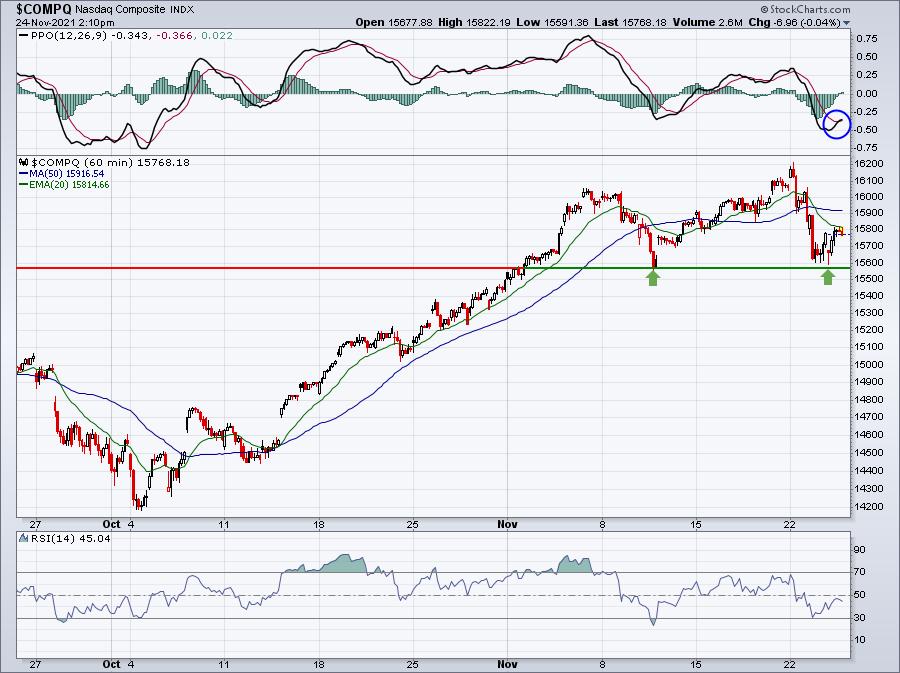
This morning's low on the NASDAQ nearly tested the low from two weeks ago. The blue circle on the NASDAQ's hourly PPO suggests that even if we do go down one more time, there'll be a positive divergence likely awaiting. I'm not sure we're going to see much more weakness near-term. Instead, I'm looking for a bounce. I'd reconsider that thought process IF we finish on lows this afternoon. At last check, we are rolling over, but there's almost two hours left in the session.
Sector/Industry Focus
Internet stocks ($DJUSNS) have been weak since the beginning of September on a relative basis, but the group has an excuse. It's been consolidating and industries almost always lose relative strength during such periods. The good news for the DJUSNS is that it's in a very bullish cup with handle continuation pattern and could reverse higher at any time:
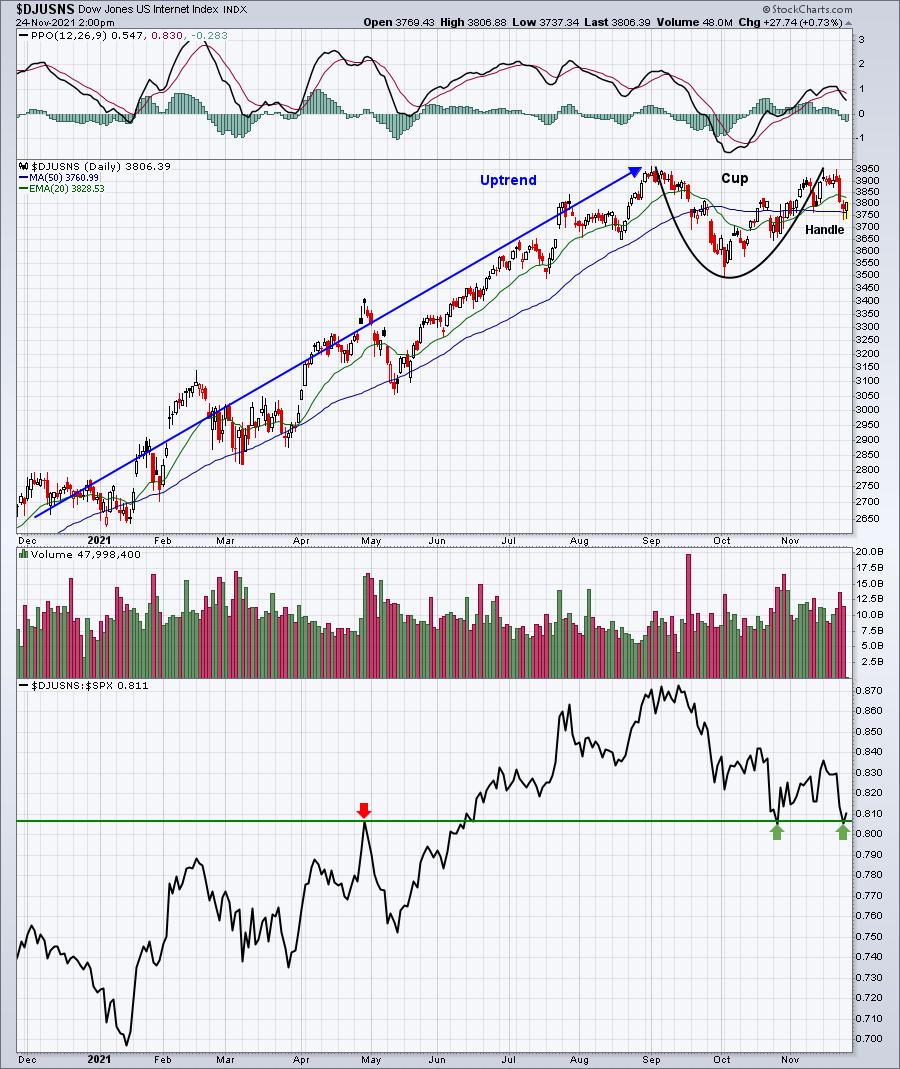
We have a double bottom in place on a relative basis and the handle has moved down to test the 50-day SMA. That could be all the selling we see for now. Therefore, internet stocks in our various ChartLists might be worth considering. I bought Sprout Social (SPT) as a possible reversal candidate this afternoon. It's a volatile and risky trade. If you consider SPT for a long trade, I'd be careful if it were to close beneath 105 short-term.
ChartLists/Strategies
I have a strong preference for trading stocks in our portfolios (which is why they're in these portfolios in the first place). Most are leading stocks in leading industry groups, so if they pull back, I believe it creates excellent reward-to-risk trades for short-term traders. Below are 4 stocks in our portfolios that recently pulled back - likely from profit taking - and could present opportunities for profit in the days and weeks ahead:
M:
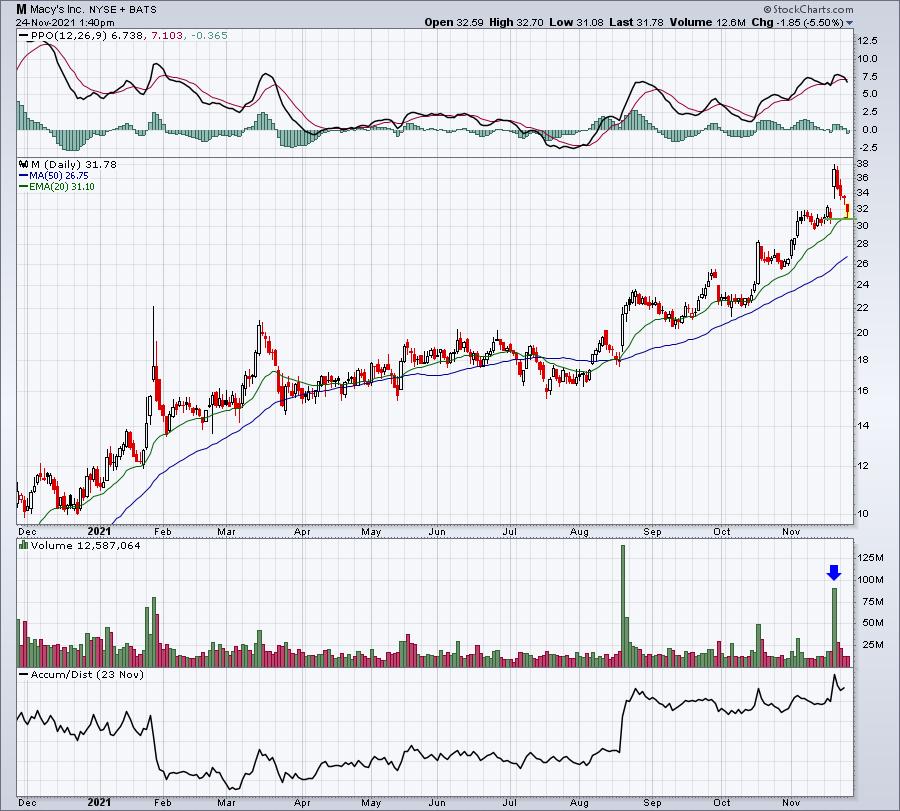
After the huge recent gap higher with excellent quarterly earnings results, M made its way back to test both gap support and its 20-day EMA. There's nothing saying it can't move lower, but it's reward to risk has improved significantly, in my opinion.
ABNB:
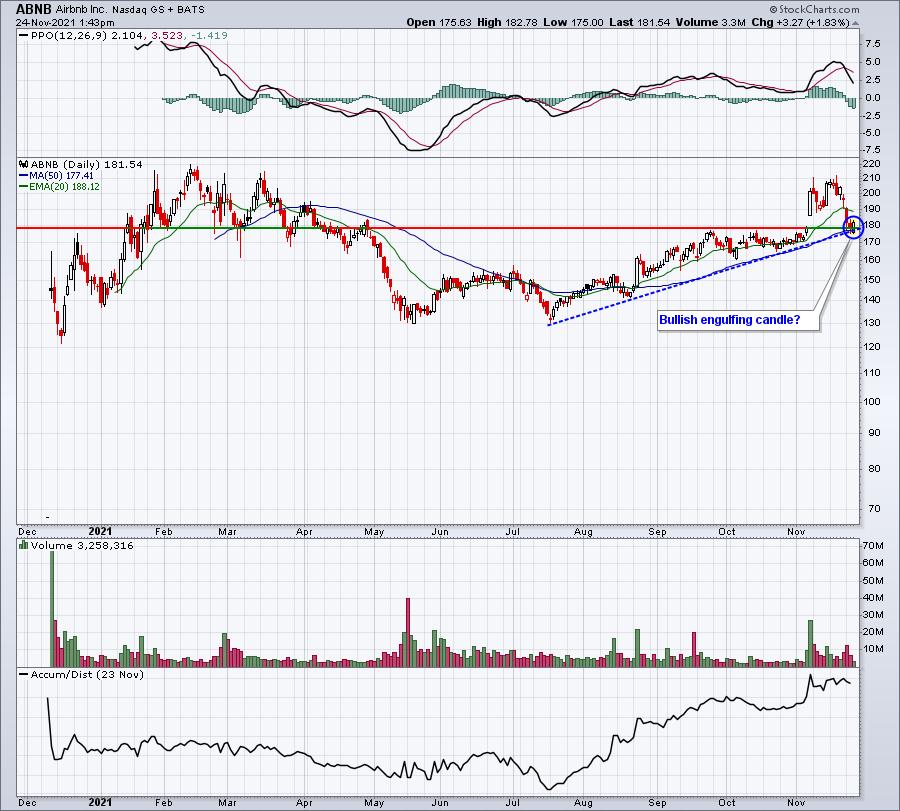
In addition to gap support and 50-day SMA support, ABNB is also trying to reverse (bullish engulfing candle) off of trendline support as well.
LYV:
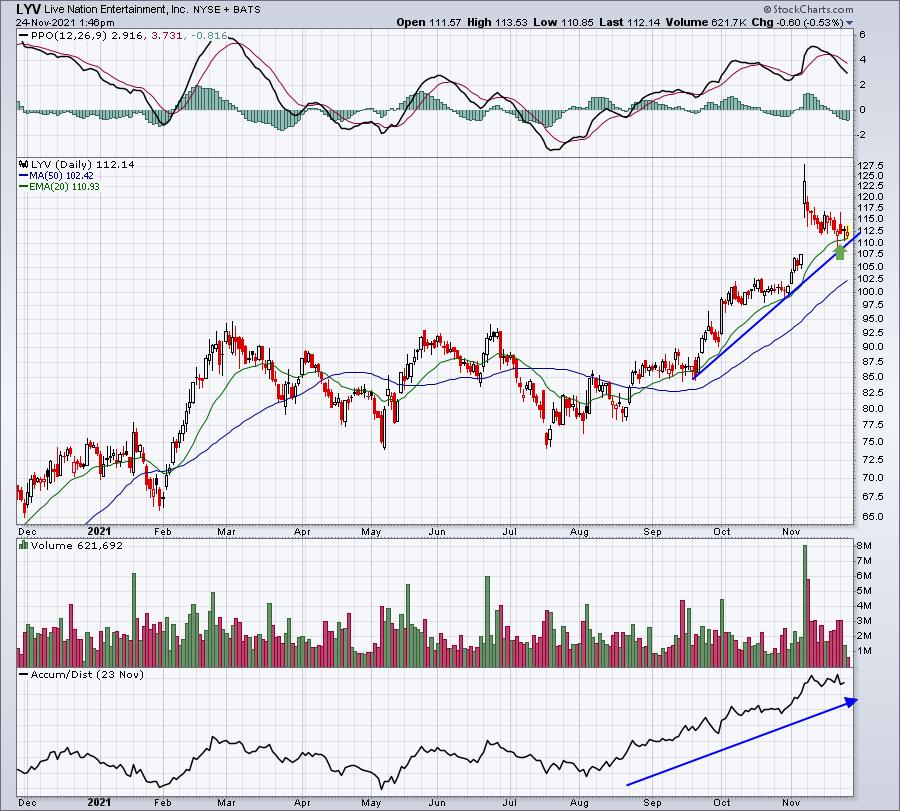
LYV had a very strong reaction to its recent quarterly earnings report. It's now testing its 20-day EMA and short-term trendline support. I wouldn't be surprised to see a 10% move higher to test its earlier price high.
LC:
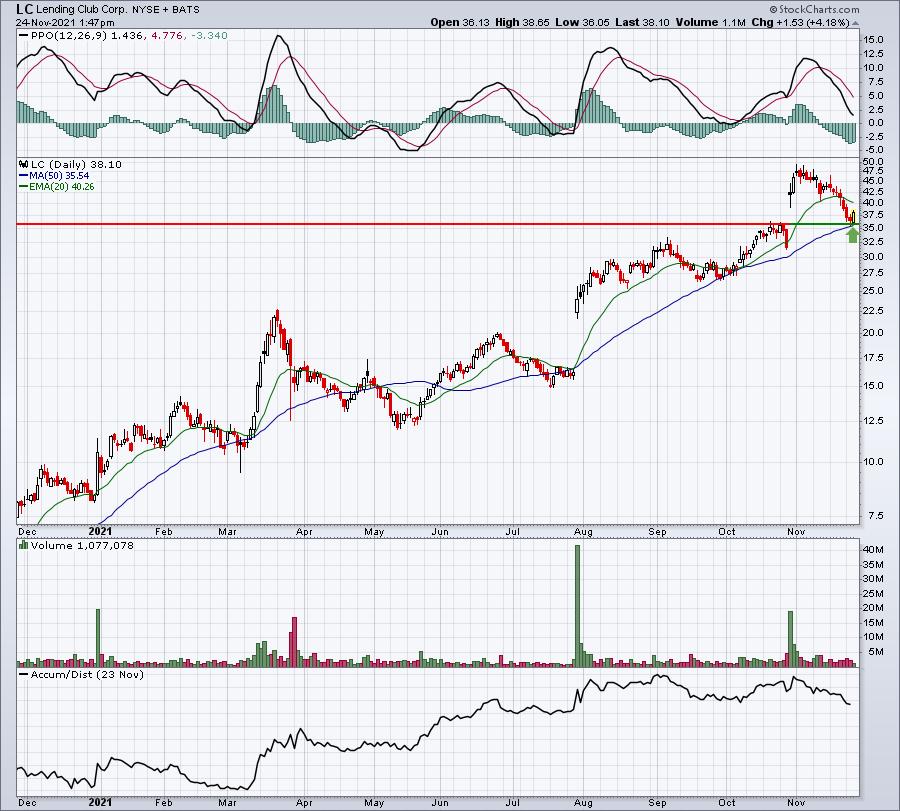
LC also is printing a potential bullish engulfing candle right at key price support. I'd be looking for the recent low to mark a bottom and LC to resume its prior uptrend. We'll see.
There's one other chart that I want to show you as well. Pure Storage (PSTG, +13.23%) has broken out with its quarterly earnings report and I believe this run could just be getting started. I especially like the fact that today's open cleared key opening/closing price resistance after months of consolidation. In my experience, the odds are much better that we'll see a continuing move higher. The rising 20-day EMA (27.88) and today's low (28.78) would be the key support to hold. Here's the chart:
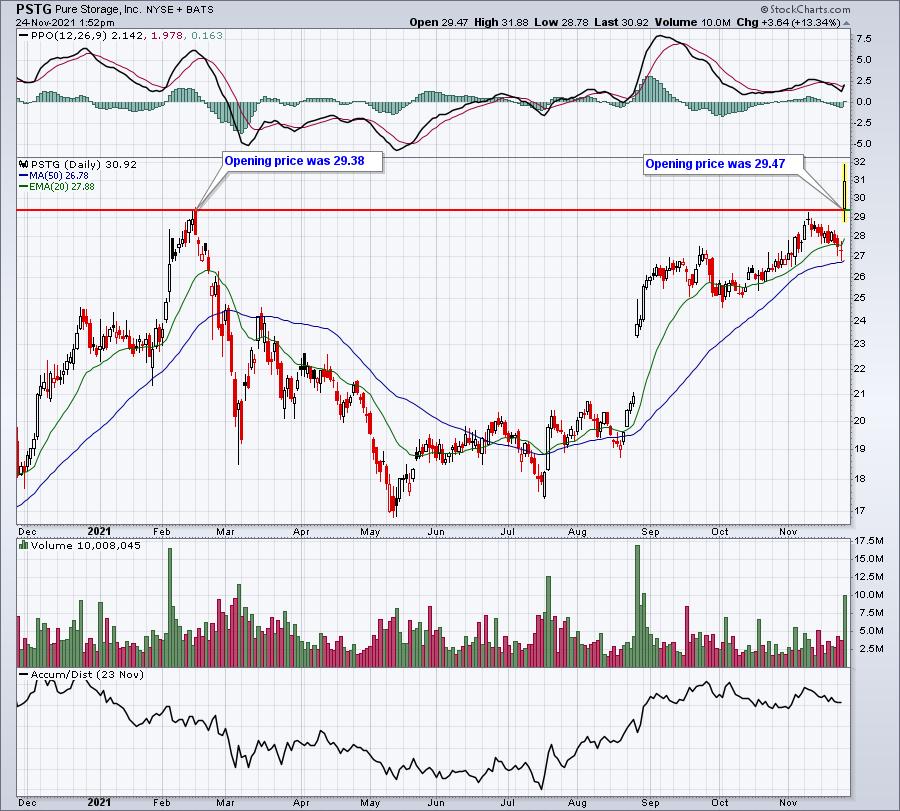
This is the type of chart that would have received heavy consideration for our portfolios had it reported results a week ago. I see it going higher.
(Disclosure: I own M, ABNB, LYV, and PSTG)
Earnings Reports
Here are the key earnings reports for the next two days, featuring stocks with market caps of more than $10 billion. I also include a few select companies with market caps below $10 billion. Finally, any portfolio stocks that will be reporting results are highlighted in BOLD. If you decide to hold a stock into earnings, please understand the significant short-term risk that you are taking. Please be sure to check for earnings dates for any companies you own or are considering owning.
Wednesday, November 24:
DE, KC
Friday, November 26:
PDD
Monday, November 29:
LI
Economic Reports
October durable goods: -0.5% (actual) vs. +0.3% (estimate)
October durable goods ex-transports: +0.5% (actual) vs. +0.5% (estimate)
Q3 GDP (2nd estimate): 2.1% (actual) vs. 2.1% (estimate)
Initial jobless claims: 199,000 (actual) vs. 264,000 (estimate)
October new home sales: 745,000 (actual) vs. 790,000 (estimate)
October personal income: +0.5% (actual) vs. +0.2% (estimate)
October personal spending: +1.3% (actual) vs. +1.0% (estimate)
November consumer sentiment: 67.4 (actual) vs. 66.9 (estimate)
Happy trading!
Tom