
EB Daily Market Report - Wednesday, December 1, 2021
ChartList Updated
I've updated the Short Squeeze ChartList, which is now available on our website. I also completed the "EB Monthly Short Report - December 2021" last night, so you should have received that.
Executive Market Summary
- Futures were higher overnight and then a solid ADP employment report added further bullishness
- Our major indices performed well until around 11:00am ET, at which time sellers took over
- The NASDAQ threatened short-term highs near the 15850 level before a big selloff ensued; the NASDAQ has fallen 400 points from that earlier high
- The U.S. confirmed its first case of the COVID-19 omicron variant in California today, which only seems to be adding to the market's nervousness
- Salesforce.com (CRM, -10.99%) fell hard and is challenging Moderna (MRNA, -10.22%) for the worst performing on the S&P 500; CRM's earnings guidance was disappointing
- Airlines ($DJUSAR, -5.75%) were taking another big hit with the U.S. omicron variant case
- The stock market takes a "sell first, ask questions later" approach when fear is high and today the Volatility Index ($VIX, +4.52%) has reversed higher after being considerably lower this morning
- Defensive sectors are hanging onto strength today with utilities (XLU, +1.16%) and health care (XLV, +0.77%) leading
- Communication services (XLC, -1.51%) is leading to the downside once again - this group cannot catch a bid
Market Outlook
I don't expect to see stock prices remain down for long, but there's really no denying the short-term problems being experienced right now. One of the simplest ways to evaluate uptrend vs. downtrend is to look at price action relative to the 20-day EMA. Here's an example using the S&P 500:
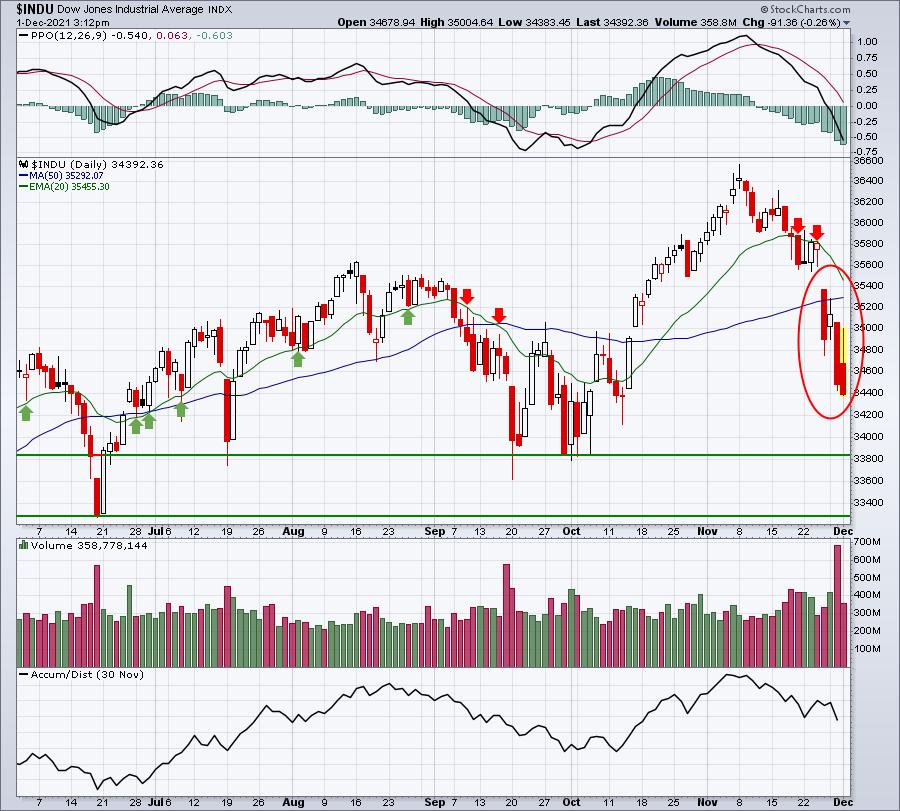
While anything is possible with short-term market behavior, I'd say the odds favor the Dow Jones continuing lower to test those recent levels of price support. That would be another 500-1000 points. From there, we can see if the Dow Jones tries to carve out a bottom.
Sector/Industry Focus
If you recall, the question I raised a couple weeks ago about the current market advance dealt with the rising VIX and rising S&P 500. It's unusual to see both rising at the same time. That positive correlation is likely at the root of the market's current problems. Here's the chart I provided on November 15th, updated through today:
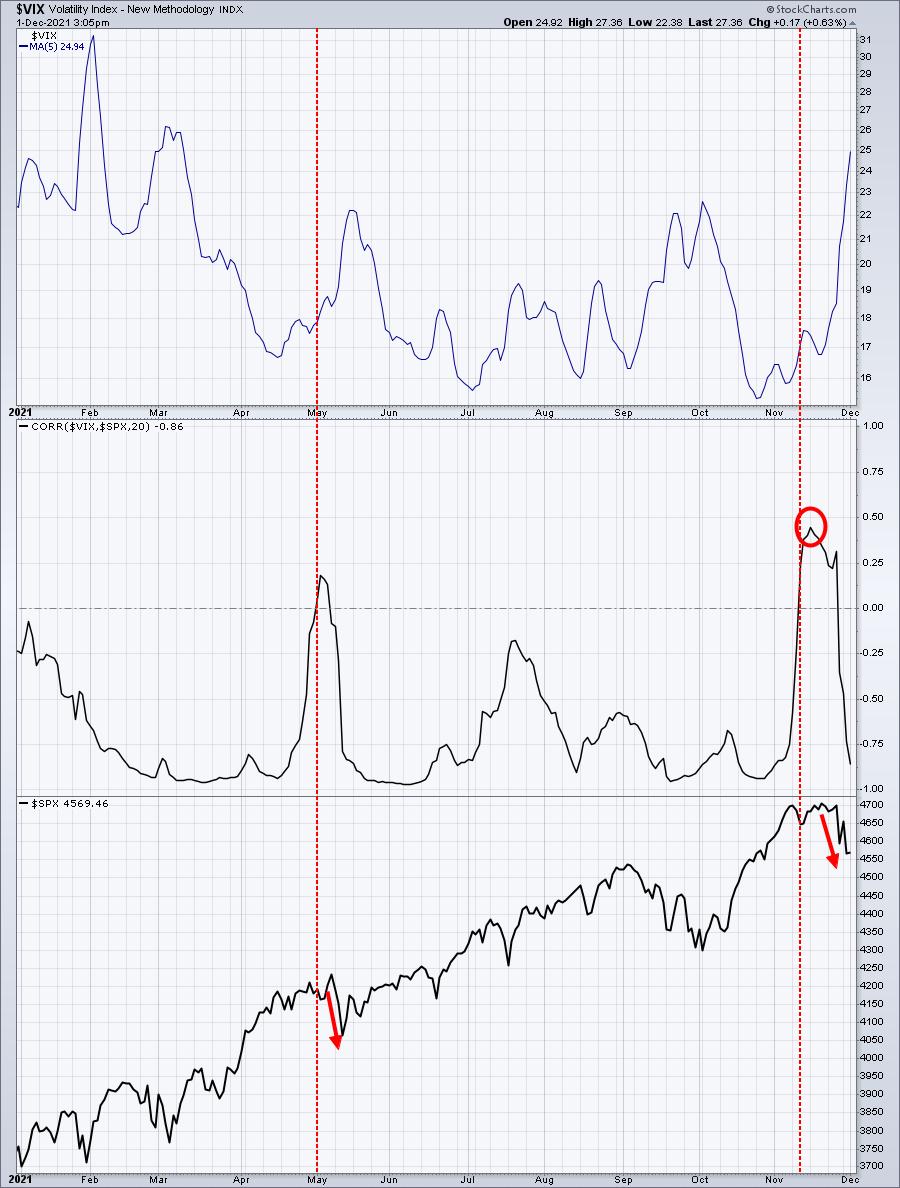
I don't use a signal like this one as a long-term signal. And I definitely wouldn't view this signal as any type of guarantee. However, managing risk is a big part of trading, so taking some sort of defensive measure(s) after seeing this signal makes sense.
ChartLists/Strategies
The Volatility ($VIX) is at a level where trading is simply becoming too risky. A stock looks good at 9:30am and by 2:00pm can't catch a bid. I'd be extremely careful in the short-term. One point I would like to stress is something I bring up from time to time. You've probably heard me talk about it.
When a company reports earnings and the market responds favorably, I like to see a stock clear its prior candle body high at the opening bell. I've seen so many times when there's a big gap higher, if the candle body isn't cleared, the attempted breakout fails. Yesterday, Zscaler (Z) reported excellent quarterly results and gapped up. There was one problem, however. It opened at 371.06. Its prior candle body high was 372.50 on November 19th. While opening higher today by 25 bucks seemed to be perhaps the start of another big run, instead it was the start of a major failure:
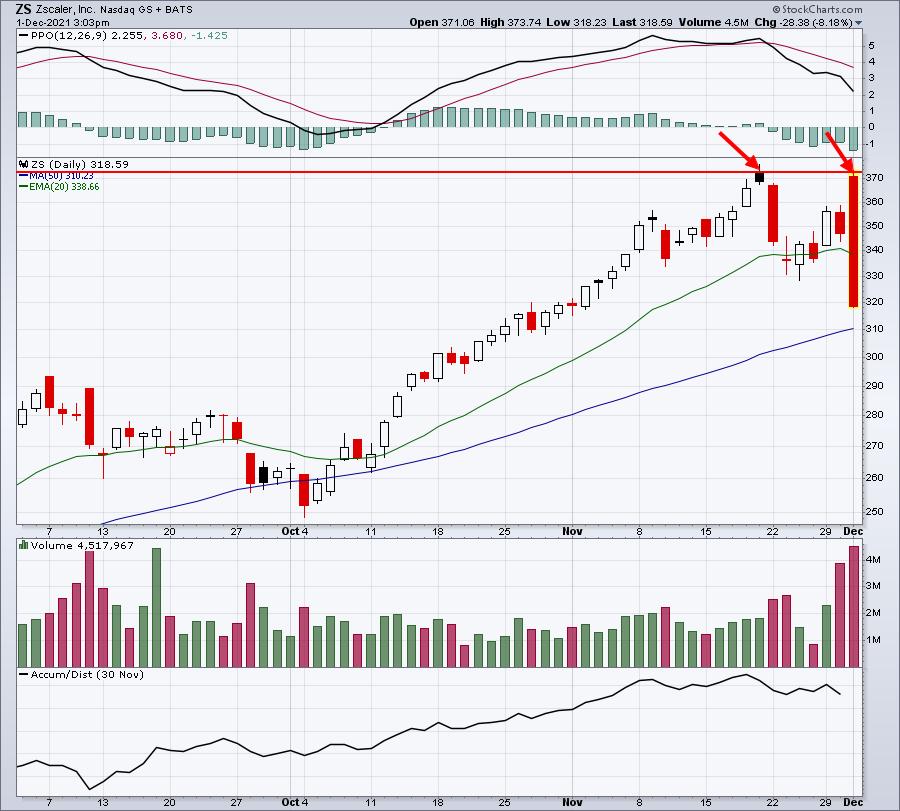
I'm not suggesting that when a stock opens just below a key candle body that we'll see a major selloff, but I do believe it helps to clue us in on the next potential move, which I'd believe to be lower. Therefore, if I held a stock into its earnings report and I saw a similar gap open, I'd just take the money and run.
Earnings Reports
Here are the key earnings reports for the next two days, featuring stocks with market caps of more than $10 billion. I also include a few select companies with market caps below $10 billion. Finally, any portfolio stocks that will be reporting results are highlighted in BOLD. If you decide to hold a stock into earnings, please understand the significant short-term risk that you are taking. Please be sure to check for earnings dates for any companies you own or are considering owning.
Wednesday, December 1:
RY, SNOW, CRWD, SNPS, VEEV, OKTA, SPLK, ESTC, FIVE, PVH, DCI, DSGX, DOOO, SMTC, AI, PDCO, ZUO, GIII
Thursday, December 2:
TD, MRVL, DG, DOCU, KR, ULTA, ASAN, COO, GWRE, SMAR, SIG, OLLI, VRNT, DOMO, MEI, SCWX, ZUMZ
Economic Reports
November ADP employment report: 534,000 (actual) vs. 525,000 (estimate)
November PMI manufacturing: 58.3 (actual) vs. 59.1 (estimate)
November ISM manufacturing: 61.1 (actual) vs. 61.1 (estimate)
October construction spending: +0.2% (actual) vs. -0.1% (estimate)
Happy trading!
Tom