
EB Daily Market Report - Monday, December 13, 2021
ChartLists Updated
Both the Strong Earnings ChartList (SECL) and Strong Future Earnings ChartList (SFECL) have been updated on our website. You can view the ChartLists or download them into your StockCharts.com account, if you're an Extra or Pro member there.
Executive Market Summary
- Futures were mostly higher overnight, but turned negative into the open
- There continues to be a risk-off mentality
- Cryptocurrencies are under pressure as etherium ($ETHUSD, -9.32%) and bitcoin ($BTCUSD, -6.81%) fall
- Commodities are mostly higher, though crude oil ($WTIC, -0.39%) is an exception
- The 10-year treasury yield ($TNX) is down 6 basis points to 1.43%, yet it's having little positive impact on growth stocks
- As the TNX has been dropping, so too has growth vs. value ($DJUSGS:$DJUSVS)
- All four defensive groups are higher by 1% or more, while all other sectors are in negative territory
- Consumer discretionary (XLY, -2.41%) is the weakest, led lower by automobiles ($DJUSAU, -5.28%)
- General Motors (GM, -5.77%) and Tesla (TSLA, -5.65%) are the two worst performers on the S&P 500
Market Outlook
If we look at a 60-minute chart for the S&P 500, NASDAQ 100, and S&P 600 Small Cap Index, I think you'll see that the riskier and investment is, the worse it's been performing. Check this out:
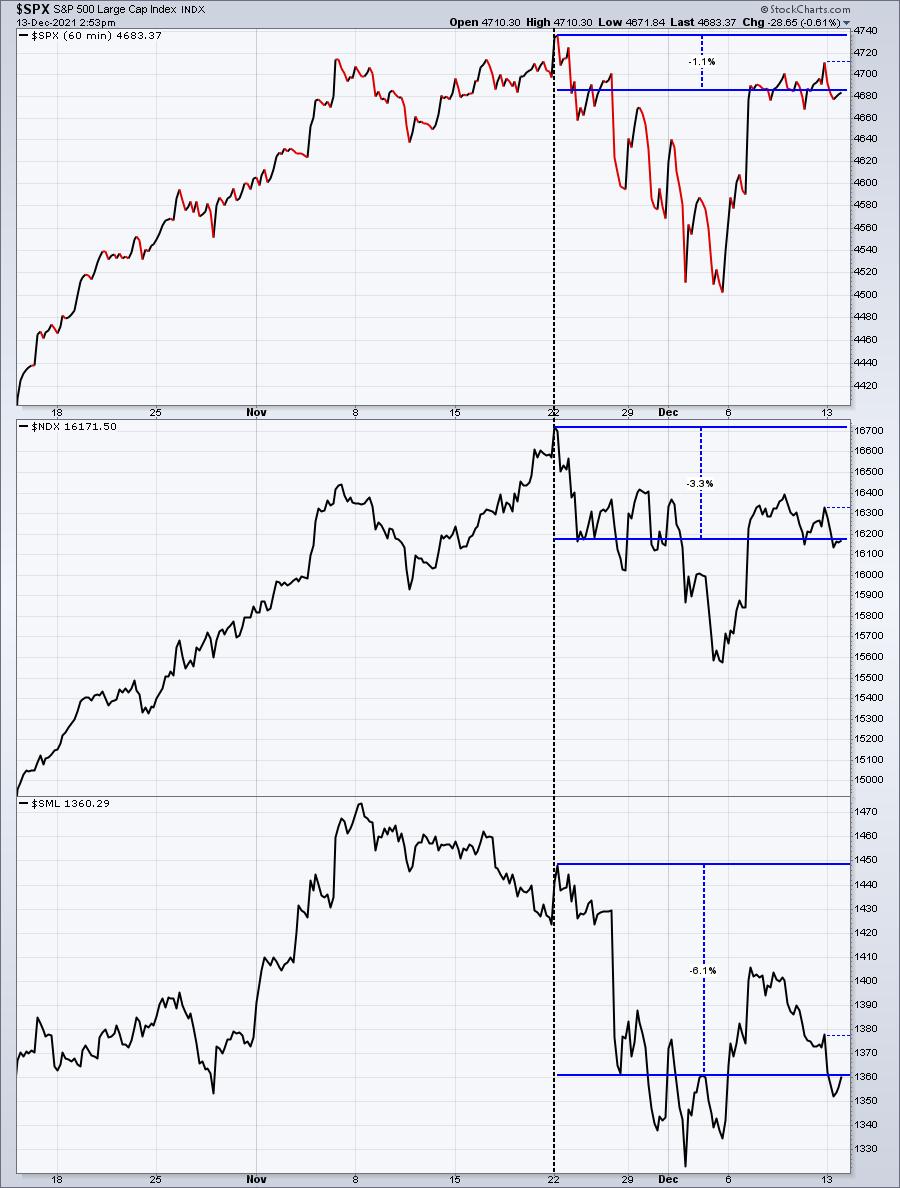
We started to see some deterioration in the $SML prior to November 22nd, but the purpose of this analysis is simply to look at the rotation that's taken place over the past three weeks. It's fairly dramatic.
Sector/Industry Focus
Real estate (XLRE) is leading today's action. The reason is fairly simple. There is most definitely a "risk-off" market environment, which is favoring defensive equities and the bond market. Real estate broke to a new all-time high last week and today it's carrying over:
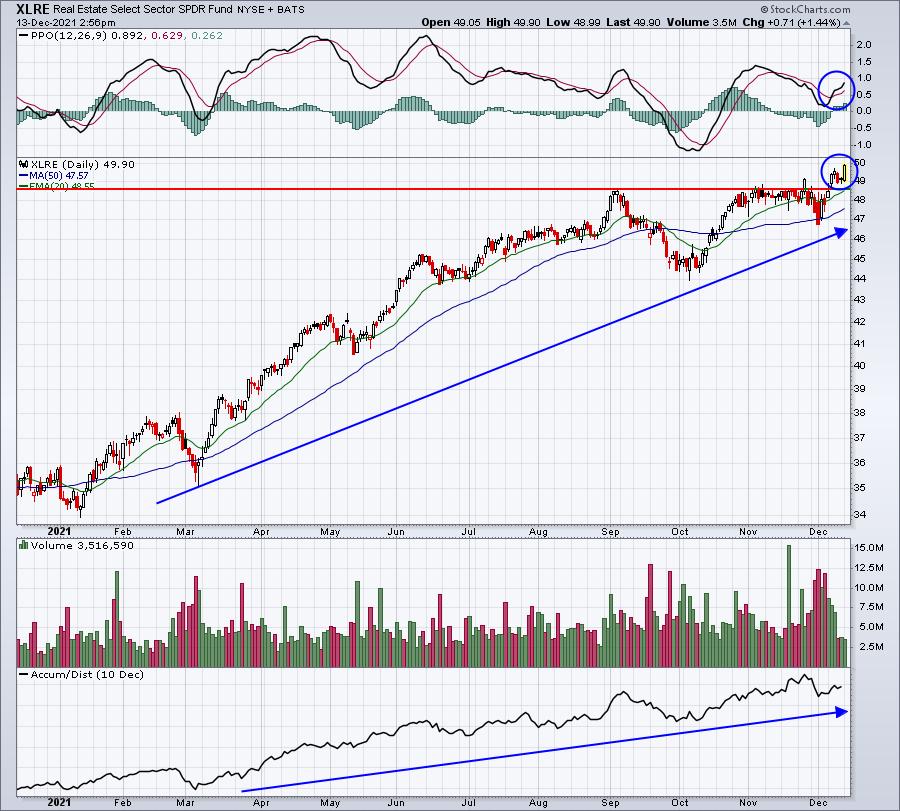
Real estate looks very strong technically right now. There's another fact that you should be aware of as well. We're in a sweet spot seasonally for real estate. The XLRE performs strongly vs. the S&P 500 during both December and January. Take a look:
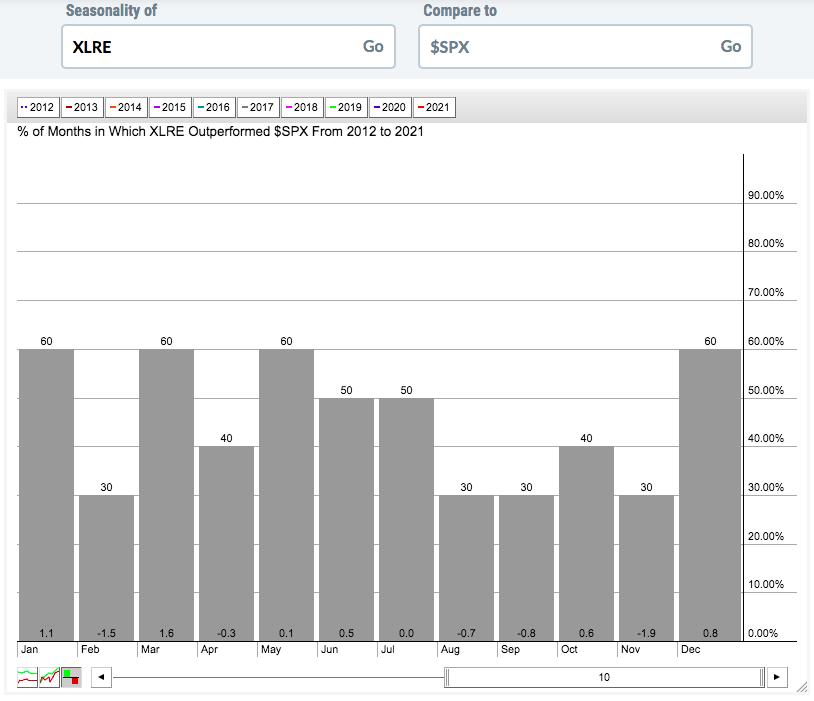
At the bottom of the gray bars, you can see that the XLRE has outperformed the S&P 500 by 0.8% and 1.1% during December and January, respectively, over the past decade. There are no other two consecutive calendar months where the XLRE outperforms more. Therefore, it would be wise to respect this move.
ChartLists/Strategies
Real estate is performing well and I had mentioned ACC last Thursday as a potential way to avoid some of the risk in the market. ACC is up nearly 2% today, attempting to break to another all-time high. I reviewed our ChartLists, searching for additional real estate candidates. Here were two:
AHH:
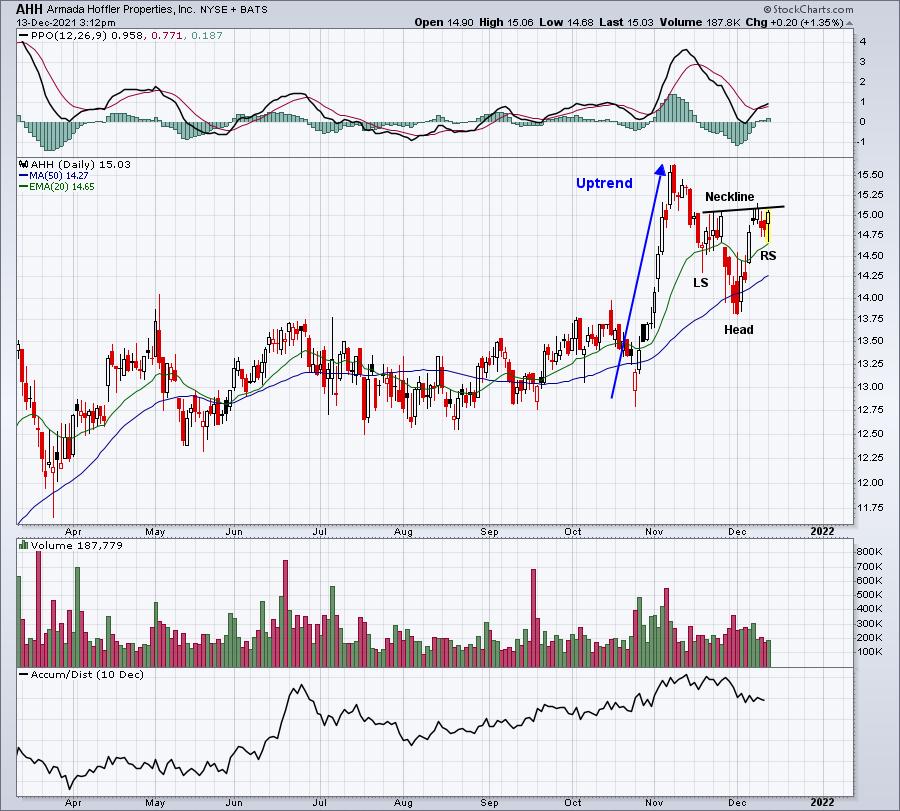
I like the bullish inverse head & shoulders continuation pattern setting up here. That right shoulder may have been established on today's 20-day EMA test. A breakout above 15.10 would measure to approximately 16.40-16.50.
AMT:
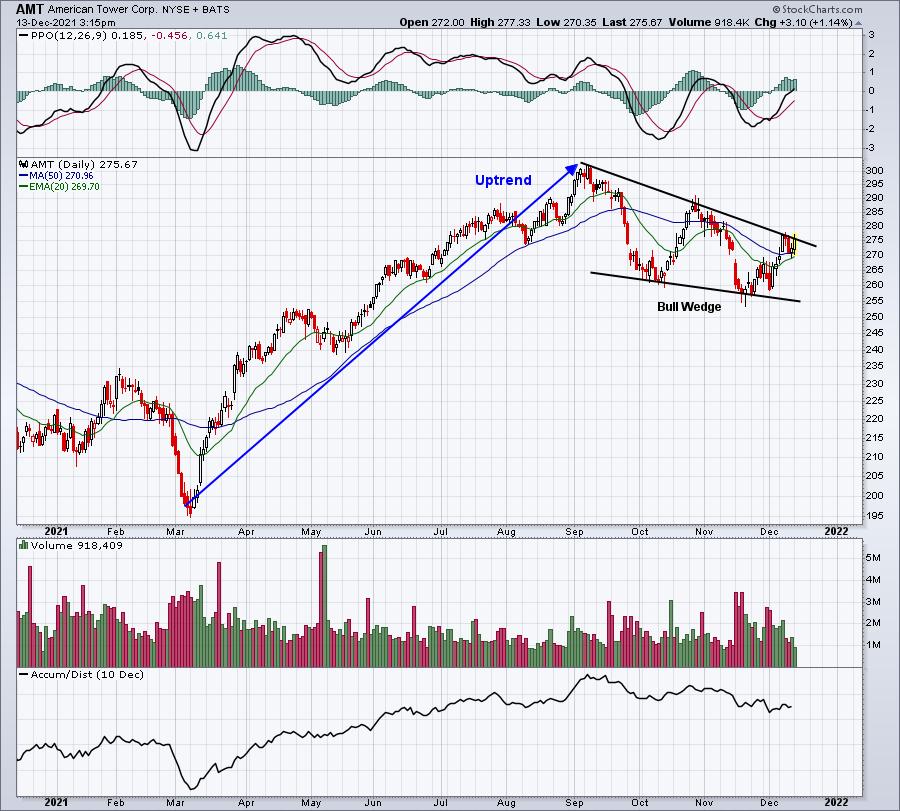
It only takes a bit more strength for AMT to potentially break out of its current bull wedge pattern. These tend to resolve to the upside, given the renewed strength in real estate, I'd expect to see it here.
Earnings Reports
Here are the key earnings reports for the next two days, featuring stocks with market caps of more than $10 billion. I also include a few select companies with market caps below $10 billion. Finally, any portfolio stocks that will be reporting results are highlighted in BOLD. If you decide to hold a stock into earnings, please understand the significant short-term risk that you are taking. Please be sure to check for earnings dates for any companies you own or are considering owning.
Monday, December 13:
None
Tuesday, December 14:
None
Economic Reports
None
Happy trading!
Tom