
EB Daily Market Report - Tuesday, December 14, 2021
December Max Pain Event
Last month, November max pain didn't work out particularly well, and I'll discuss those results tonight, but December is a new month. Whether these max-pain-related trades work out or not isn't the biggest takeaway from these events - at least in my opinion. More important is simply having the knowledge to make a more informed trading decision. Personally, I use max pain data to sometimes avoid making a trade, rather than making one.
Today's max pain event will start promptly at 4:30pm ET and the room will open at 4:00pm ET. If you're unable to make it, no worries as we'll be sure to record the event.
Executive Market Summary
- Futures were mostly lower this morning, recovered briefly after the open, and then selling has accelerated
- Financials (XLF, +0.47%) are showing leadership today as banks ($DJUSBK, +1.25%) and life insurance companies ($DJUSIL, +1.32%) benefit from rising treasury yields
- The 10-year treasury yield ($TNX) is up 2 basis points to 1.45% after another hot inflation report
- The November PPI rose 0.8%, much higher than the 0.5% increase expected; the year over year headline rate ballooned to 9.6%, while the core rate shows a 7.7% annual rate (chart provided below)
- There is clearly an advantage today in value stocks relative to growth stocks (charts provided below)
- Despite the hot inflation data, gold ($GOLD, -0.85%), an inflation hedge, is losing ground
- Other commodities are following suit, including crude oil ($WTIC, -1.36%), which is nearing $70 per barrel
- Technology (XLK, -2.33%) is today's worst performing sector, led by very weak software ($DJUSSW, -3.90%) and renewable energy ($DWCREE, -3.82%) stocks
Market Outlook
Inflation. The headlines continue to tell us that we've got big problems and the Fed started its latest 2-day meeting today. Many are calling for interest rate hikes sooner rather than later to combat the inflationary pressures. If you recall, the Fed spent years trying to inflate our economy. It's somewhat ironic that now so many market participants see inflation as a big threat. I still don't see it, but the market couldn't care less about what I see or don't see. I'm convinced that we'll see inflation begin to fall very quickly in the middle of 2022. If I'm right, then we'll see Wall Street respond by buying growth stocks LONG before inflation data calms down.
But I'm getting way ahead of myself. There's no doubt that RIGHT NOW, inflation is on the minds of many and growth stocks at every level are suffering. The following is a 3-year relative chart of growth vs. value among large caps, mid caps, and small caps:
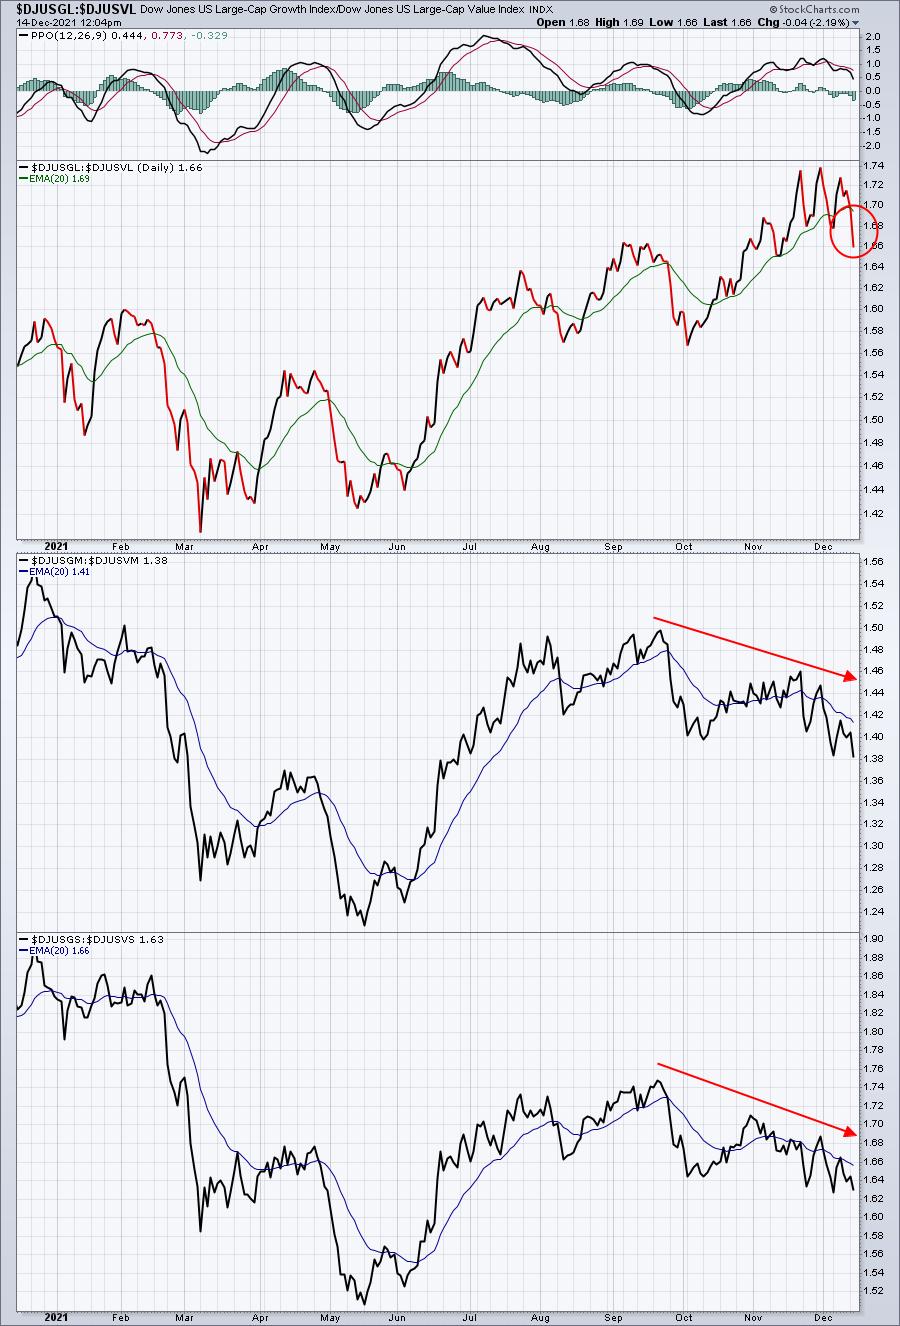
Mid cap and small cap growth stocks have been under selling pressure for quite awhile, but large cap growth is just beginning to see weakness. As long as inflation worries are at the forefront, Wall Street will use the opportunity buy these growth stocks cheaper and cheaper. On the above chart, you can see that when the initial wave of inflation worries ended in May 2021, these growth names exploded higher on a relative basis. I see that type of moving coming again, but the question is.....how much more pain will these stocks have to endure before that type of relative rally begins?
Well, let's see how these stocks react to the Fed meeting. We'll get the latest policy statement tomorrow at 2:00pm. And with options expiring on Friday, things could get very, very interesting this week and into next.
Sector/Industry Focus
Let's take a look at the monthly Core PPI chart over the past several decades, highlighting the 12-month rate of change (ROC):
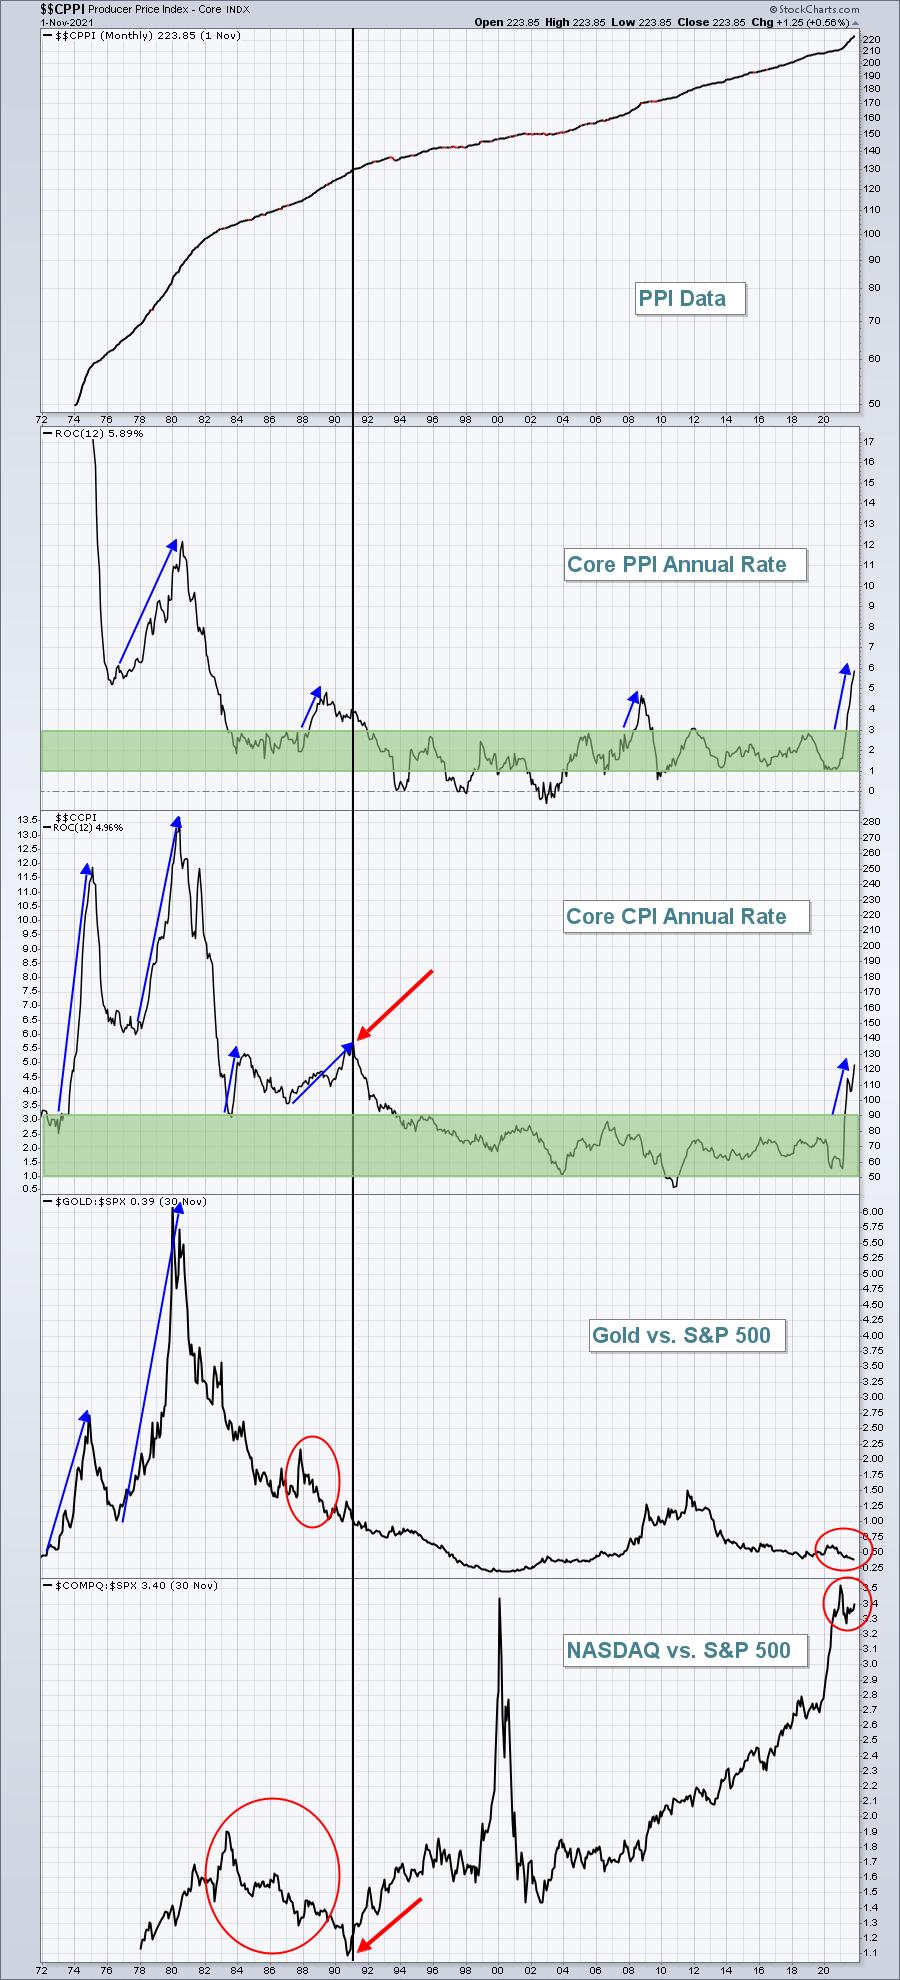
We haven't really had an inflation problem since the 1970s. That was part of the secular bear market that ran from roughly 1969 through 1981. The big scares since that time (12-month ROC rises above the 1-3% green-shaded range) were in the late 1980s, 2008, and currently. In 2008, the Core PPI accelerated, but businesses chose not to pass it on to consumers as the Core CPI remained in that target area close to 2%. Now we're dealing with it again. We had ZERO signs of inflation prior to the pandemic, which is why I believe it's a temporary pandemic-inflicted surge. I want you to focus on the bottom panel, the NASDAQ vs. the S&P 500, in the early 1990s. That's when inflation topped. Do you see the subsequent rally in NASDAQ shares? That's what happens when we begin to see the top in an inflationary period. Everyone will gravitate towards the more growth-oriented stocks. The fact that gold is not budging higher vs. the S&P 500 tells me that this inflation scare is more short-term in nature. When we see the first evidence of inflation topping and moving back down, I believe we'll see an EXPLOSIVE move higher in growth stocks that will carry stock prices much higher.
But that leaves us with dealing with the short-term. I don't have the answer as to when growth stocks could carve out a relative bottom vs. value stocks. But they've been mostly downtrending in 2021 and I do believe we'll see a relative bottom and reversal. That relative bottom, however, may be in 2022. Let's see what the Fed says and how the market reacts and go from there.
ChartLists/Strategies
Trading ahead of the Fed meeting is incredibly risky. I expect that they'll acknowledge that inflation is hanging around longer than expected and likely speed up their tapering of bond purchases. I would also expect at least a brief relief rally in areas that have been hit hard the past several weeks, including many growth names. I'll be discussing some of those names later today in our Max Pain event. I wrote an article about max pain earlier in my Trading Places blog, featuring the advance that Zoom Video Communications (ZM) made in October. ZM is setting up once again for a possible surge into options expiration as there are a TON of net in-the-money puts.
These types of max pain trades should be considered aggressive and are most definitely not for everyone. Be sure you're comfortable with the much higher risk involved before trading.
Earnings Reports
Here are the key earnings reports for the next two days, featuring stocks with market caps of more than $10 billion. I also include a few select companies with market caps below $10 billion. Finally, any portfolio stocks that will be reporting results are highlighted in BOLD. If you decide to hold a stock into earnings, please understand the significant short-term risk that you are taking. Please be sure to check for earnings dates for any companies you own or are considering owning.
Tuesday, December 14:
None
Wednesday, December 15:
LEN, HEI, NDSN, TCOM, TTC, JOBS, ABM
Economic Reports
November PPI: +0.8% (actual) vs. +0.5% (estimate)
November Core PPI: +0.7% (actual) vs. +0.4% (estimate)
Happy trading!
Tom