
EB Daily Market Report - Wednesday, January 5, 2022
Market Vision 2022
Our annual Market Vision event will be held this Saturday, January 8th, beginning at 8:45am ET. There is NO COST to EB.com subscribers. In fact, we are not even offering the event to non-members. This is exclusive EarningsBeats.com content and we're happy to provide it as yet another benefit of being a loyal EarningsBeats.com member. So thank you!
We'll be sending out room instructions later this week. If you cannot attend on Saturday, no worries. We'll record the event and make it available for all EB.com members so that you can enjoy it at your convenience.
Executive Market Summary
- Futures were slightly lower overnight, with relative weakness in NASDAQ shares
- That relative weakness has continued as the NASDAQ was lower by 1.32% at last check; the Dow Jones, by comparison, was higher by .25%, so the Great Divide continues
- Leadership is coming from materials (XLB, +1.57%) and energy (XLE, +1.46%) as the dollar (UUP, -0.42%) pulls back
- The 10-year treasury yield ($TNX) is up 1 basis point after a very strong ADP employment report this morning
- Weakness is seen primarily in real estate (XLRE, -1.76%) and technology (XLK, -1.28%); software ($DJUSSW, -2.82%) is breaking down - see Sector/Industry Focus below
- Renewable energy ($DWCREE, -3.47%) is also very weak on today's session
- Steel ($DJUSST, +5.78%) and aluminum ($DJUSAL, +4.37%), two winners from 2021, are leading the charge higher in materials stocks
- Crude oil ($WTIC, +1.79%) has surged above $78 per barrel, lifting energy stocks
Market Outlook
The NASDAQ has clearly been the weakest performer, while the S&P 500 remains the best relative performer. That could change if a few of the large cap tech names helping to hold up the S&P 500 see further selling. Here's an hourly chart of the S&P 500 and NASDAQ over the past two months so you can see the "great divide" that I've recently been referring to:
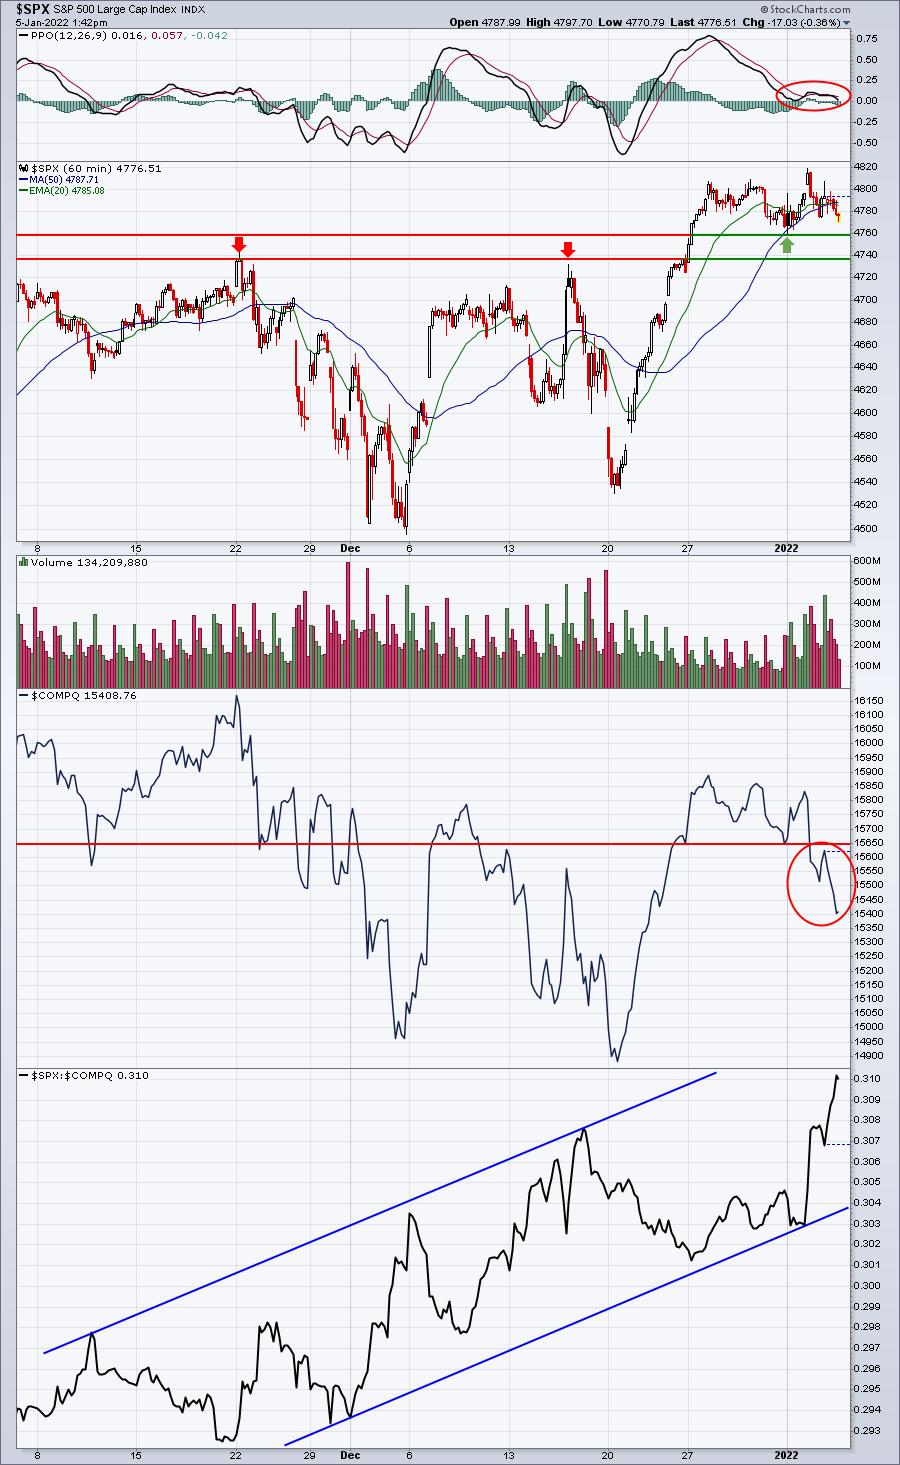
The NASDAQ is at a 2-month low right now, while the S&P 500 remains in sideways consolidation, not far from its all-time high. Something has to give. I believe we could see selling really begin to accelerate if the S&P 500 loses its support range from 4735-4760. Watch that area closely.
While the S&P 500 bounced to an all-time high above 4800 recently, the PPO barely budged to the upside and is currently hovering at the centerline. If the S&P 500 loses support and that PPO turns negative, a downtrend could begin and send the S&P 500 much lower.
It's certainly possible that the stock market ignores all of the current warning signs and simply moves higher. That is a real possibility. However, when I see this many warning signs, I take no chances. Everything I'm talking about is from a short- to intermediate-term time frame. I remain VERY bullish U.S. equities long-term, but we could see short-term obstacles develop, leading to higher volatility and lower prices.
Sector/Industry Focus
Software ($DJUSSW) is a real drag on technology right now. First, it's important to know that software historically isn't a big fan of the January-February time frame. Check out this seasonality chart covering the past two decades:
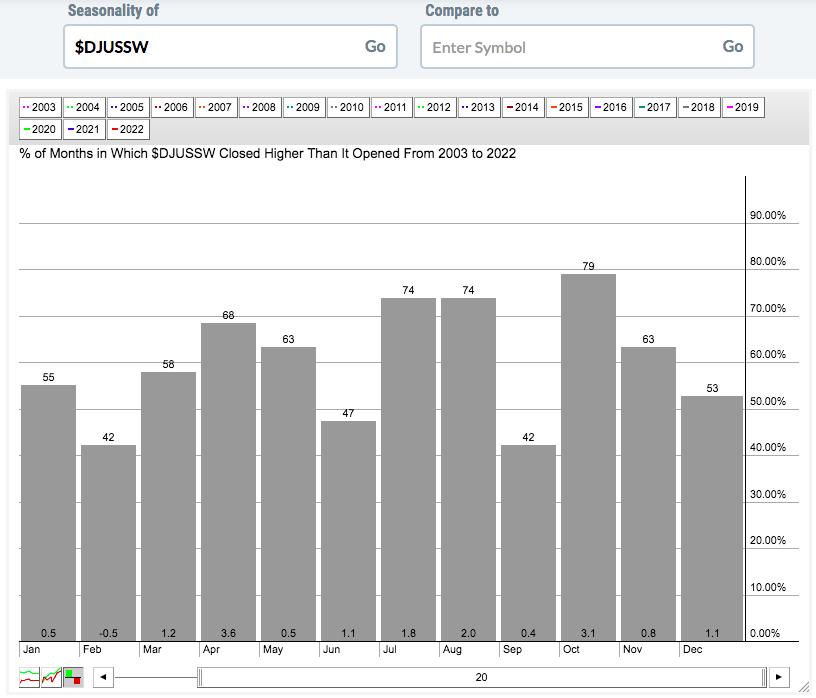
If you add the average returns for January and February together, they net to ZERO. In other words, software has done absolutely nothing during the first two calendar months of the year since 2001. If we're looking for technical conditions to save the group, we're very likely to be disappointed. I'm seeing another breakdown in software:
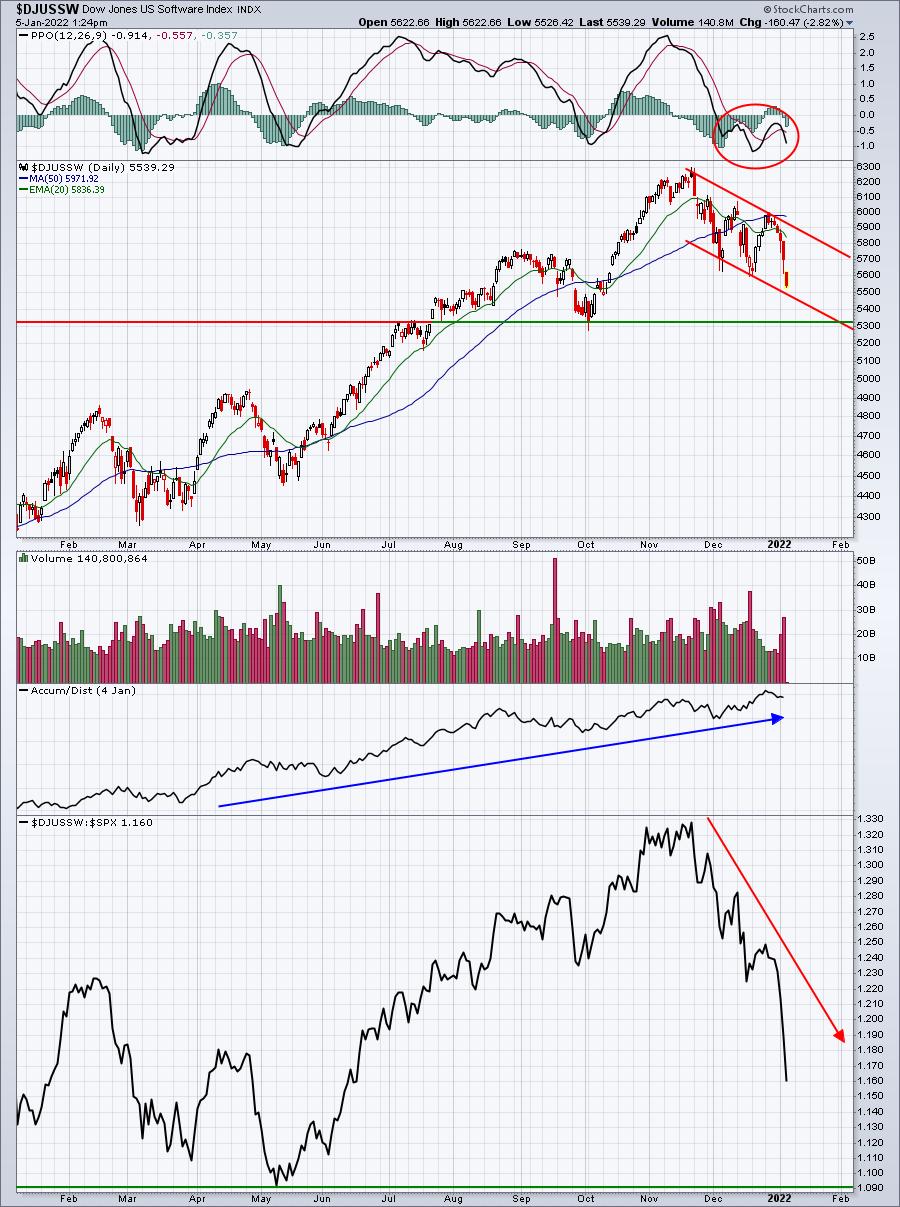
The bottom panel shows how poorly software has been performing relative to the S&P 500. I see a down channel in play probably for the next month or two, with a possible retest of support near 5300. If we hold price support there, then this is likely just a short-term issue for the overall market. However, if we decisively break below 5300, then I see much more carnage in the group based on this weekly chart:
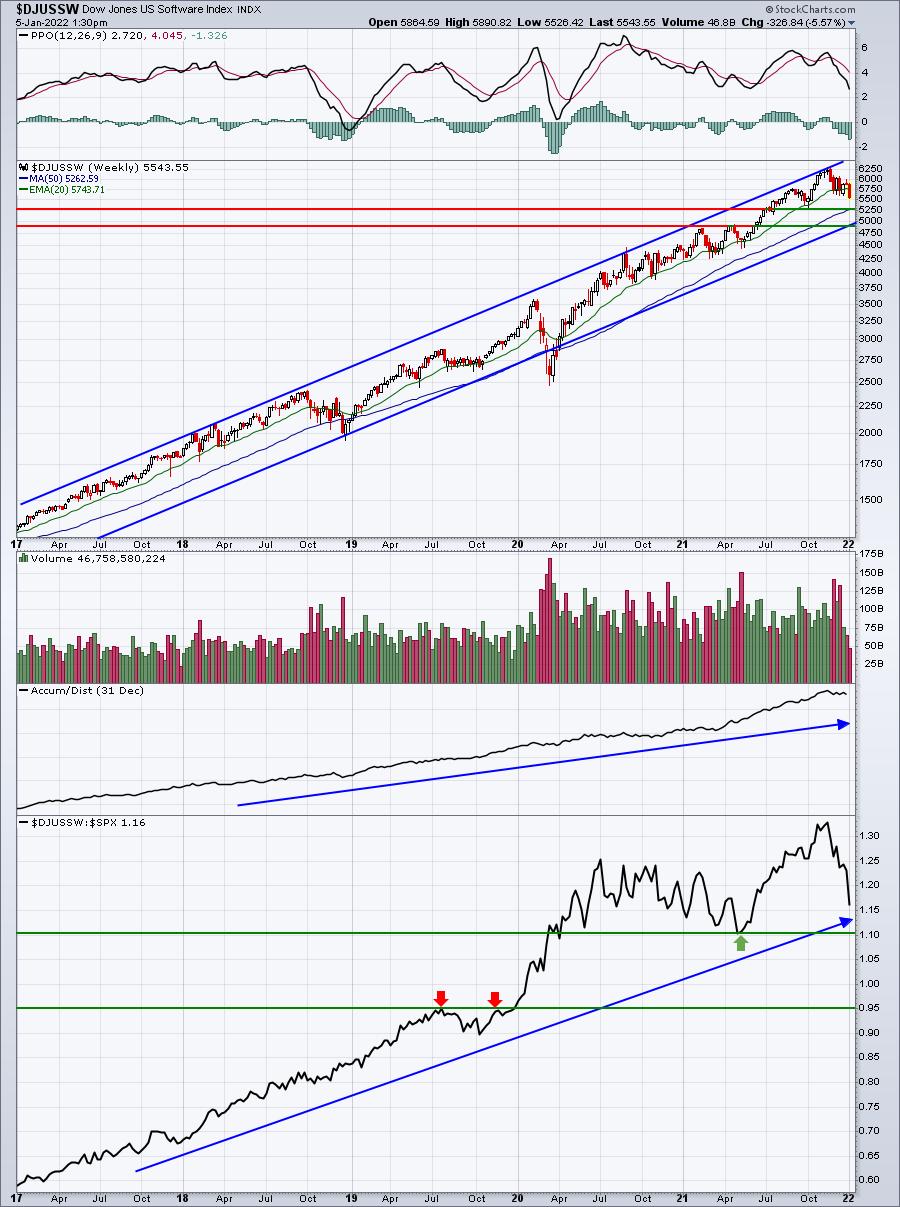
5300 would be a 50-week SMA test, which is really no big deal. If we break below that, though, I could see a move back to 4900 or so to test what I consider to be current channel support. I didn't draw the line from the March 2020 low as I feel the pandemic created an unrealistic selloff, so I'd be more inclined to use the trade war low in late 2018.
There is good news on both of these charts. The AD line on both the daily and weekly charts suggest accumulation is taking place on Wall Street. I don't see anything on this chart that makes me think software will trend lower for more than a few weeks to a few months. And once a bottom occurs, I fully expect an EXPLOSIVE rally back to the upside.
ChartLists/Strategies
As I've been writing and discussing recently, stick with value/defensive stocks for now on the long side. I'm not a big fan of trading those, but if I were to trade anything, that's what I'd trade. If I trade growth stocks, I'd keep very tight stops in play. Either I'd make money right away or I'd get stopped out. Seriously, I'm taking very little risk right now.
For those wondering about the portfolios, keep in mind we view them as "buy and hold". While my short-term view is bearish on growth stocks, which includes many of these portfolio stocks, we don't make changes to our portfolios intra-quarter. We also don't use stops. For transparency purposes, we will hold through February 19th, which is when we'll reassess the market and select 10 equal-weighted stocks for each portfolio. EB.com members may do whatever they wish with the portfolios. They can buy them, sell them, trade them, whatever is most appropriate for each individual. These portfolios are very heavily concentrated in growth stocks will not perform well when growth stock investing is out of favor. When growth stocks are in favor, I'd expect the portfolios to perform exceptionally well.
Looking at potential value-oriented trades, I ran a scan of 20-day EMA tests (pullback scan) among energy, materials, financials, industrials, staples, and real estate from our Strong Earnings ChartList (SECL). Here was the scan syntax used:
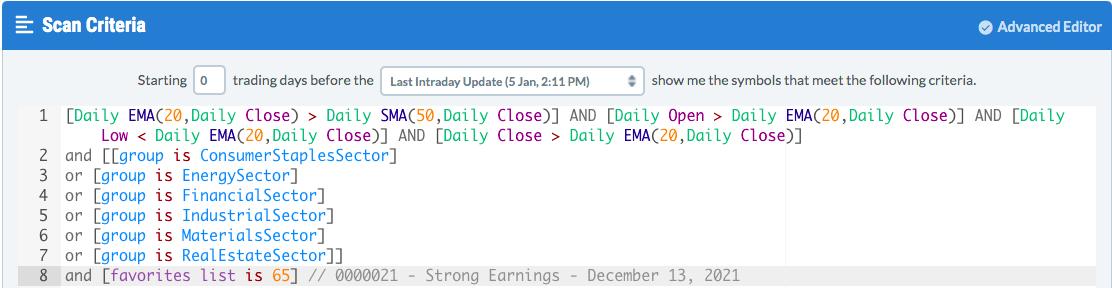
Here were the 4 stocks returned:

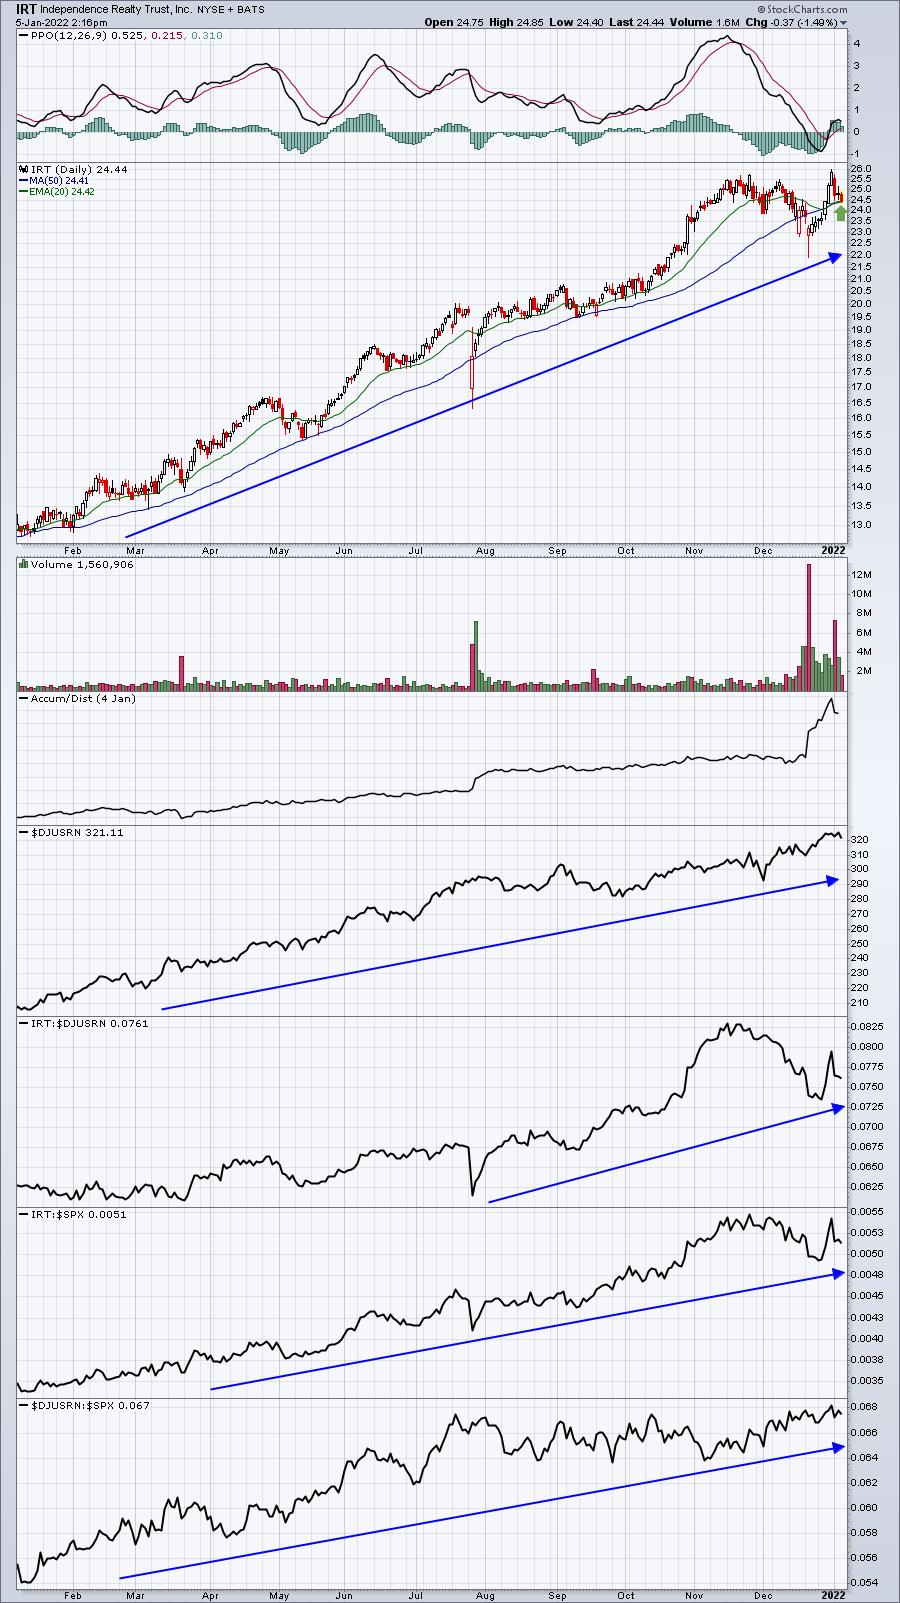
IRT and PSA looked interesting to me.
IRT:
PSA:
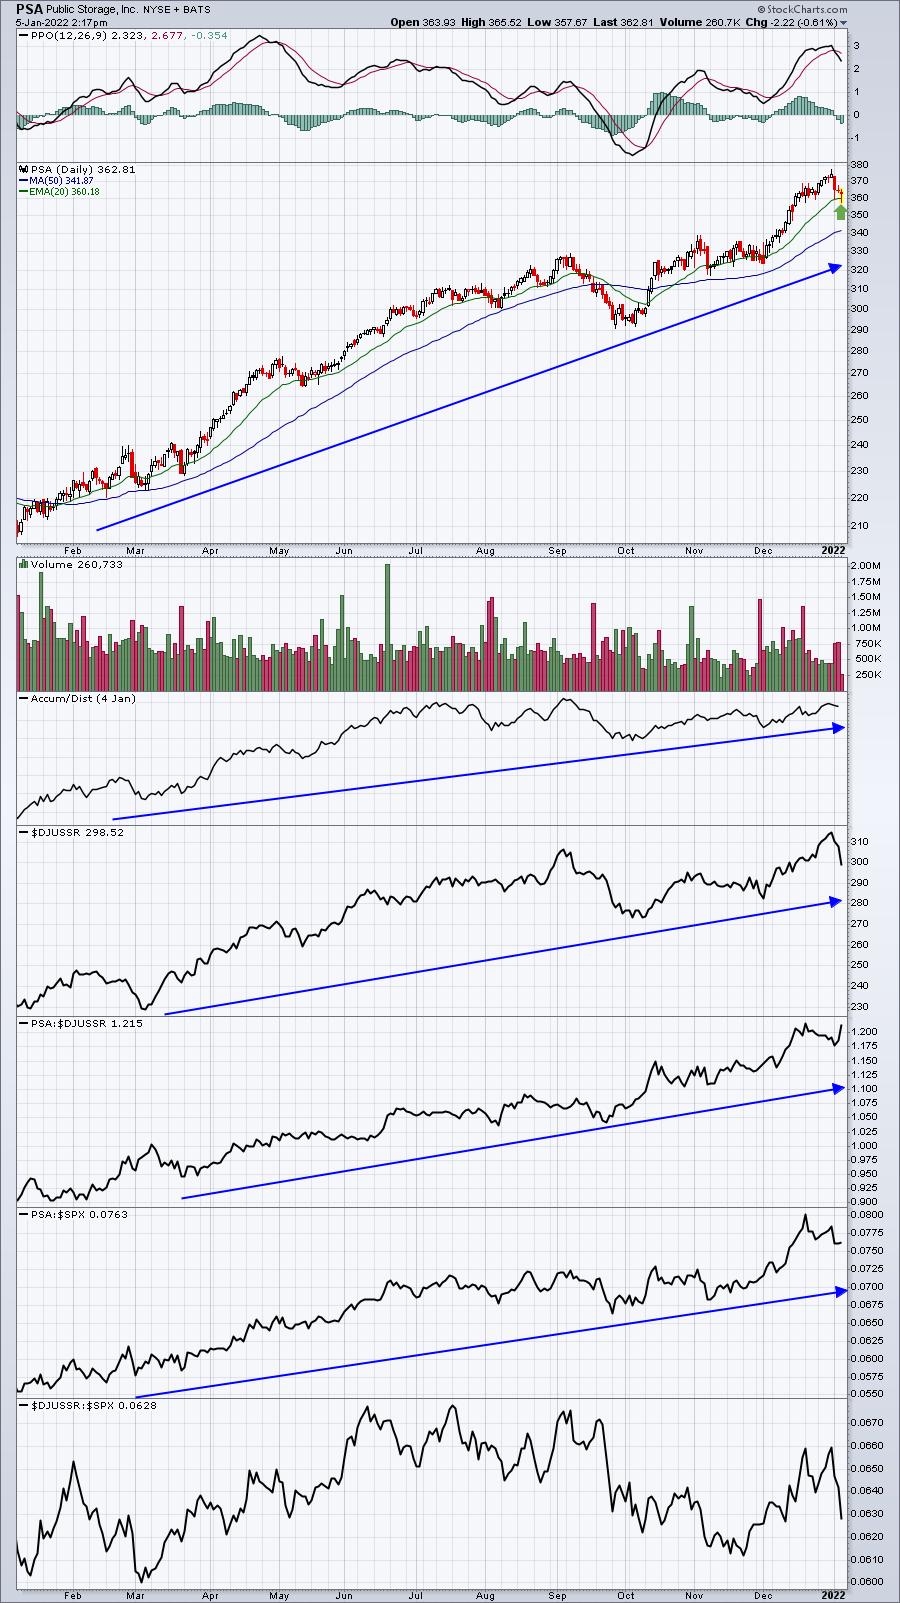
Both of these stocks are testing their respective 20-day EMA in a rising uptrend. That is typically a great entry point. You can keep a very tight stop on any close beneath this moving average. Meanwhile, a short-term target would be the recent price high, though I'd be looking ultimately for a breakout.
Earnings Reports
Here are the key earnings reports for the next two days, featuring stocks with market caps of more than $10 billion. I also include a few select companies with market caps below $10 billion. Finally, any portfolio stocks that will be reporting results are highlighted in BOLD. If you decide to hold a stock into earnings, please understand the significant short-term risk that you are taking. Please be sure to check for earnings dates for any companies you own or are considering owning.
Wednesday, January 5:
RPM, SMPL
Thursday, January 6:
STZ, WBA, CAG, LW, HELE, DCT, WDFC, LNN, BBBY, SCHN, ANGO, SLP
Economic Reports
December ADP employment report: 807,000 (actual) vs. 414,000 (estimate)
December PMI composite: 57.0 (actual) vs. 56.9 (estimate)
Happy trading!
Tom