
EB Daily Market Report - Thursday, January 6, 2022
Market Vision 2022
Our annual Market Vision event will be held this Saturday, January 8th, beginning at 8:45am ET. It's just two days away! There is NO COST to EB.com subscribers. In fact, we are not even offering the event to non-members. This is exclusive EarningsBeats.com content and we're happy to provide it as yet another benefit of being a loyal EarningsBeats.com member. So thank you!
We'll be sending out room instructions before the event. If you cannot attend on Saturday, no worries. We'll record the event and make it available for all EB.com members so that you can enjoy it at your convenience.
Executive Market Summary
- Futures were weak and selling quickly gripped Wall Street after the opening bell
- After a harsh bout of selling, we've seen a nice recovery with all of our major indices now higher for the session
- Keep in mind it's more about where we close than where we trade intraday - the next few hours will be interesting indeed
- Many key large cap stocks are not recovering very well - stocks like Apple (AAPL, -1.12%), Tesla (TSLA, -2.08%), and Microsoft (MSFT, -0.19%)
- Energy (XLE, +1.96%) is the leading sector once again, while key sectors like technology (XLK, -0.19%) and consumer discretionary (XLY, -0.05%) are not participating
- Crude oil ($WTIC, +1.93%) is approaching $80 per barrel, providing tailwinds for energy
- Interestingly, gold ($GOLD, -1.88%), a notable inflation hedge, has fallen back below $1800 per ounce
- Cryptocurrencies are weak today, especially etherium ($ETHUSD, -5.10%)
- The 10-year treasury yield ($TNX) is up 2 more basis points and tested 1.75% earlier, the 52-week high
- Accordingly, banks ($DJUSBK, +2.28%) are having another very solid day and remain a viable trading area, especially if the TNX clears 1.75%
Market Outlook
Let the Volatility ($VIX) begin! This week could very well be a precursor to what we see over the next several weeks. We started off solid with a couple of opening gaps higher, followed by panicked selling. After a very weak start today, stocks have rallied back with growth stocks finally getting a bid. Rotation has been brutal. There's a ton of money to be made if you can time this rotation perfectly, but I find myself unable to consistently time it correctly. So I choose to sit it out and completely eliminate stock market risk for now. I might trade a stock here or there, but if I do, I will keep my stop very tight (and probably get stopped out). In this type of increasing-volatility environment, significant gains can be made very quickly, but just remember so too can significant losses.
Thus far, one key short-term support level has held. That's the 15000 level on the NASDAQ. That provides the bulls a chance for a recovery from this area. As I look at the NASDAQ, I'd watch two charts - one is the daily and the other is the hourly:
NASDAQ (daily):
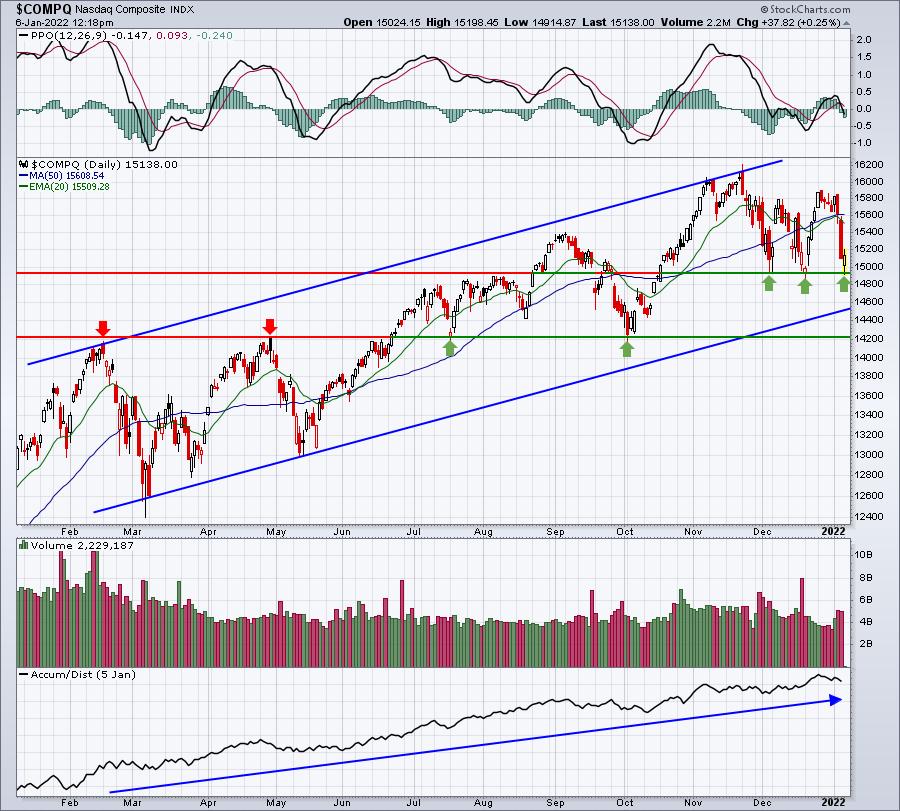
The bounce today occurred EXACTLY when it needed to. We've now seen a triple bottom just beneath 15000. Breaking below a strong area of support like this would be a very bearish short-term development, so keep an eye on this level. On the hourly chart below, are we trending lower or are we simply bouncing back and forth in a trendless environment?
NASDAQ (hourly):
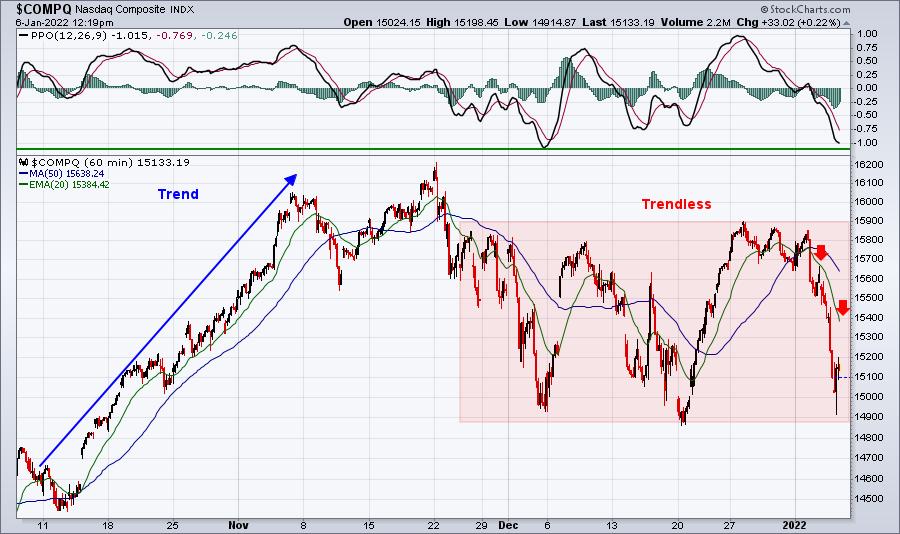
Again, I think it's pretty clear that loss of that triple bottom would be bearish, especially if the current rally cannot negotiate the declining 20-day EMA.
Sector/Industry Focus
Growth stocks are at least recovering for now. I'd say the odds are definitely greater than 50% that we haven't seen a bottom on this asset class, however. Technically, we could see short-term bullish action as key support levels have been tested on both the small cap growth index ($DJUSGS) and the mid cap growth index ($DJUSGM):
DJUSGS:
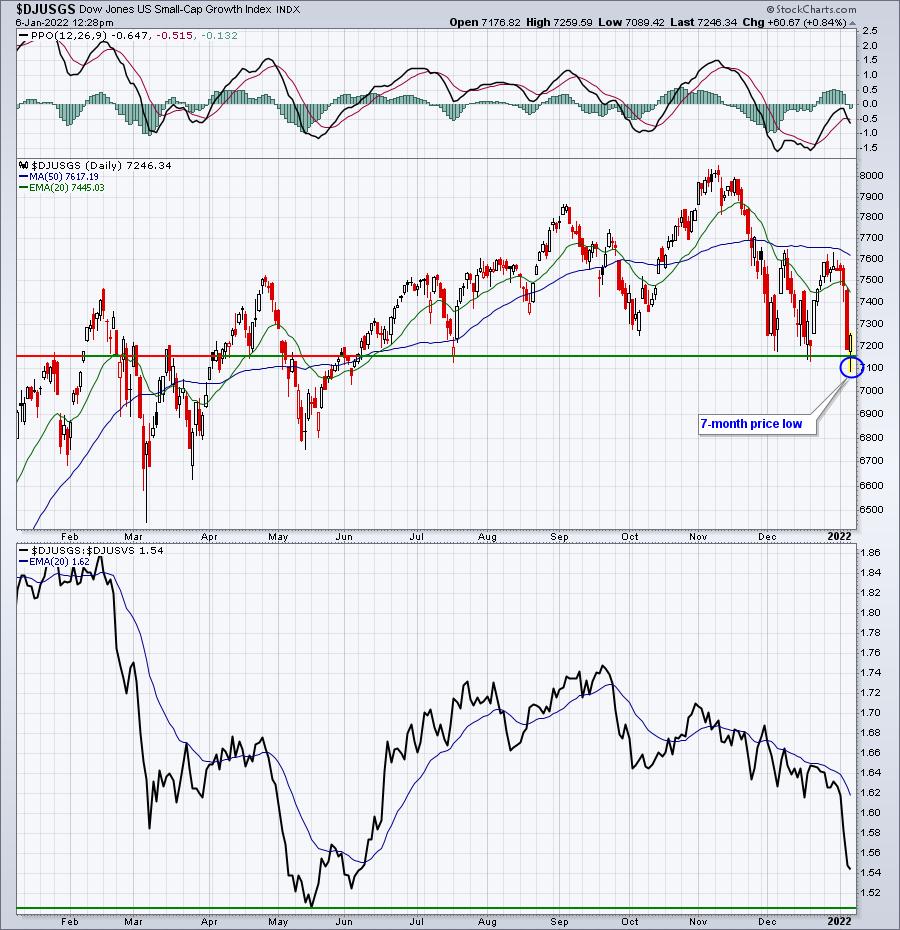
Many times, a false breakdown like we saw this morning marks a significant short-term bottom. Therefore, if you want to be very aggressive, you could consider small cap growth names. But let me say this. If the DJUSGS reverses and closes today beneath 7150, we could see selling accelerate significantly in this area.
DJUSGM:
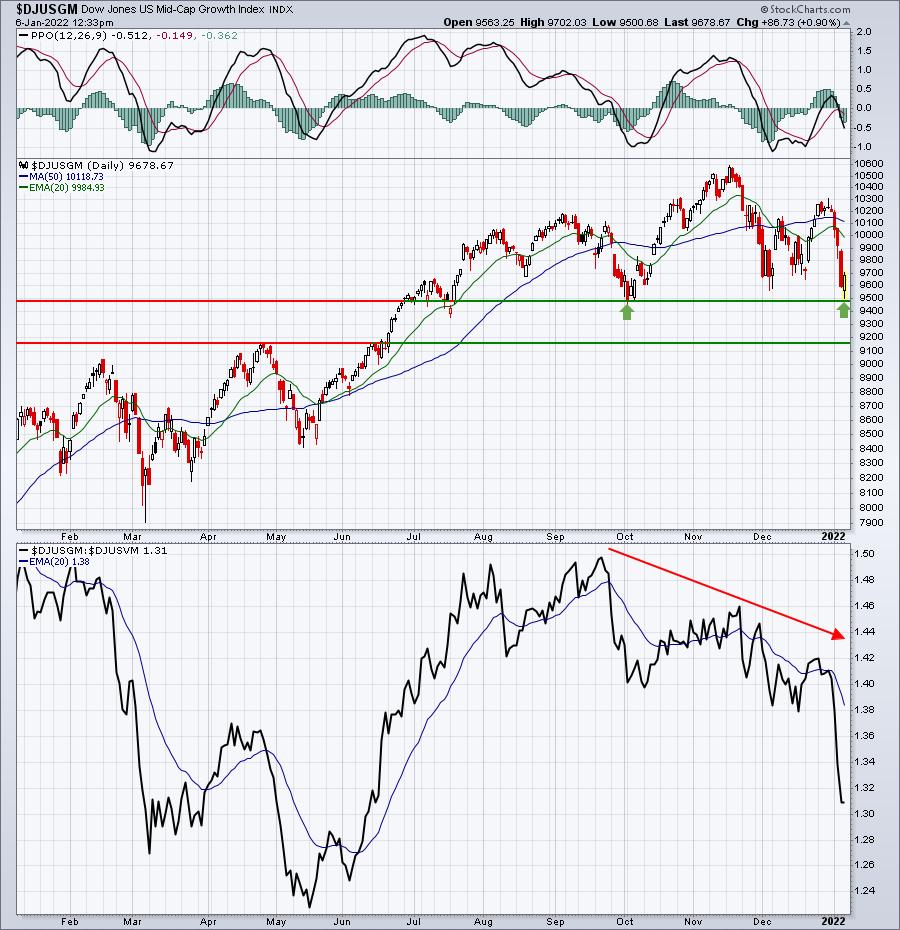
The reversal so far today on this index is quite clear as well. But how will we finish. The relative weakness of growth stocks vs. value stocks among both small caps and mid caps is very obvious in the bottom panels of each chart above. We're currently free-falling on a relative basis similar to what we did starting in February and April of 2021. We'll definitely bounce and money will flow back into growth again at some point and perhaps that is beginning today. Timing these reversals will be paramount in successfully trading the stock market. It's what made 2021 so very difficult, in my opinion, and I don't see this ending any time soon unfortunately.
ChartLists/Strategies
I was asked about shorting stocks in this environment. I'm not a big fan of shorting stocks during a secular bull market, because if my call for lower prices ahead is wrong, not only will I miss the upside opportunity, but I'll also lose money during a bull market. For me, there's nothing worse emotionally than losing money on a short position in a bull market, so I rarely trade on the short side. If anything, I might occasionally trade an inverse ETF like the SH (ETF that tracks the INVERSE of the S&P 500. In other words, the SH goes up when the S&P 500 goes down. Also, while you cannot short stocks in a retirement account, you can buy an inverse ETF like the SH.
If I were to short, my strategy would be to allow weak stocks to bounce to their respective 20-day EMAs and look for a reversal back to the downside there. The scan syntax would be the opposite of the 20-day EMA scan on our website and would look something like this:

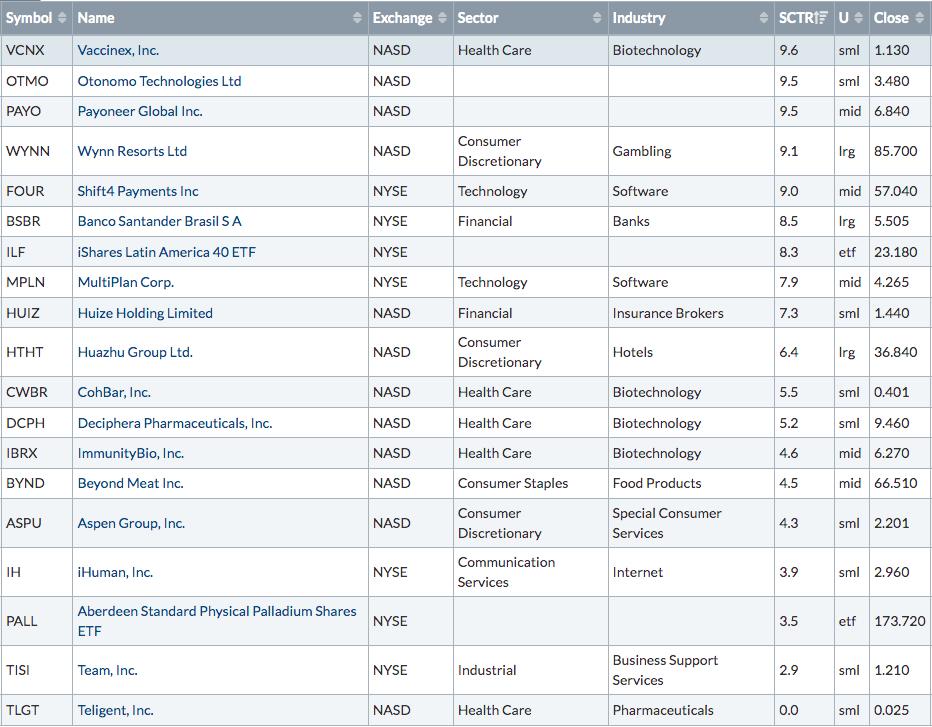
There were 18 results as follows:
Let's look at FOUR:
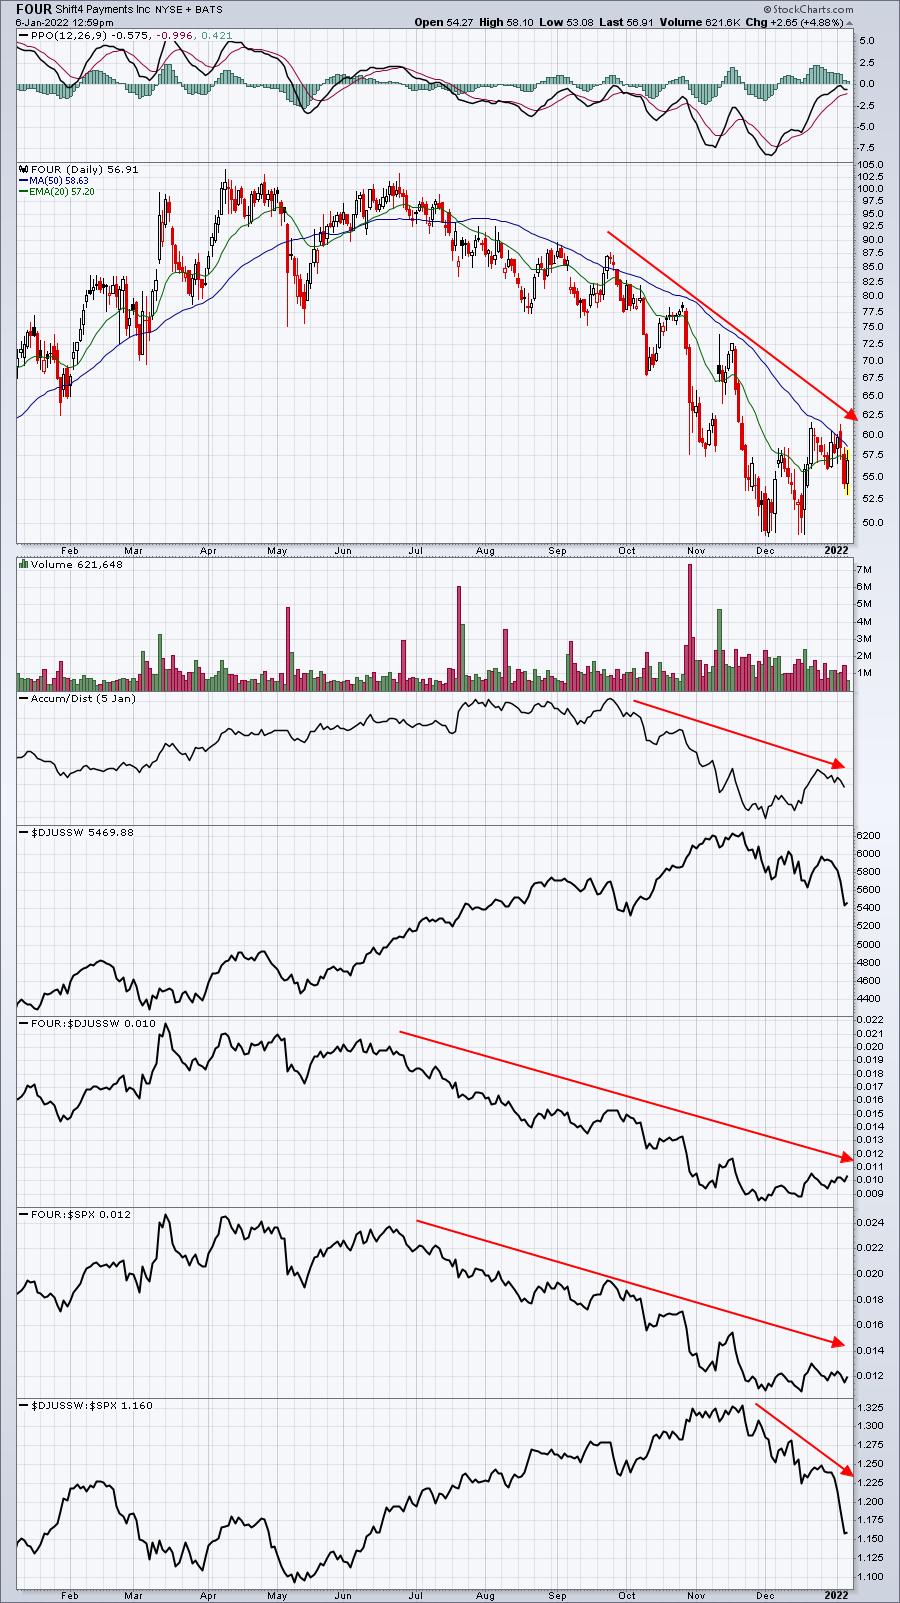
I'd consider a stock like this as a short for a few reasons. First, it's downtrending. I'd want to short a weak stock. Second, its PPO just returned to its centerline for a "reset". Many times, a trend will resume after a reset. Third, FOUR is up nearly 5% today, providing an opportunity to short into strength. Four, software ($DJUSSW) is one of the worst industry groups right now. If the group bounces and FOUR is able to clear the 20-day EMA, you can exit fairly quickly with minimal loss, but should the selling in this group escalate later today, a stock like FOUR could see gains evaporate quickly.
Earnings Reports
Here are the key earnings reports for the next two days, featuring stocks with market caps of more than $10 billion. I also include a few select companies with market caps below $10 billion. Finally, any portfolio stocks that will be reporting results are highlighted in BOLD. If you decide to hold a stock into earnings, please understand the significant short-term risk that you are taking. Please be sure to check for earnings dates for any companies you own or are considering owning.
Thursday, January 6:
STZ, WBA, CAG, LW, HELE, DCT, WDFC, LNN, BBBY, SCHN, ANGO, SLP
Friday, January 7:
AYI, GBX
Economic Reports
Initial jobless claims: 207,000 (actual) vs. 205,000 (estimate)
November factory orders: +1.6% (actual) vs. +1.3% (estimate)
December ISM services: 62.0 (actual) vs. 67.0 (estimate)
Happy trading!
Tom