
EB Daily Market Report - Tuesday, January 11, 2022
ChartList Updates
A few things:
- The Market Vision 2022 Excel Spreadsheet (that members requested access to) is now available on our website
- The Market Vision 2022 ChartList (18 charts) is also available (ChartLists page, scroll down to Webinar CLs)
- The Strong Earnings ChartList (SECL) has been updated
- The Strong Future Earnings ChartList (SFECL) has been updated
All ChartLists on our website can be viewed/downloaded by EB.com members. You'll need at least an Extra or Pro membership at StockCharts.com to download ChartLists. Non-members of StockCharts.com can view our ChartLists one chart at a time.
Executive Market Summary
- Futures turned slightly negative at the open after being higher overnight
- After early morning selling, the bulls resumed their climb from Monday's low
- Cryptocurrencies are rallying today as money moves into "risk-on" investments; etherium ($ETHUSD) is up more than 6%
- Commodities are rallying, including gold ($GOLD, +1.17%), which has been mysteriously missing from any rally, considering the inflation worries
- Crude oil ($WTIC, +4.00%) has jumped above $81 per barrel as energy (XLE, +3.10%) is easily today's top performing sector
- Technology (XLK, +1.16%) is showing strength today, led by renewable energy ($DWCREE, +1.78%) and semiconductors ($DJUSSC, +1.70%)
- Defensive sectors are mostly reeling today, with utilities (XLU, -1.19%) the undisputed laggard
Market Outlook
The bulls do not give up easy and we remain in a secular bull market. Market deterioration can take time and we probably are in that process, in my opinion. If we've truly begun a downtrend, declining 20-day EMAs, along with price and trendline support, should provide considerable headwinds. Here's the latest look at both the SPY and QQQ and how these two charts are setting up vs. their respective 20-day EMAs:
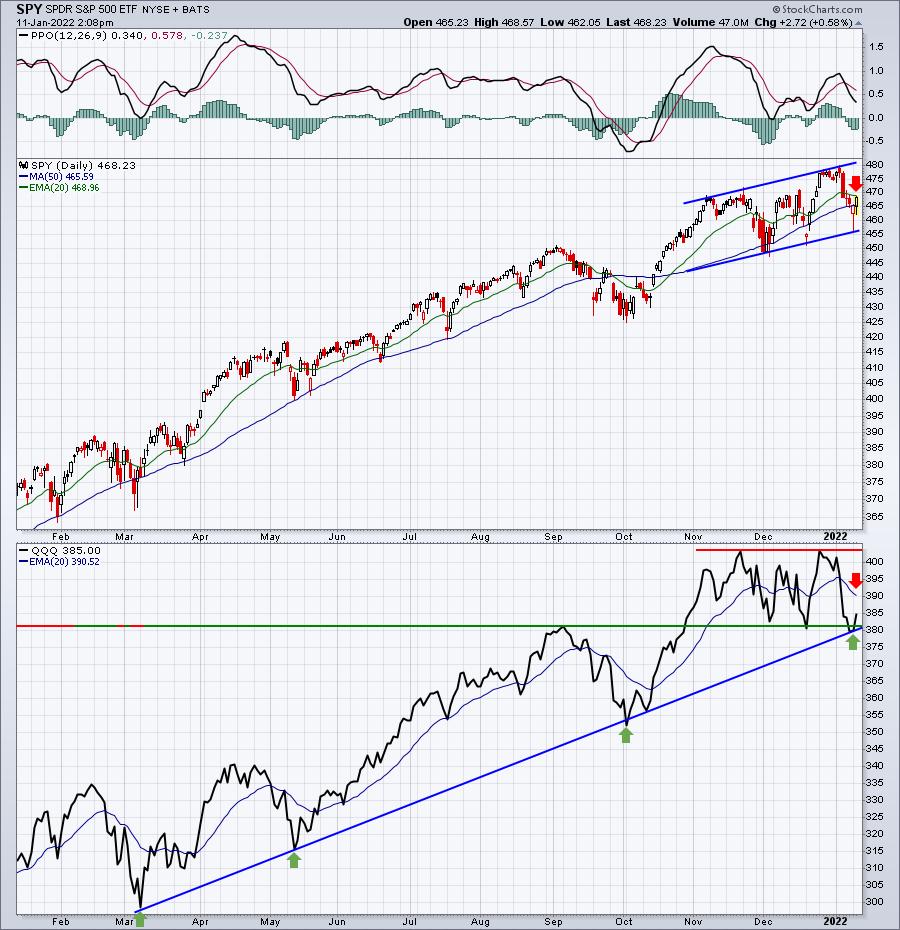
Yesterday, I featured this same chart, but on a very short-term hourly basis. The 20-hour EMAs did not hold the bulls back. I believe these 20-day EMAs are much more important. And the significance of Wednesday morning's December CPI report cannot be overstated. The consensus estimate for monthly Core CPI is +0.5%. I believe any number above that +0.5% level will not be handled well by the market, because of the increasing nervousness, as evidenced by rising VIX bottoms on higher S&P 500 prices in November and December. It's a signal that the market might have a much more difficult time handling bad news. A higher-than-expected Core CPI reading would fit that "bad news" category.
Sector/Industry Focus
I mentioned semiconductors ($DJUSSC) yesterday, discussing the importance of this group. I highlighted the gap support zone that I felt the group needed to hold. Thus far, that support zone has held, enabling the stock market to rally today. Here's a reprint of the chart from yesterday, highlighting the reversal off of gap support:
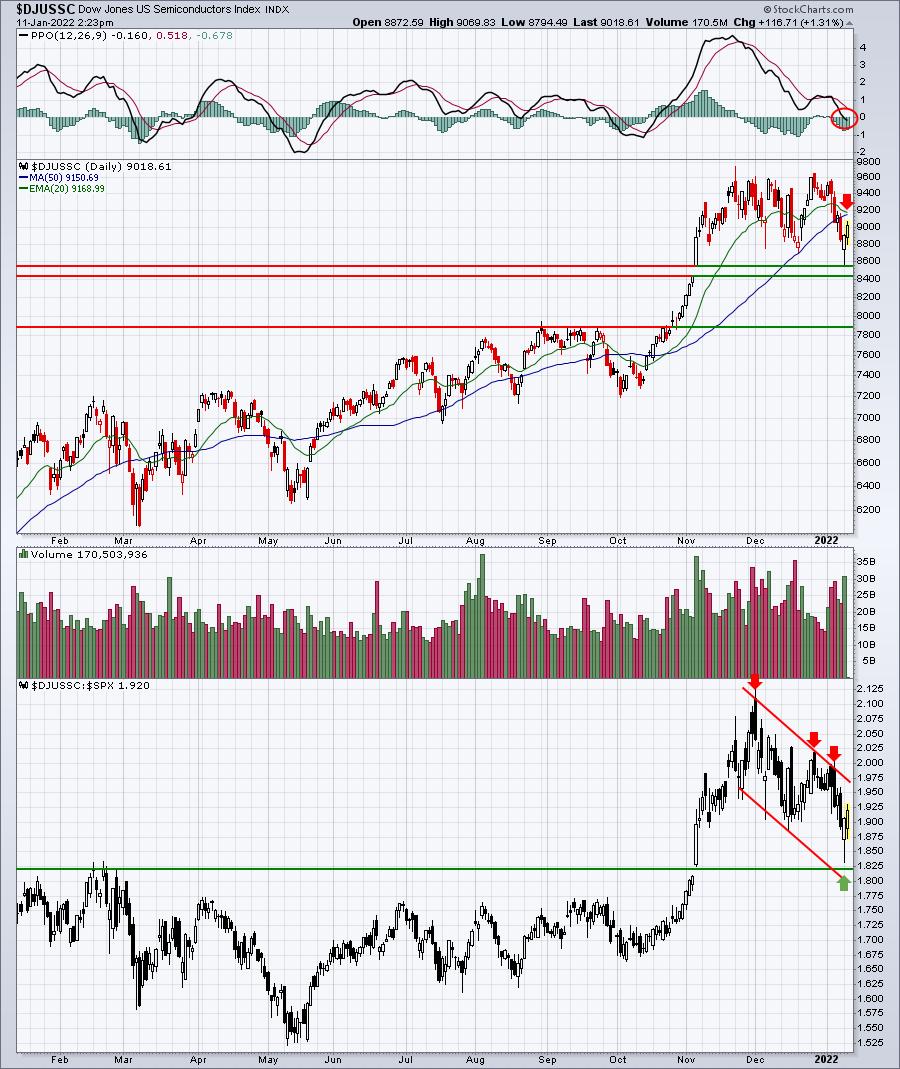
The only thing I added to the chart from yesterday are the red arrows that highlight the fast-approaching 20-day EMA and the current relative downtrend. An absolute price downtrend would suggest a failure at this moving average, while a move back above would continue the sideways consolidation that the group has been stuck in for 2 months. To grow more bullish semiconductors, I'd need to see the current relative downtrend broken back to the upside. I don't believe it's going to happen, but there are no guarantees. The market could ignore all the current warning signs and move back to new highs. But you have to be willing to accept considerable risk to bank on a break of the current relative downtrend.
ChartLists/Strategies
I updated the Strong Future Earnings ChartList (SFECL) a bit ago. To give you a little background about how I put this list together, the first thing I do is look to see which industry groups are outperforming the S&P 500. Then I look at the underperforming industry groups. Stocks that belong to outperforming industry groups need only have a SCTR score above 80 to be included in the SFECL. Stocks that belong to underperforming industry groups must have a SCTR score above 95 to be included in the SFECL. It's probably worthwhile to let you know which industry groups moved from underperforming to outperforming, and vice versa, so here's that information:
From underperforming to outperforming:
- Reinsurance ($DJUSUI)
- Banks ($DJUSBK)
- Life insurance ($DJUSIL)
- Nonferrous metals ($DJUSNF)
From outperforming to underperforming:
- Software ($DJUSSW)
- Specialty retail ($DJUSRS)
- Footwear ($DJUSFT)
- Publishing ($DJUSPB)
- Internet ($DJUSNS)
The interesting part here is that the 5 industry groups that have moved to underperforming all belong to the aggressive technology, consumer discretionary, and communication services sectors. Meanwhile, the 4 industry groups that have moved to outperforming belong to financials and materials. This is another signal that confirms the rotation taking place from growth-oriented to value-oriented areas of the market. I thought it was interesting and wanted to share it.
Yesterday, I discussed that the higher volatility ($VIX) makes short-term trading dangerous from both a long and short perspective. The past 24 hours underscores the point I was trying to make. At this time Monday, it looked like we had major breakdowns across many indices, sectors, industries, and individual stocks. Now we're seeing major kick saves and reversals from yesterday, with further gains today on many stocks. If you're interested in shorting, let me highlight several charts and areas that I consider to be great reward to risk entries on the short side. Of course, this doesn't mean they'll work, just that you can enter with very little risk if the trade goes against you. I won't short individual stocks, but for those of you that do, you might consider the following red arrows as "lines in the sand" to manage risk to the upside:
AAPL:
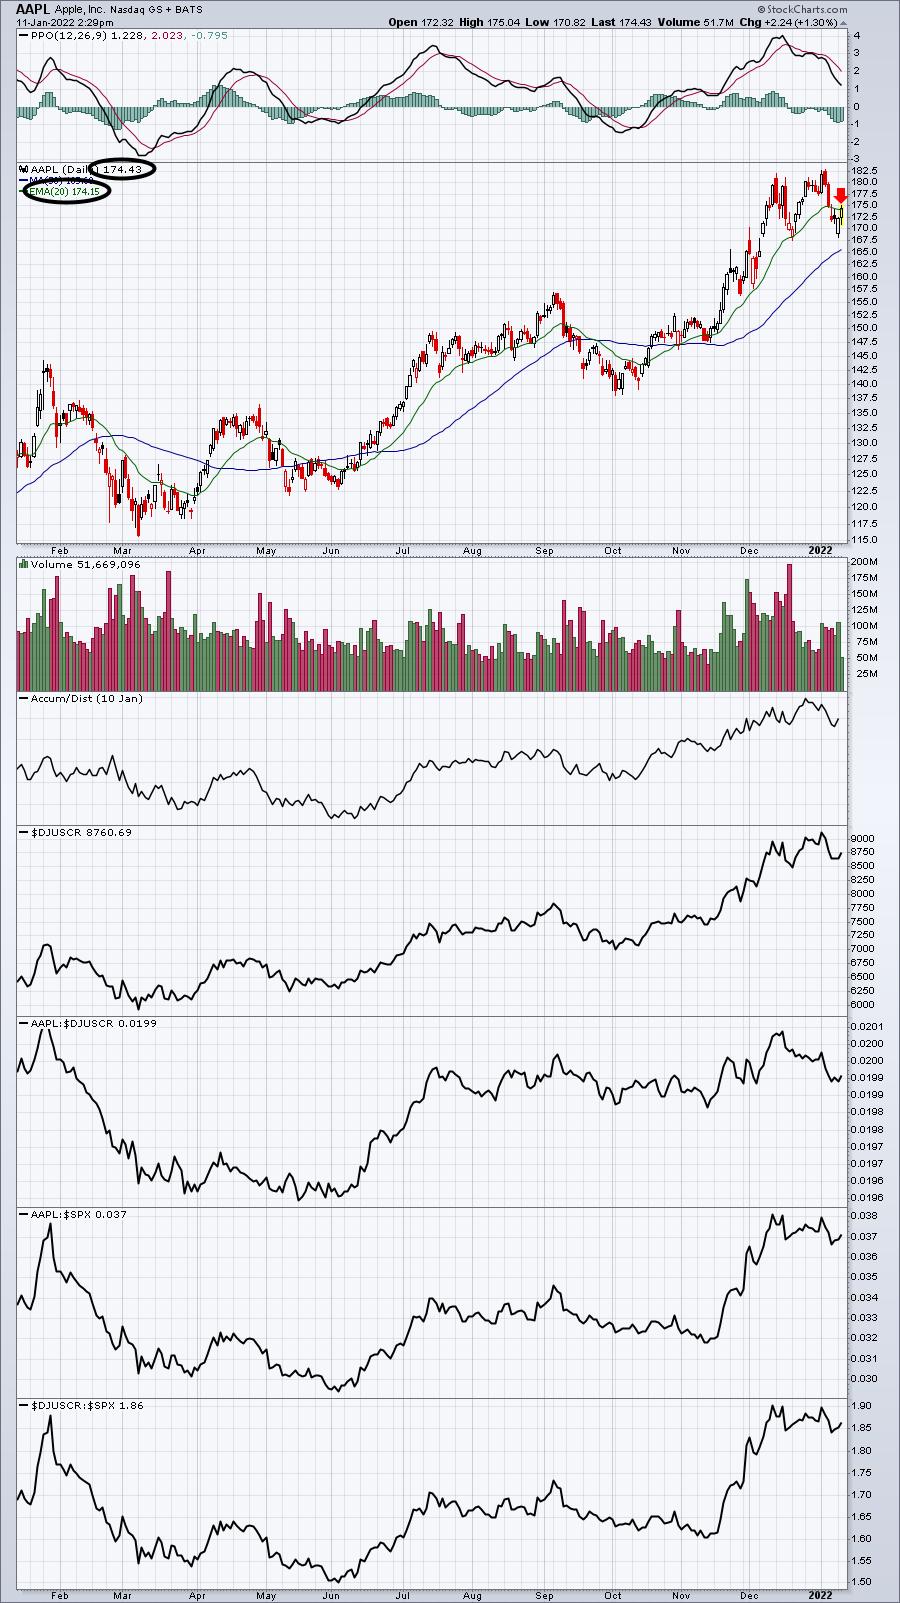
If AAPL is able to negotiate this 20-day EMA on a closing basis, another potential pattern to watch would be a topping head & shoulders pattern. The left shoulder topped out near 182.50. A close back above 175 would increase the likelihood of further appreciation to possibly establish a right shoulder in the 180.00-182.50 range.
TSLA:
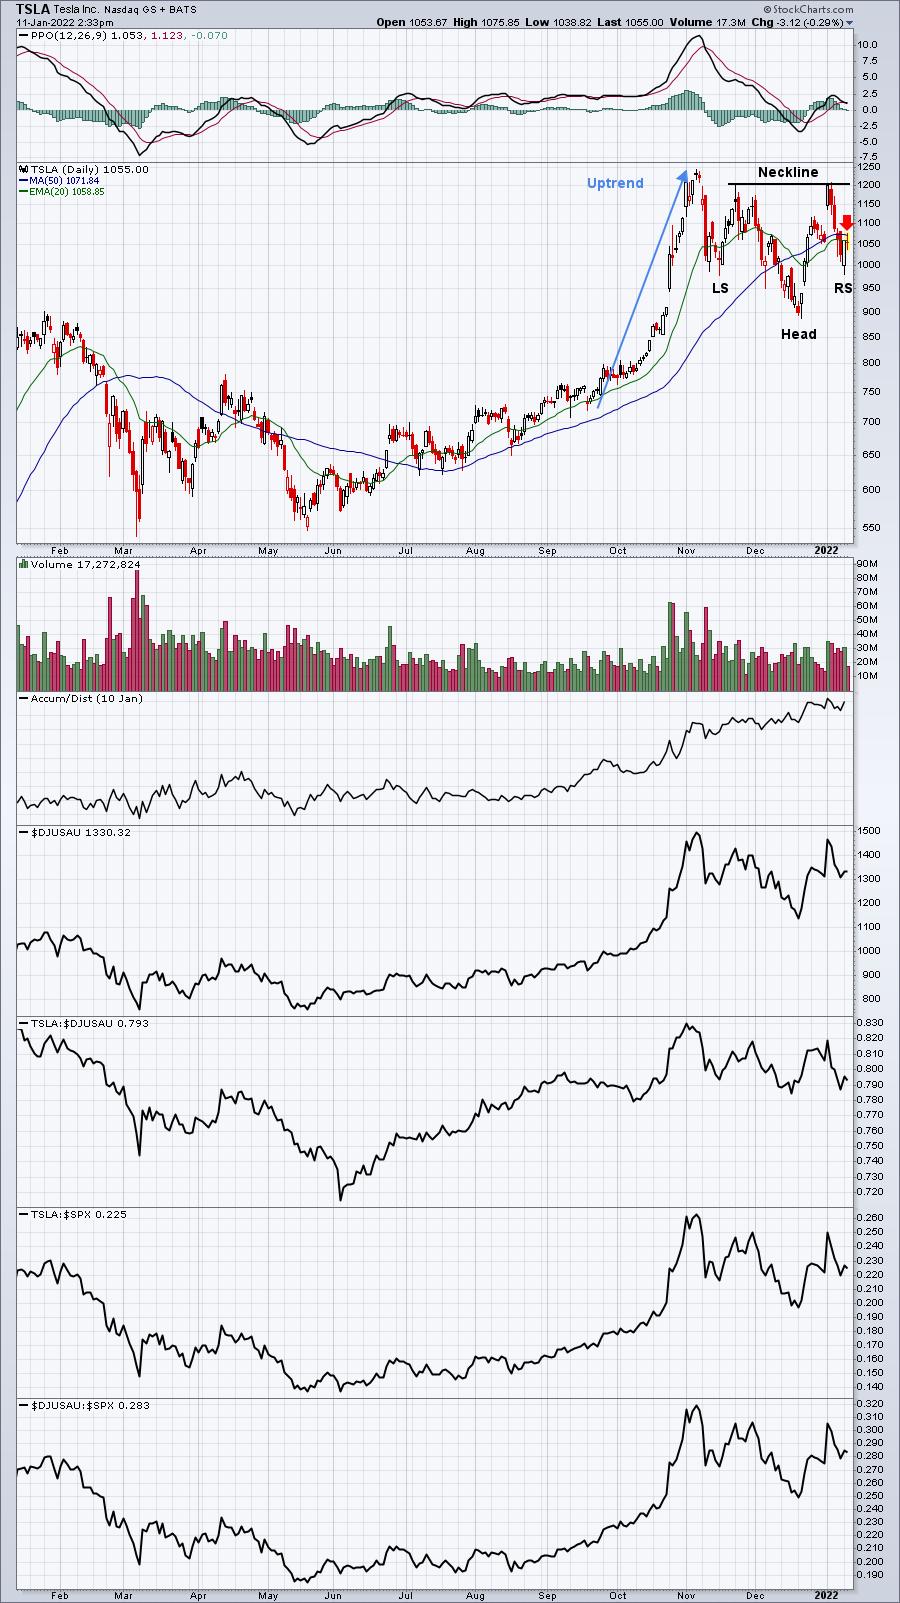
I'm a big fan of TSLA, so it's not a stock I'd consider shorting. I especially like this bullish inverse head & shoulders pattern. A breakout above would have an initial measurement to 1500.
MSFT:
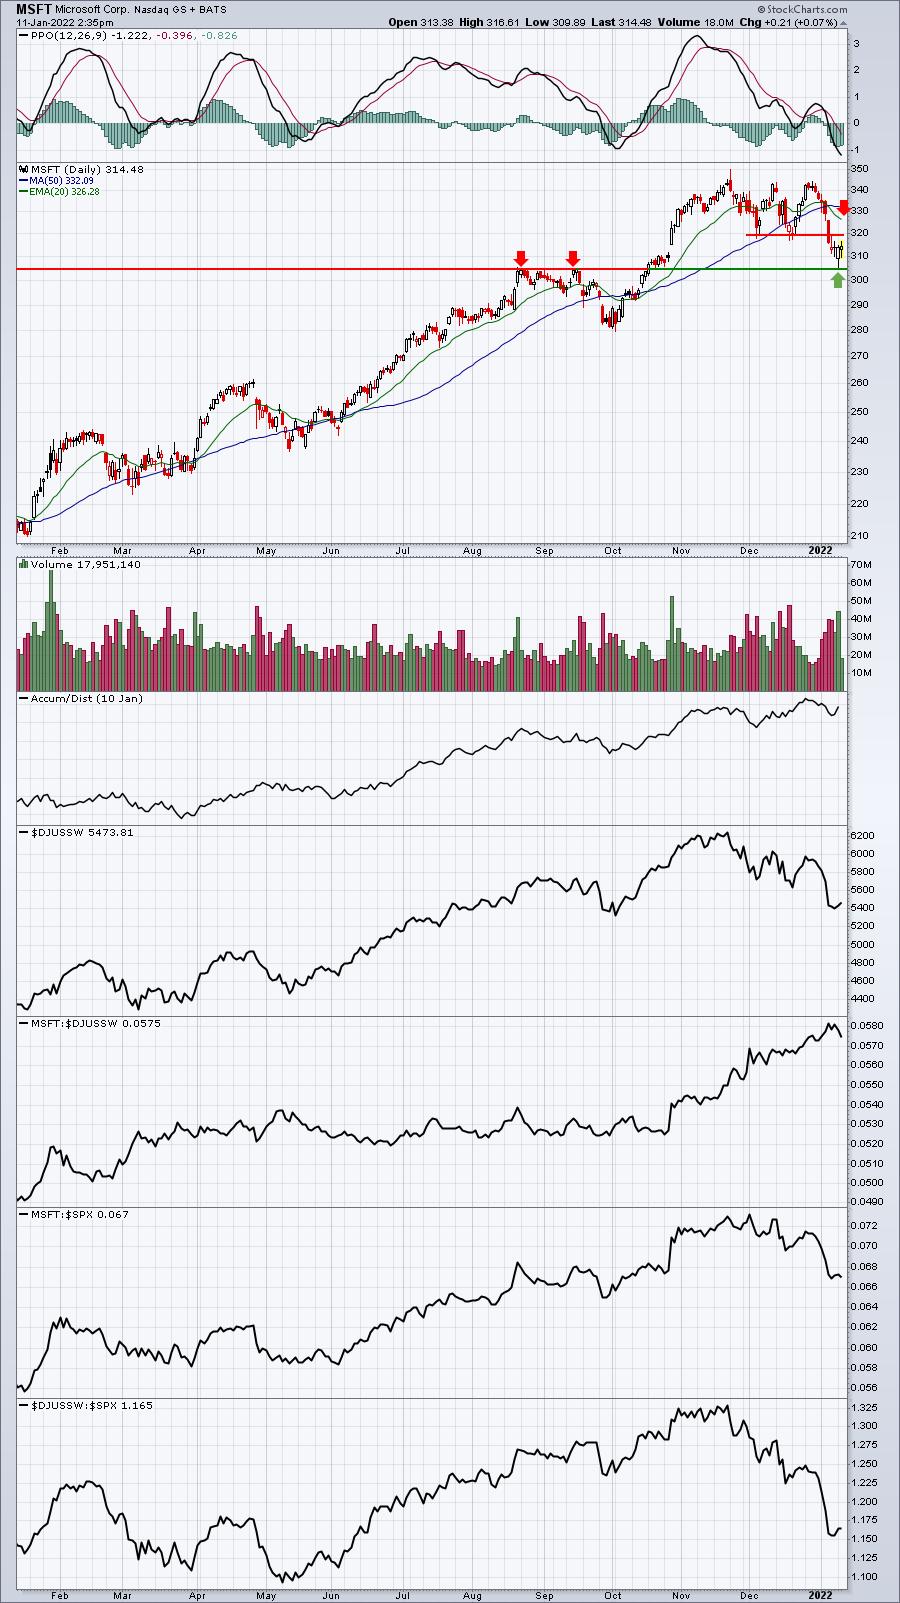
The recent double-bottom breakdown near 320 is likely to provide overhead price resistance. The declining 20-day EMA, currently at 326, should also pose considerable headwinds. Finally, the software space has been AWFUL over the past several weeks, so any bounce could be very short-lived.
GOOGL:
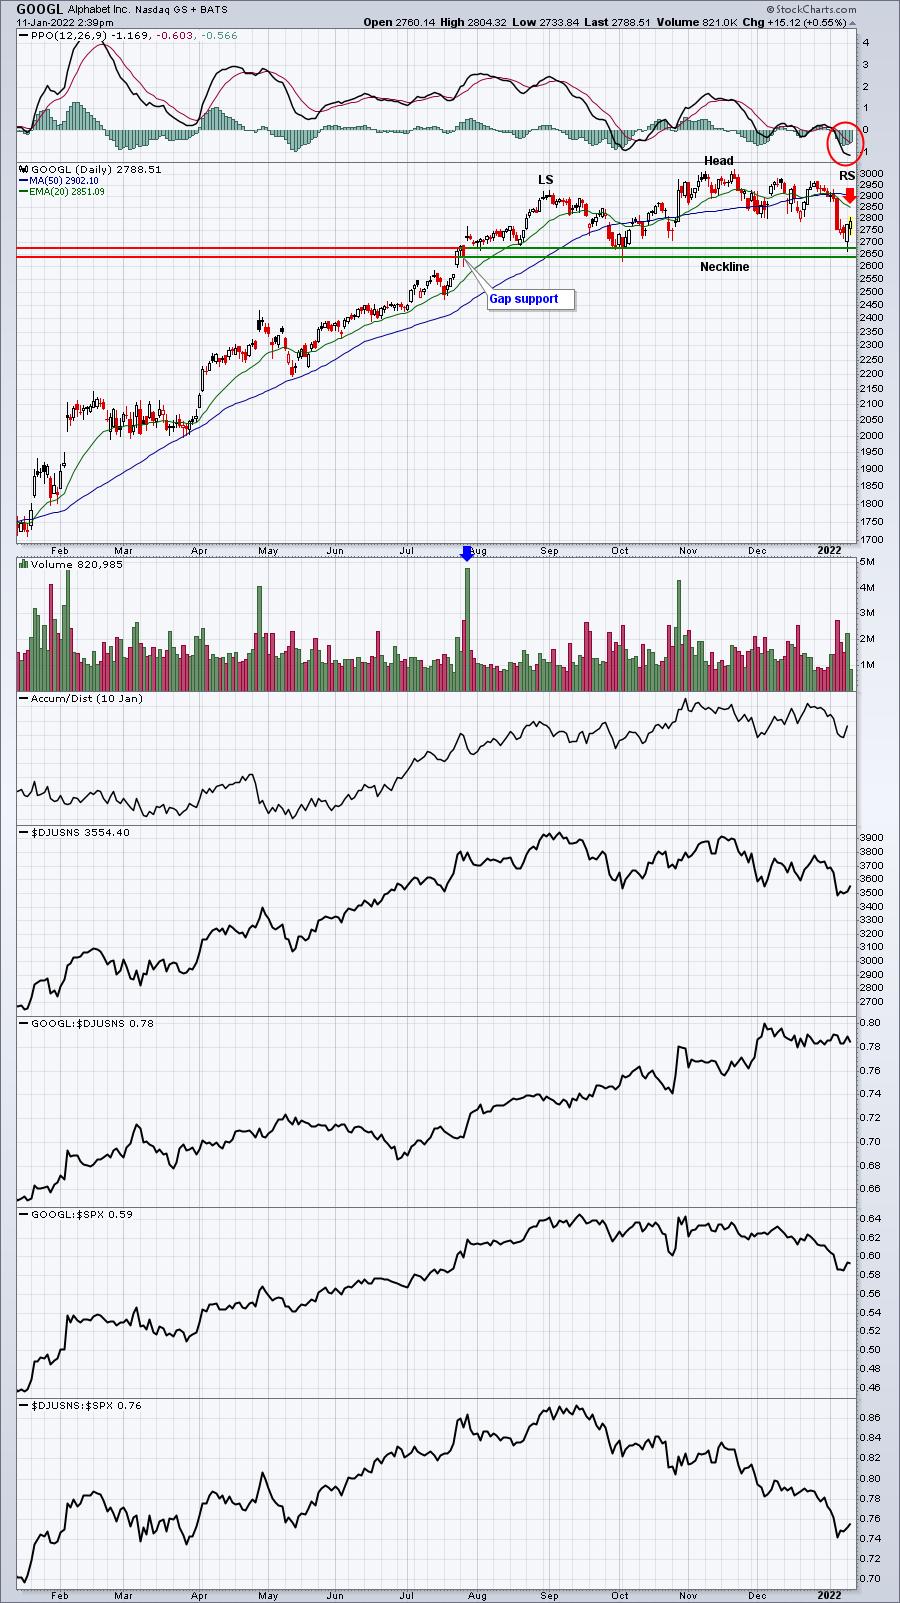
GOOGL has a number of issues too. First, its industry group - internet ($DJUSNS) - has weakened considerably, hitting a level of relative weakness not seen since March 2021. Throw in that very weak PPO and the topping pattern in play, and it's quite clear to me that GOOGL does NOT want to break below neckline support. That breakdown would measure to 2350-2400.
AMD:
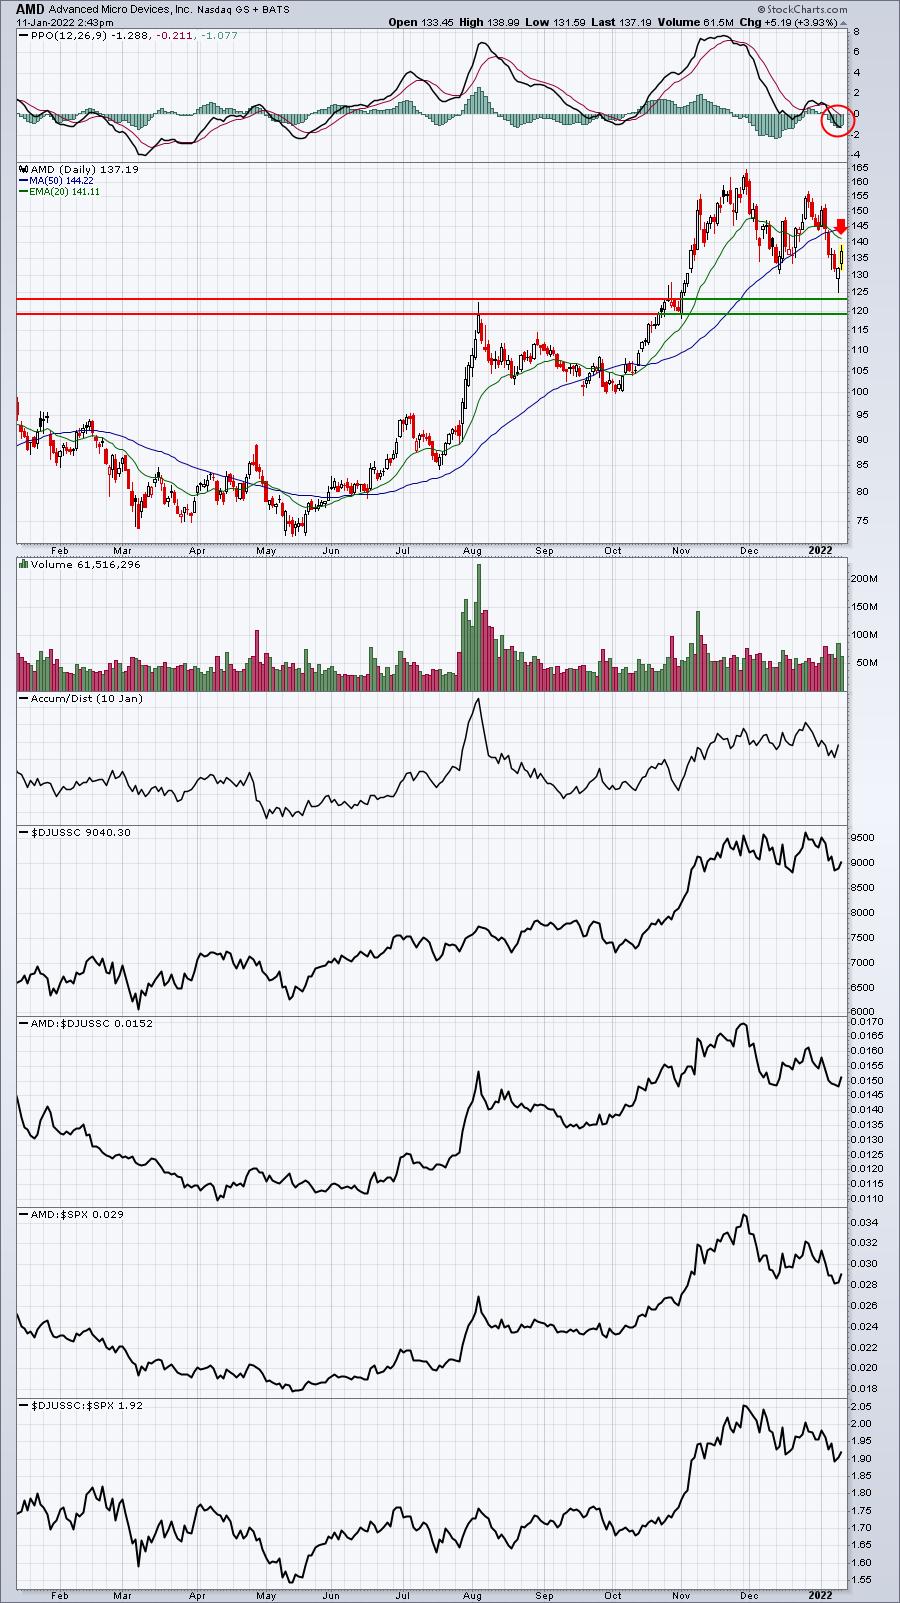
AMD's performance quite obviously will be impacted with what the semiconductor group ($DJUSSC) does. The key short-term overhead test will be its 20-day EMA, while its best support resides in the low 120s. The negative PPO tells me to be very careful on the 20-day EMA test.
Shorting any of these stocks is less risky today than it was 24 hours ago as they've had solid advances and are now much closer to key price and moving average resistance. I will say this, however. Trading anything - on either the long or short side - is quite risky, because of the potential for a significant gap higher or lower. Given tomorrow's CPI report, I'd say this possibility is magnified quite a bit.
Earnings Reports
Here are the key earnings reports for the next two days, featuring stocks with market caps of more than $10 billion. I also include a few select companies with market caps below $10 billion. Finally, any portfolio stocks that will be reporting results are highlighted in BOLD. If you decide to hold a stock into earnings, please understand the significant short-term risk that you are taking. Please be sure to check for earnings dates for any companies you own or are considering owning.
Tuesday, January 11:
ACI, SNX
Wednesday, January 12:
INFY, WIT, SJR, JEF, KBH, ETWO
Economic Reports
None
Happy trading!
Tom