
EB Daily Market Report - Thursday, January 20, 2022
Executive Market Summary
- Futures were up throughout the night and we saw our major indices gap higher
- After initial buying, sellers once again have taken over the market as the NASDAQ's intraday 300-point gain has completely vanished
- Gold (GLD, -0.18%) broke out yesterday, but is pulling back a bit today; I'm not usually a fan of GLD, but I do like the short-term prospects as I could see $2000 per ounce coming
- Defensive sectors are mostly outperforming, as the aggressive consumer discretionary (XLY, -0.85%) group lags
- Recreational products ($DJUSRP, -3.01%) are under significant selling pressure, especially Peloton (PTON, -24.40%) after announcing a halt to production for both February and March due to lack of demand
- The 10-year treasury yield ($TNX) is up 3 basis points to 1.83%, putting more pressure on growth stocks
- After rising 16 of the past 20 days, crude oil ($WTIC, -0.77%) is finally pausing
- December existing home sales were very weak, pressuring home construction ($DJUSHB), which is now down approximately 12% over the past 5 trading days - more on this below
Market Outlook
Volatility ($VIX) can play a key role in short-term stock market performance. Any time that we see the stock market selling off, I watch the VIX closely. Over the years, I've discussed the VIX and said that any time it's over the 15-17 level, there's a sense of nervousness in the stock market. And when it's above that level and steadily rising, that's when we can see panicked selloffs as market makers go on what I call "vacation". The market maker role is to provide liquidity and stability to our stock market. However, they do have limited capital, so when intense selling kicks in and they're flooded with sell orders, they become matadors with capes, allowing prices to drop precipitously. A rising VIX selloff is the one time where I crawl into my trading shell as trading in both directions becomes increasingly emotional. Some traders love it. I hate it.
I'm discussing this because the VIX is up from 17.22 at the close on December 31st to 23.46 at last check. This rise of roughly 36% has occurred while the S&P 500 has fallen from 4766 to 4536. Again, any time the VIX is rising in an uptrend, you want to be very, very careful. So where might the VIX top out, so that we may see a rebound in equity prices? Well, the following chart of the S&P 500 shows levels of the VIX where prior rebounds have occurred. Any move in the VIX above 30 is where I'd begin looking for a significant bottom.
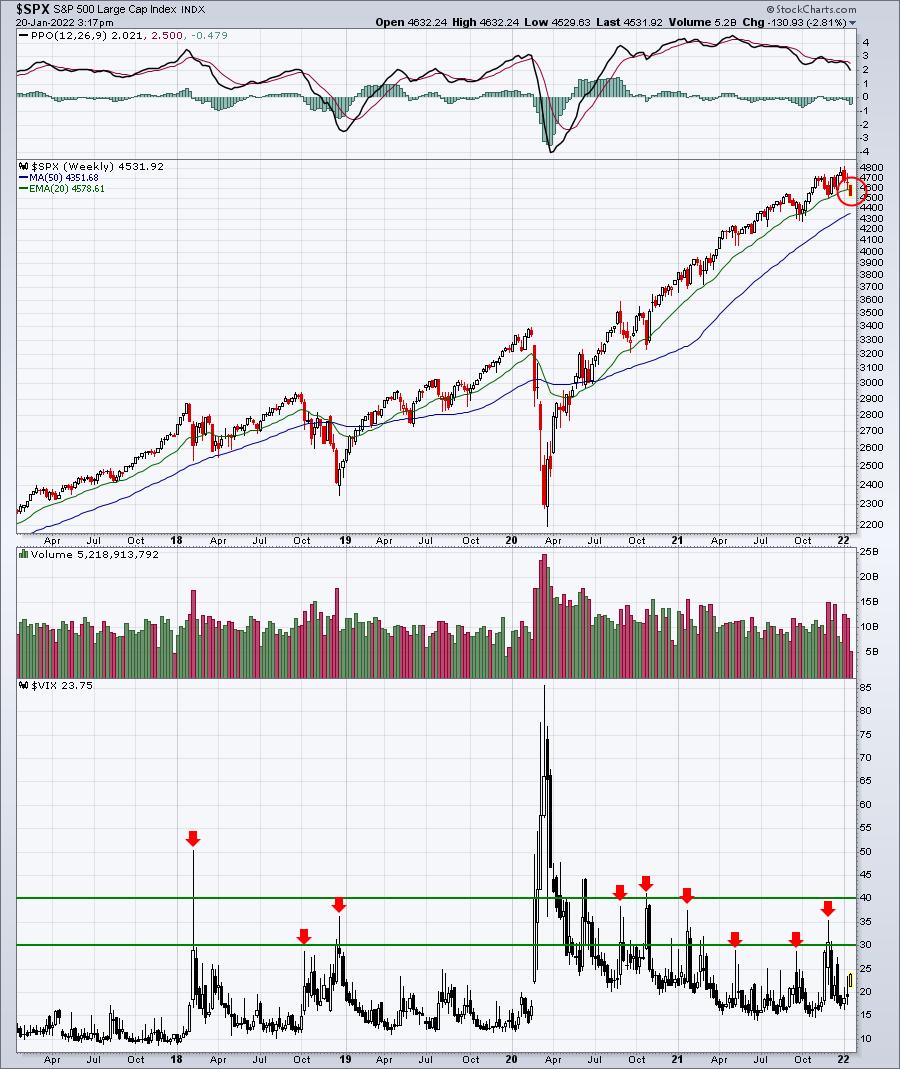
Just keep in mind that sometimes the VIX moves to the mid- to upper-30s, or even the 40s, so if you jump into equities when the VIX hits 30, you may still be premature and take on considerable risk.
I believe the VIX will move into the 30s, and possibly even the 40s, at some point over the next few months. Those will mark tradable market bottoms, in my view. Let's keep watching.
Sector/Industry Focus
Home construction ($DJUSHB, -0.21%) has reversed lower today as yet another economic report in this space came up short. December existing home sales dropped to 6.1 million units, well below the 6.4 million units expected. Weakening economic reports, combined with higher interest rates, is not a great combo for this industry and it's showing up technically on the chart:
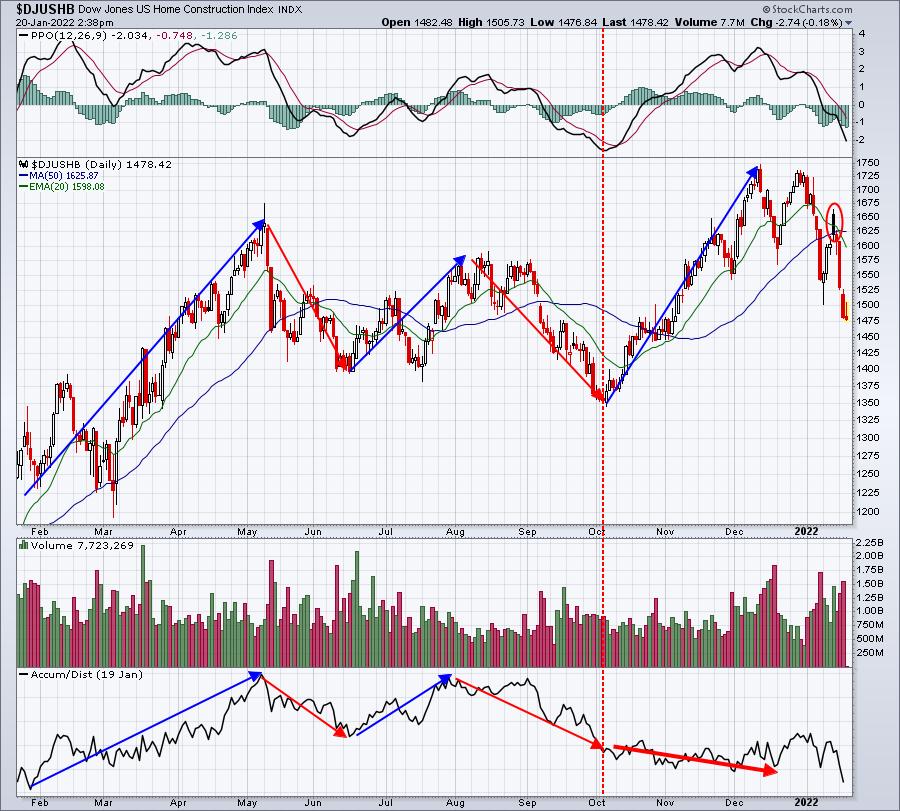
Notice how the AD line fully confirms the uptrends and downtrends.....until we moved into Q4. Prices moved higher in Q4, but the AD line moved to new lows. That's a signal that Wall Street was bailing on the move higher. It's just one more reason why we need to be careful in 2022 - at least for now.
ChartLists/Strategies
Two days ago, I mentioned here in the DMR that both Peloton (PTON) and Teladoc Health (TDOC) were interesting trade candidates short-term because of significant net in-the-money put premium. Both were into the hundreds of millions of dollars, so any bounce would reduce the amount to be paid out by market makers. While both stocks have been mostly solid trades the past couple days, PTON made an announcement earlier this afternoon that they were halting production.....and the stock was halted.....FOUR times because of circuit breakers. It was obviously a very unlucky development in terms of trading it short-term to the upside. But it does underscore the aggressive nature of these trades and the importance of keeping stops in play. Here are 5-day 10-minute charts for both stocks to highlight the action, along with Ford (F), which was one of our portfolio stocks subject to short-term downside manipulation because of an inordinate number of net in-the-money call premium:
PTON:
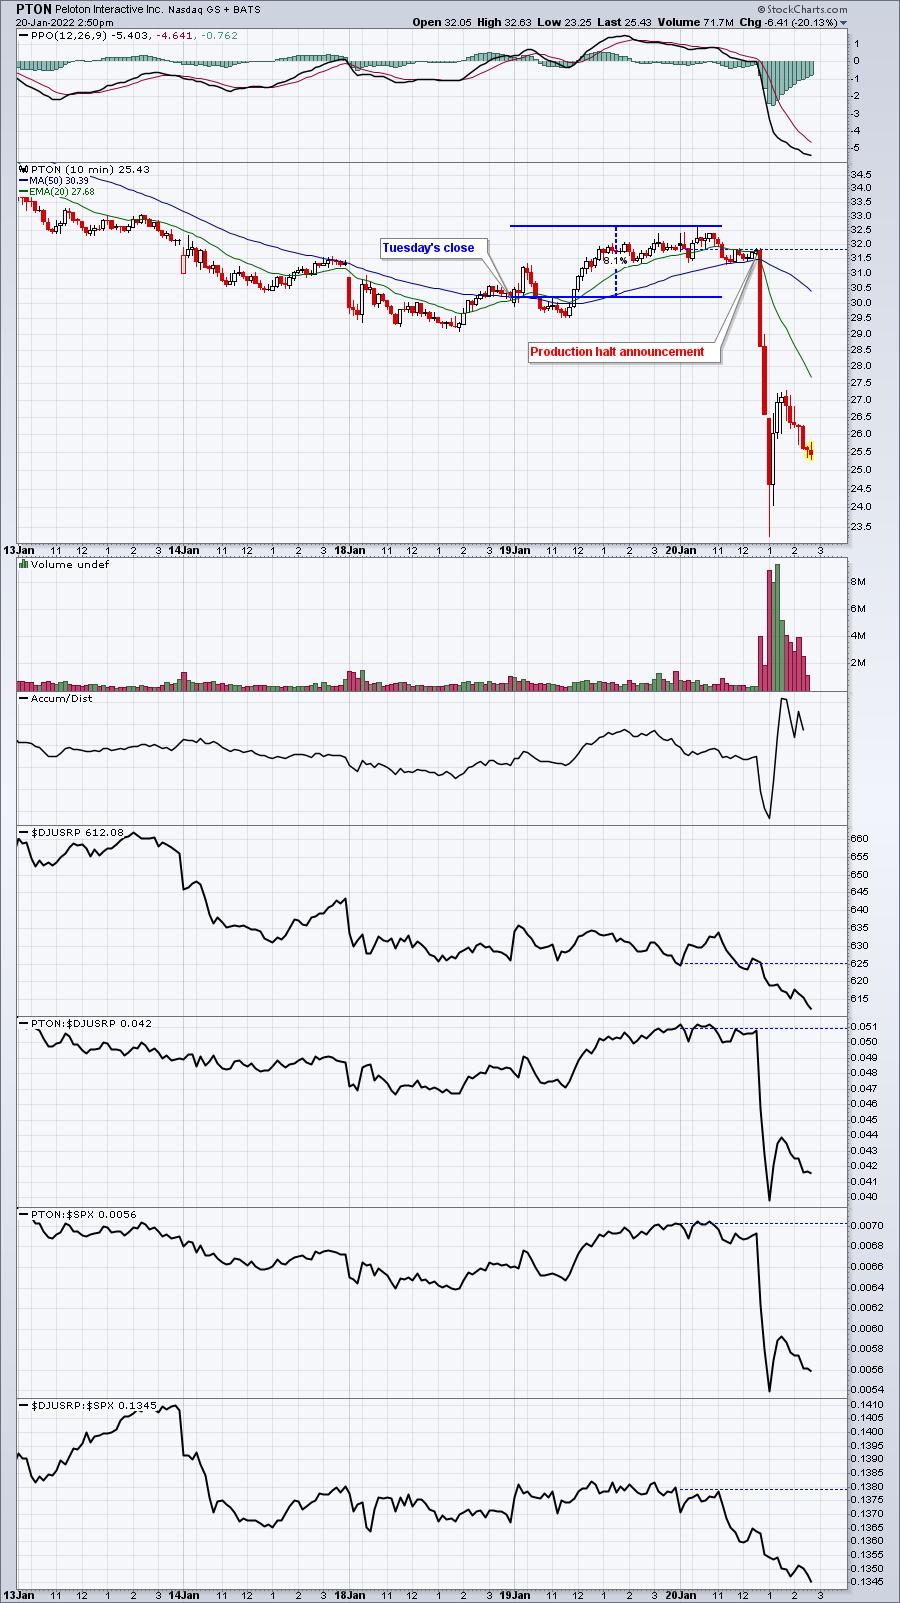
While many growth stocks have struggled over the past several months, because of the prospects of higher inflation and higher interest rates, PTON obviously has more fundamental issues. Even $200 million + of financial incentive for market makers can't trump a 2-month halt of production.
TDOC:
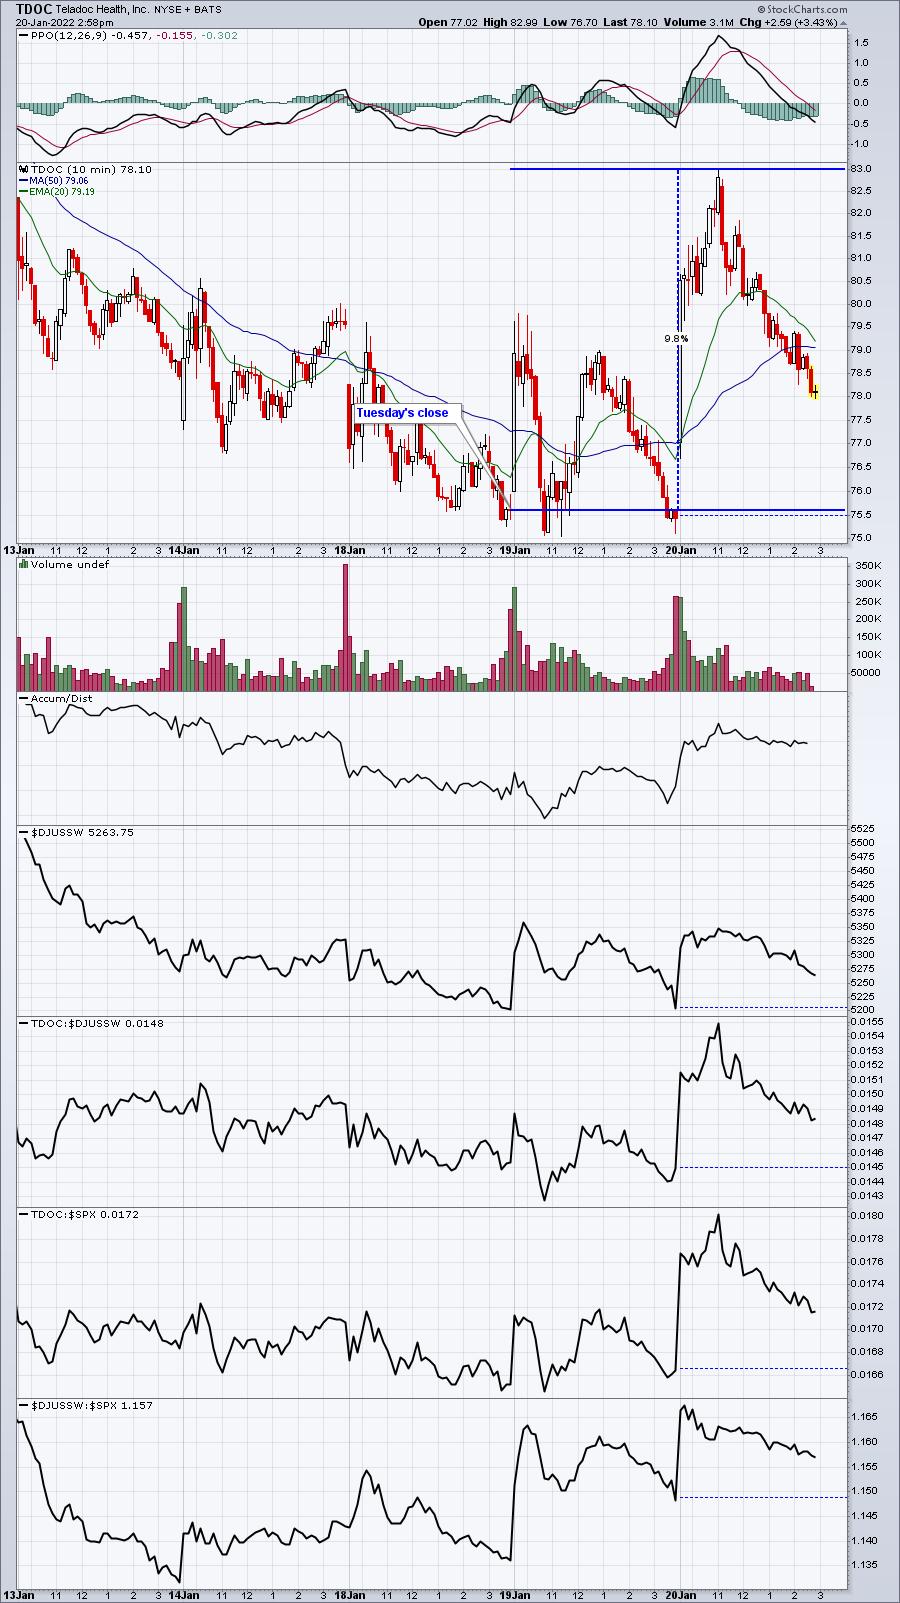
At its peak this morning, it had surged close to 10% from Tuesday's close. This is the type of short-term performance we look for, but don't always get, from our max pain trade candidates. You can see it's already 5 bucks off its intraday high, underscoring the need to take at least partial profits, when given the opportunity. These are trades, not buy-and-holds.
F:
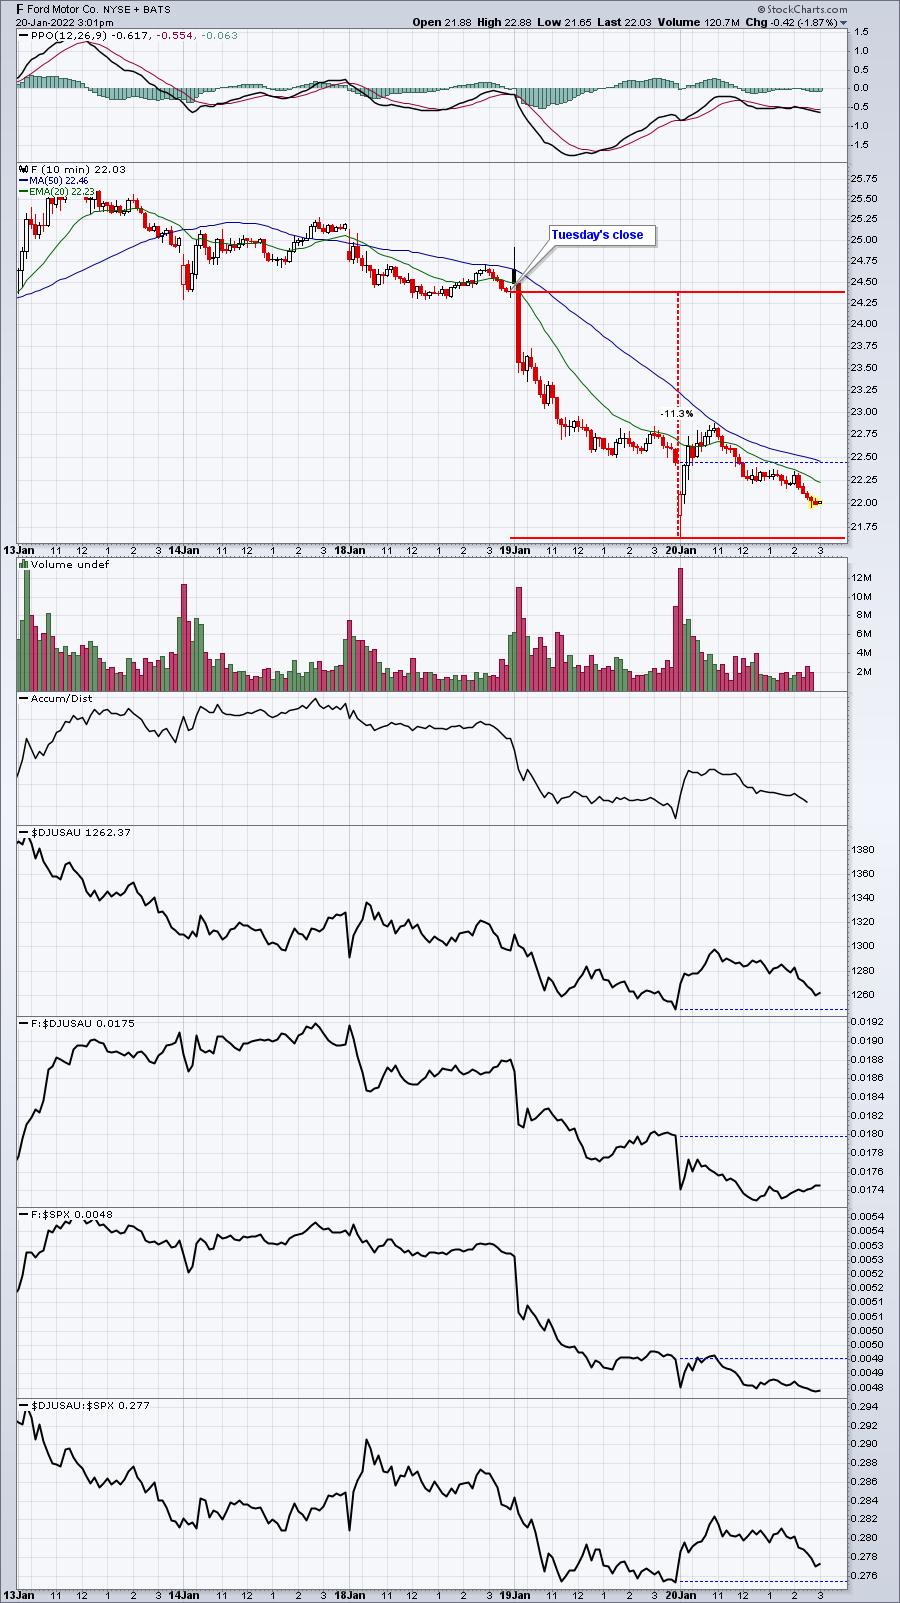
At the intraday low shortly after today's open, F had fallen more than 11% from Tuesday's close, simply another reminder of how fast some of these stocks can move with millions of dollars on the line around options expiration Friday.
Earnings Reports
Here are the key earnings reports for the next two days, featuring stocks with market caps of more than $10 billion. I also include a few select companies with market caps below $10 billion. Finally, any portfolio stocks that will be reporting results are highlighted in BOLD. If you decide to hold a stock into earnings, please understand the significant short-term risk that you are taking. Please be sure to check for earnings dates for any companies you own or are considering owning.
Thursday, January 20:
NFLX, UNP, ISRG, CSX, TRV, FITB, BKR, NTRS, KEY, RF, MTB, AAL, FHN, SNV, WBS, WNS
Friday, January 21:
SLB, INFO, HBAN, ALLY
Economic Reports
Initial jobless claims: 286,000 (actual) vs. 207,000 (estimate)
January Philadelphia Fed Manufacturing Index: 23.2 (actual) vs. 19.1 (estimate)
December existing home sales: 6,100,000 (actual) vs. 6,400,000 (estimate)
Happy trading!
Tom