
EB Daily Market Report - Friday, January 21, 2022
Q&A
One question that I receive quite often about the Daily Market Report (DMR) is why I send it out so late. Sometimes it's simply because I have other things going on during the day and I don't start writing it until the afternoon. But when the stock market is very weak, as it is now, I like seeing how the market is performing in the afternoon. In downtrends, we typically see morning strength and afternoon weakness. Today was a perfect example. I don't know where we'll be at 4:00pm ET as the current volatility can see major shifts in a matter of minutes, but just past 11:00am ET, it looked like we had a reversal underway as our major indices turned green after an ugly start to the day. The intraday candles looked quite bullish. Now fast forward 3-4 hours and look at those same candles. They're not nearly as bullish. Wall Street has a way of painting a mirage during the morning hours to encourage you to do things you probably shouldn't do. Then reality sets in during the afternoon. The rising volatility makes chasing prices, either higher or lower, a very dangerous game. It's the primary reason why I tend to sit in cash in higher volatility periods. It's easy to lose 3 weeks' worth of gains in an hour.
I hope this helps to explain the late afternoon arrival of the DMR.
Executive Market Summary
- Futures were slightly lower overnight and we saw slight gaps lower into the open
- The Volatility Index ($VIX) has surged more than 12% and is nearing a key level at 30
- The high level of fear increases the odds of market makers going on vacation, which typically results in very heavy selling over brief periods of time
- Cryptocurrencies are under intense selling with etherium ($ETHUSD, -14.49%) leading the charge
- Crude oil ($WTIC, -0.70%) is down again, but only fractionally; other commodities are mostly lower as well
- Gold ($GOLD, -0.59%) is down a lesser percentage than U.S. equities and I expect that to continue (ie, gold to outperform)
- The 10-year treasury yield ($TNX) has silently dropped 9 basis points to 1.74% and no one cares
- Netflix (NFLX, -23.44%) reported a slowdown in subscriber growth and a "slowdown" in anything when it relates to a growth company is a bad thing
- Communication services (XLC, -3.20%) and consumer discretionary (XLY, -2.96%) are taking the brunt of today's selling; specialty retail ($DJUSRS, -9.35%) is getting slammed
- Meanwhile, the defensive consumer staples (XLP, +0.14%) is the only sector gaining ground
Market Outlook
Yesterday, I showed a weekly chart of the S&P 500, while checking out the Volatility Index ($VIX) from an intermediate-term view. Today, let's pull up a similar chart of the S&P 500, but this on a daily basis to highlight where we might see a market bounce. I believe we're getting closer to a short-term bottom, but any such bottom will likely be temporary, lasting anywhere from a few days to a few weeks. Here's the chart:
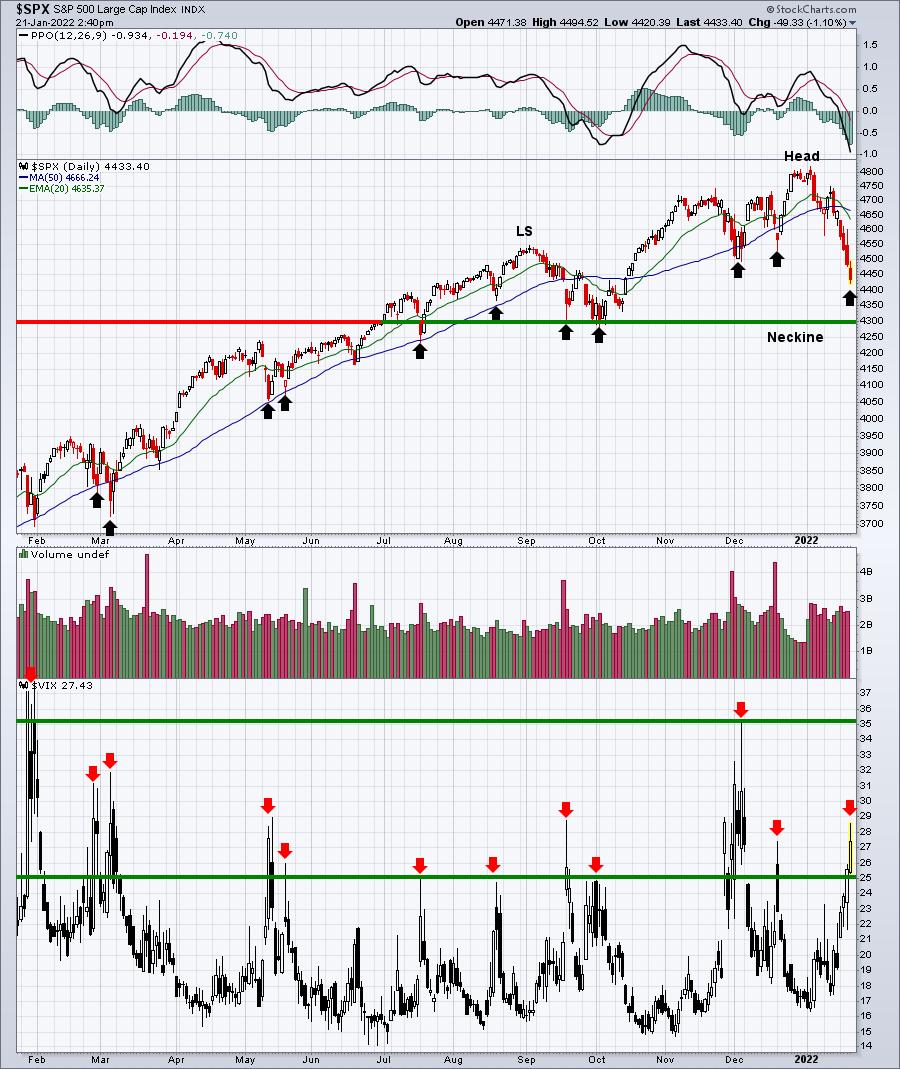
We could be hitting that bottom today as you can already see the VIX spiking well above the 25 level that has marked bottoms in the past. However, I see a longer-term head & shoulders pattern that we should monitor. I believe we'll see an intraday piercing of support at 4300 that will very likely mark a short- to intermediate-term bottom. Eventually, I expect we'll break that and the measurement will take us down to roughly 3800 or so to mark the low of 2022. Let the building pessimism over the next several weeks play right into our hands, that's what I'm planning to do.
Sector/Industry Focus
Do you remember recently when I discussed how I put together the Strong Future Earnings ChartList (SFECL)? I pointed out the industry groups showing relative strength and those showing deteriorating relative strength. One of those latter groups was internet ($DJUSNS). Yesterday, Netflix (NFLX), one of the worst relative performers in that group reported earnings. It was abysmal and I'm pretty sure I spent time discussing that at last week's Sneak Preview - Q1 Earnings webinar. Well, NFLX reported results and NOW we see why Wall Street was exiting this streaming giant in droves. Check out the chart:
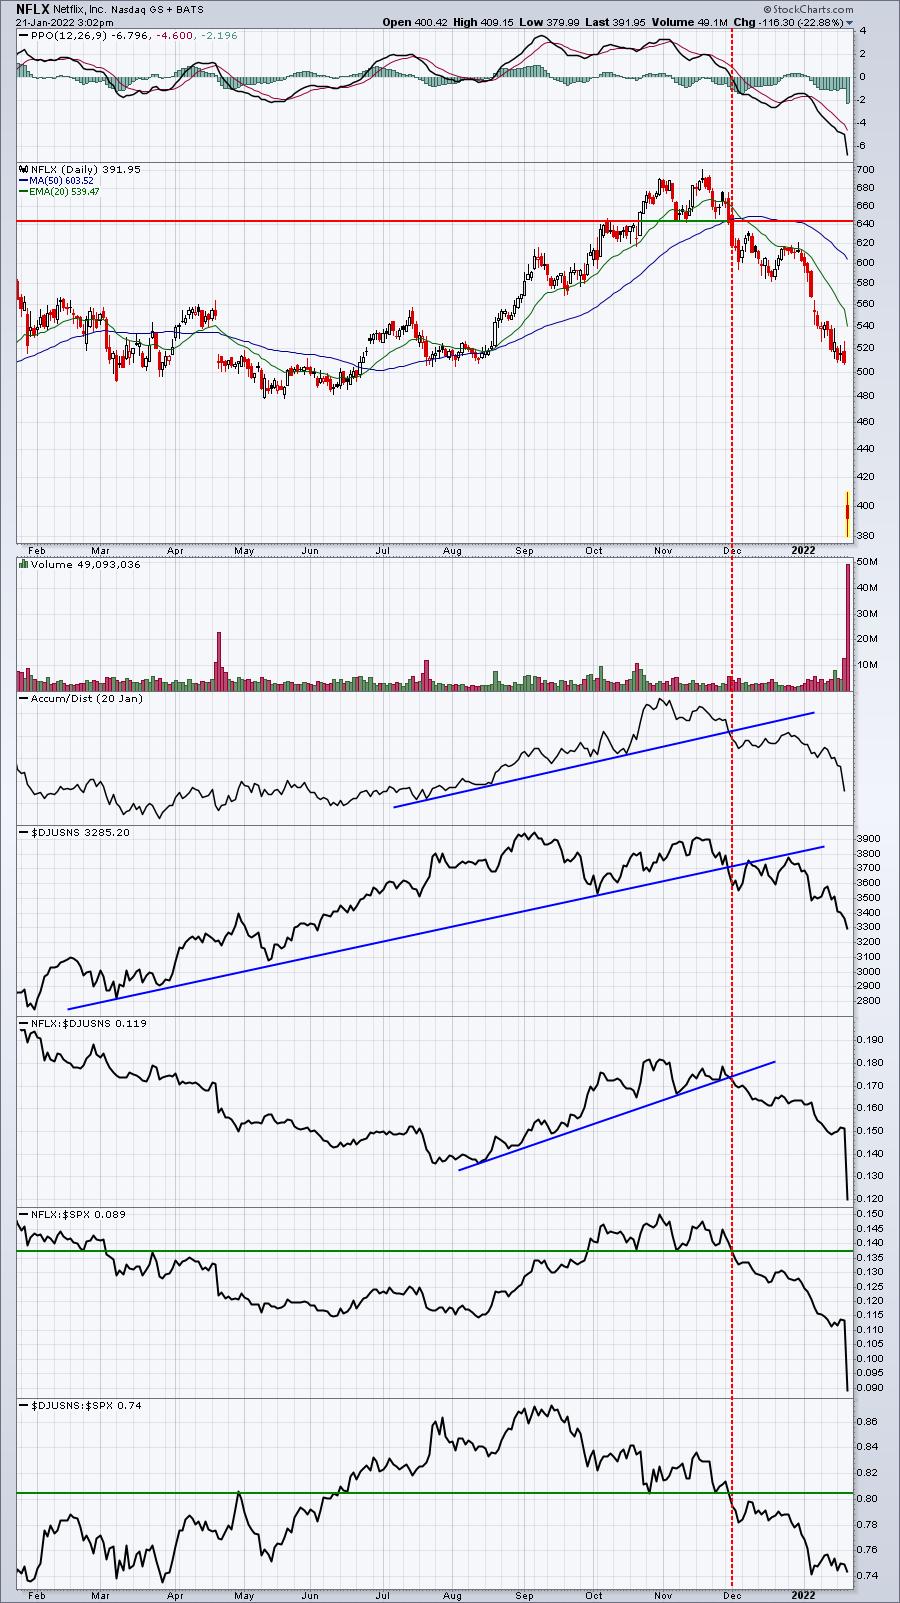
When I say that relative strength is the most important thing in technical analysis, I want you to remember this chart. Beginning in early December, everything changed technically for NFLX. Internet stocks continued falling, losing key relative price support (bottom panel), while simultaneously losing absolute trendline support (panel below AD line). The uptrend in the AD line broke down. NFLX relative strength fell apart vs. its internet peers and it also lost relative support vs. the S&P 500. It all unraveled at the same time. We should not ever make excuses for a stock that does this. Never. Even if it goes back up, it doesn't matter. Signals like this should never be ignored. Relative strength is extremely important in everyone's regular analysis.
ChartLists/Strategies
The market is simply too dangerous for me right now. I traded a little bit around options expiration and our max pain candidates, but I'm done with that for now. I have zero positions in my trading account as I simply watch the action. If I miss a short trade, so be it. If I miss a long trade, so be it. What I know for a fact is that I can't lose a dime sitting in cash. I'll let everyone else try to play the role of a super hero.
Earnings Reports
Here are the key earnings reports for the next two days, featuring stocks with market caps of more than $10 billion. I also include a few select companies with market caps below $10 billion. Finally, any portfolio stocks that will be reporting results are highlighted in BOLD. If you decide to hold a stock into earnings, please understand the significant short-term risk that you are taking. Please be sure to check for earnings dates for any companies you own or are considering owning.
Friday, January 21:
SLB, INFO, HBAN, ALLY
Monday, January 24:
IBM, PHG, HAL, BRO, ELS, LOGI, STLD, ZION, CR
Economic Reports
December leading indicators: +0.8% (actual) vs. +0.7% (estimate)
Happy trading!
Tom