
EB Daily Market Report - Tuesday, January 25, 2022
ChartLists Updated
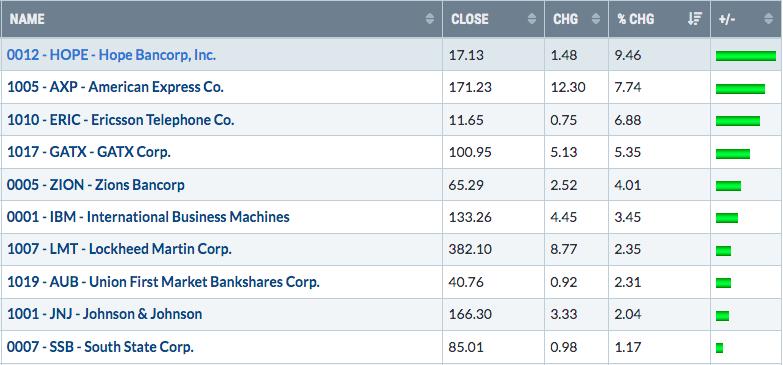
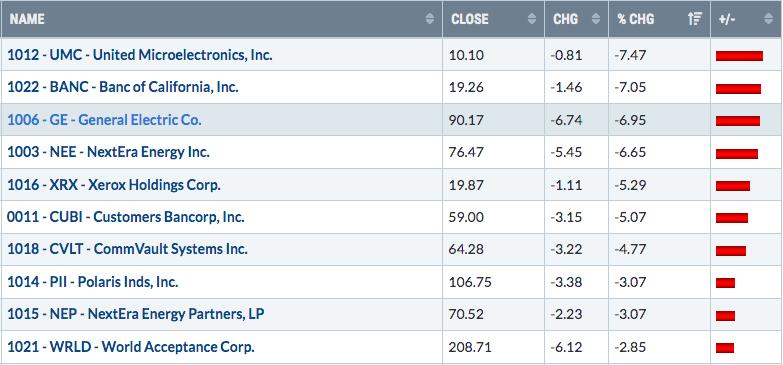
Just as a reminder, we put together "Upcoming Earnings" ChartLists for each day of the week. They can be found on our website on the ChartLists page. The benefit of these ChartLists is that, for every day, we can quickly see which companies are performing well (or poorly) after reporting earnings. For instance, the ChartList for today has companies on it that reported after yesterday's close (like IBM) AND before today's open (like GE). By pulling up this ChartList in Summary form, you can quickly identify the big earnings movers. Below are the best and worst intraday moves:
BEST:
WORST:
I think it's a great way to quickly identify earnings winners, especially if you look at this ChartList shortly after the stock market opens.
Also, a new Earnings tool - the Upcoming Earnings Relative Strength ChartList - identifies all the week's earnings in one ChartList AND it's on a relative basis - each stock vs. its peer group. By pulling up this ChartList in Summary form for say the past month, you can zero in quickly on which companies will be reporting that Wall Street has anointed a leader (or laggard). I think it's a great addition to our research products.
I'm working on getting these ChartLists to Erin Webber, who should have our site updated later today.
Executive Market Summary
- Futures were very weak overnight, continuing the building downside momentum here in January
- Cryptocurrencies are bouncing slightly today after their huge decline of late; bitcoin ($BTCUSD) seems to be heading for a major support test at 30000
- Gold ($GOLD) is up slightly to $1850 per ounce, nearing a key overhead test from $1875-$1880 - more on gold below
- Crude oil ($WTIC, +2.10%) is jumping and is back above $85 per barrel, leading energy (XLE, +1.91%) higher
- The 10-year treasury yield ($TNX) is up 2 basis points to 1.76%, providing a boost to financials (XLF, -0.70%), which is the 2nd best performing sector today
- Technology (XLK, -2.96%) and consumer discretionary (XLY, -2.60%) are the primary laggards
- Semiconductors ($DJUSSC, -4.24%) are a major drag on technology, with many key names like NVDA and AMD down more than 5%
- Microsoft (MSFT, -2.83%) is on deck to report quarterly results after the close today
Market Outlook
We saw a massive recovery yesterday after the Volatility Index ($VIX) reached 38-39, a level that's tested very, very infrequently. It was a signal that this bout of selling had reached a panicked stage, where we normally see violent reversals. That's exactly what we saw yesterday. But overnight, futures weakened and we're seeing mostly big losses again today.
Below is a 4-week 15-minute chart that highlights not only the S&P 500, but also many of the key ratios that I like to follow. I just wanted to see if we're seeing reversals in any of these key ratios and, quite honestly, we are not. Here's the chart:
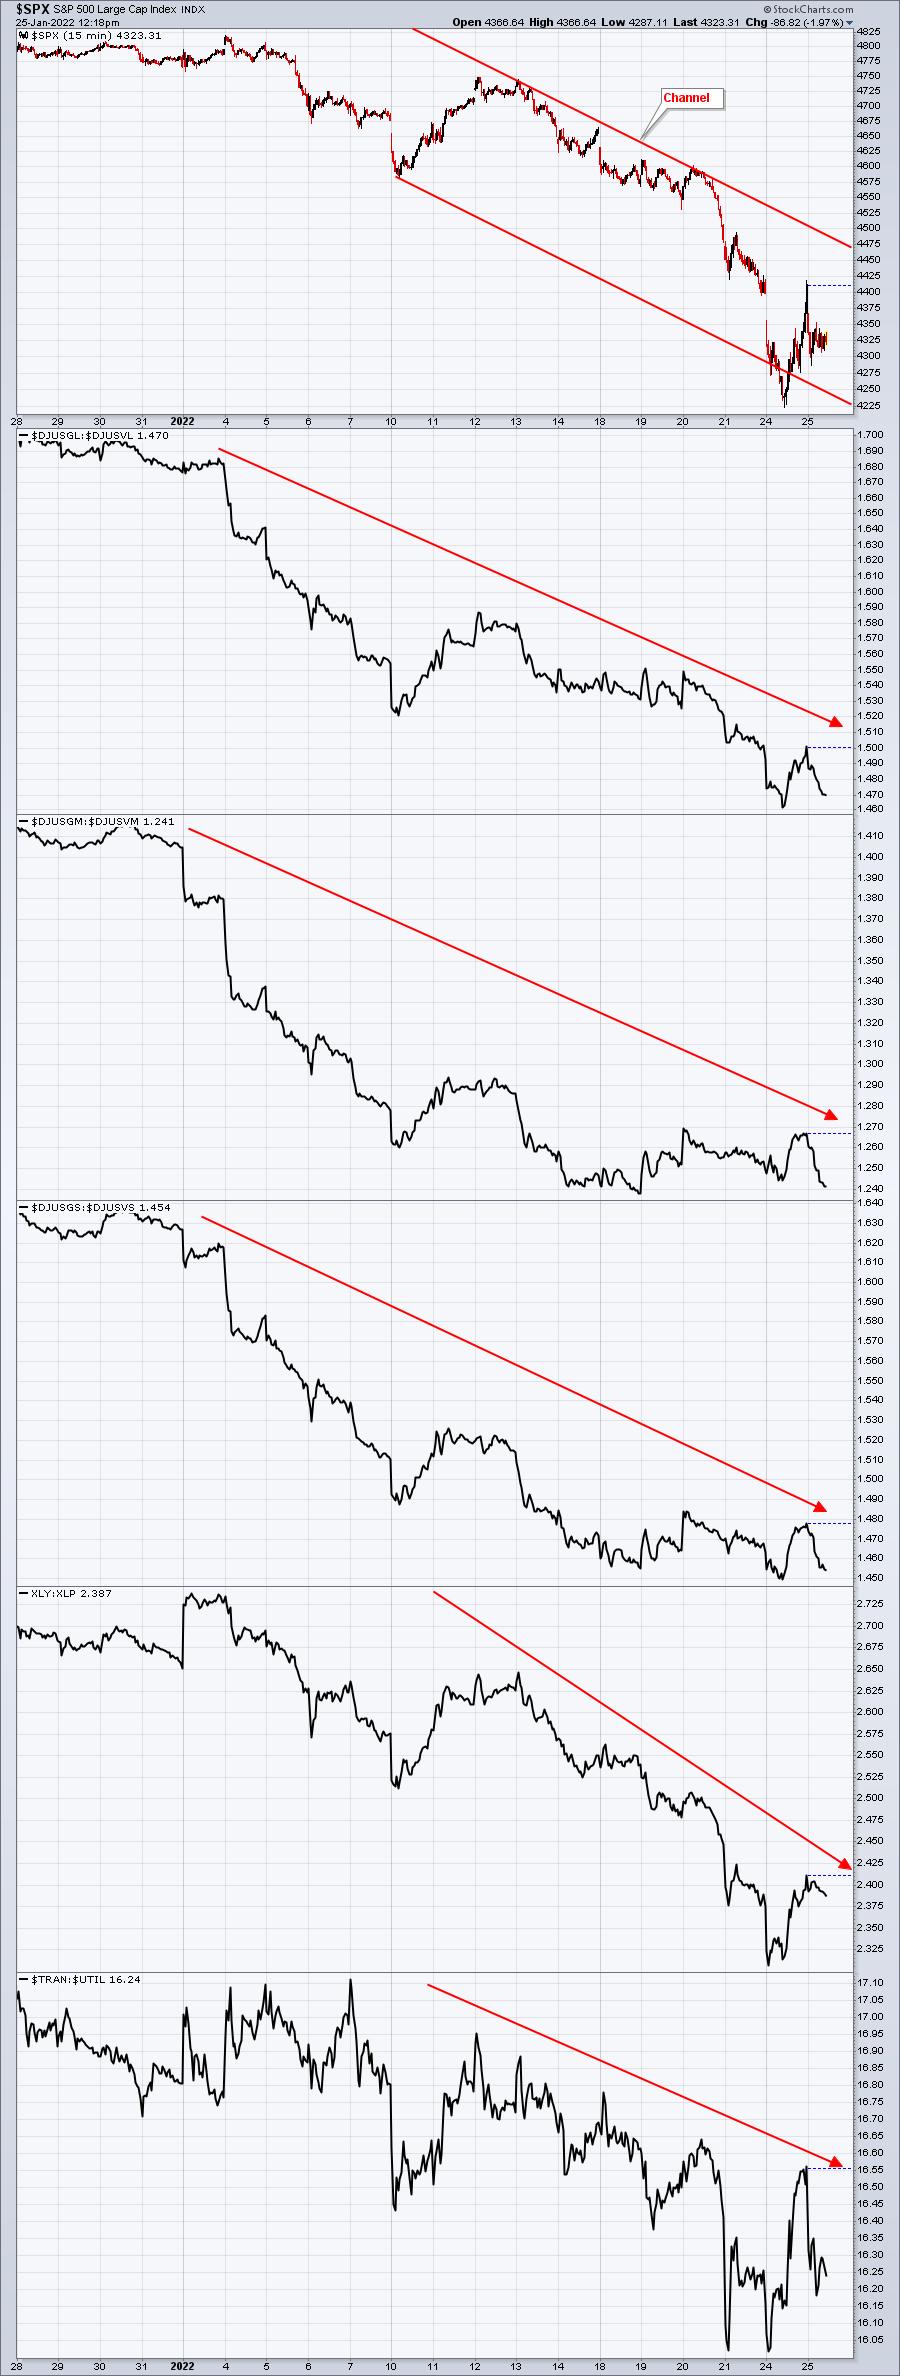
The primary signal this gives me is that the current downtrend is very likely sustainable. That doesn't mean we'll go down every day. Instead, it tells me to sell into any short-term strength as it's likely (not guaranteed) that we'll see new lows ahead.
We've already lost a lot in a short period of time, so maybe the market simply wants to get past this Fed meeting tomorrow at 2pm ET. I wouldn't be surprised to see one more breakdown with the Fed announcement, then start a bit more of a sustained rally. Eventually, however, I see rally attempts failing and new lows ahead.
Sector/Industry Focus
I like gold (GLD) in the short- to intermediate-term, but not because of inflationary concerns. High and rising volatility and fear has a history of leading to gold outperforming stocks (GLD:$SPX). Check out this chart for an illustration:
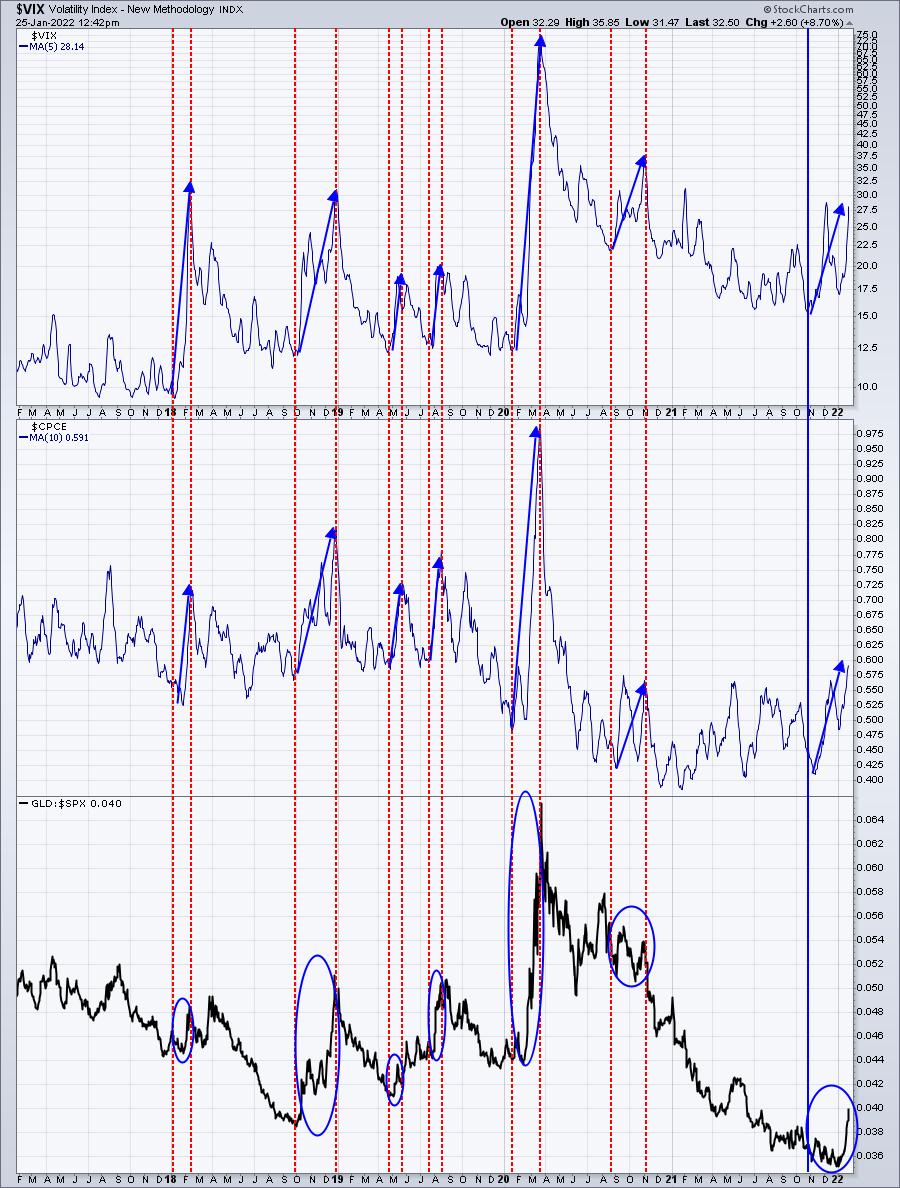
I believe sentiment needs to be reset higher very badly. We've gone through an unprecedented period of extreme complacency on the CPCE. That needs to be adjusted. As the CPCE works higher over time, I expect it to translate into GLD significantly outperforming the S&P 500. Also, I simply like the pattern on GLD as well:
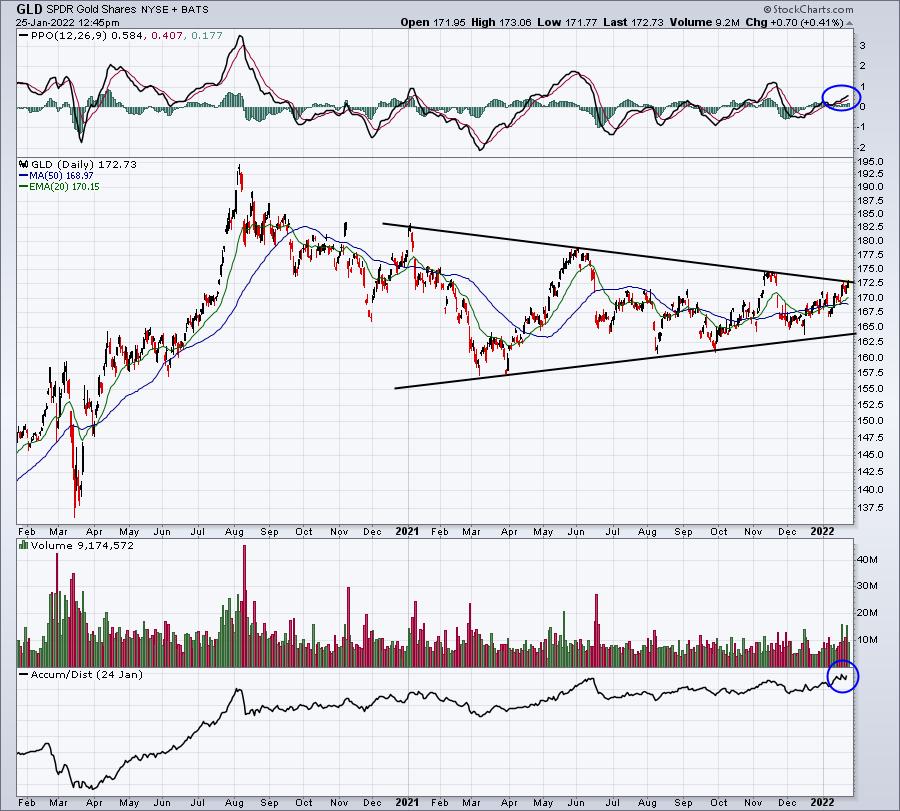
The PPO is now above its centerline and pointing higher as bullish momentum begins to build. Also note that the AD line is near its 52-week high, indicative of Wall Street accumulation. Technically, I just need to see GLD clear the upper resistance of this symmetrical triangle. I'm already in the GLD, expecting this breakout to confirm what I'm already seeing and expecting from the earlier chart on sentiment.
ChartLists/Strategies
Trying to guess the market's next move is such a difficult game. When the VIX is in the 20s and 30s, possibly even into the 40s, nothing is predictable. Whipsaws occur in both directions, so unless a trade is extremely compelling, I tend to err on the side of caution simply because of a lack of confidence. Also, when the emotions are running high, key technical support levels are not nearly as meaningful. Most markets will bottom when sentiment reaches extreme levels, not when a moving average or a prior price support level is tested. That's what makes buying during panicked selloffs so difficult and risky.
Based on the analysis of gold earlier, I favor a position in gold (GLD). At this moment, it's the only thing I own. Some don't understand what I mean by short-term bearish, long-term bullish, so let me try to clarify.
If you asked me:
- Would you buy or sell the SPY if you had to exit in 3-5 days? I'd say BUY (we're beaten down with a high VIX, so I think the more likely short-term direction is higher, especially once the Fed meeting is behind us).
- Would you buy or sell the SPY if you had to exit in 2-3 months? I'd say SELL, because sentiment has a long way to go before hitting more pessimistic levels, which is where significant rallies typically begin.
- Would you buy or sell the SPY if you had to exit 1 year from now? I'd say BUY, because I believe we're in a secular bull market. Once the current cyclical bear market plays out, I look for U.S. equities to move back to fresh all-time highs. A year from now, I see the S&P 500 back over 5000.
The bottom line is that I believe selling over the next 3-6 months is going to set the stage for a significant rally. All of this is just my opinion and COULD CHANGE IF CONDITIONS CHANGE.
Earnings Reports
Here are the key earnings reports for the next two days, featuring stocks with market caps of more than $10 billion. I also include a few select companies with market caps below $10 billion. Finally, any portfolio stocks that will be reporting results are highlighted in BOLD. If you decide to hold a stock into earnings, please understand the significant short-term risk that you are taking. Please be sure to check for earnings dates for any companies you own or are considering owning.
Tuesday, January 25:
MSFT, JNJ, VZ, TXN, NEE, RTX, AXP, GE, LMT, MMM, CNI, COF, ADM, ERIC, PCAR, UMC, BXP, FFIV, CTXS, IVZ, RNR, PII, SLGN, XRX, NAVI, CVLT, NXGN, LRN
Wednesday, January 26:
TSLA, ABT, INTC, T, BA, ANTM, NOW, ADP, LRCX, CCI, EW, NSC, FCX, VRTX, GD, TEL, KMB, XLNX, APH, AMP, LVS, CHT, GLW, NDAQ, HES, TER, DRE, URI, STX, RJF, ROL, XM, MKTX, PTC, PKG, WHR, WOLF, AZPN, KNX, MKSI, LEVI, CACI, SLM, HXL, MTH, SIMO, CALX, LC
Economic Reports
November Case-Shiller home price index: +1.2% (actual) vs. +1.0% (estimate)
November FHFA house price index: +1.1% (actual) vs. +1.0% (estimate)
January consumer confidence: 113.8 (actual) vs. 111.9 (estimate)
Fed meeting began today with a policy statement expected at 2:00pm ET on Wednesday
Happy trading!
Tom