
EB Daily Market Report - Wednesday, January 26, 2022
Executive Market Summary
- Futures were very strong overnight as the bulls look to retaliate near-term for the vicious selling of late
- Microsoft (MSFT, +4.94%) is lifting the beleaguered software group ($DJUSSW, +3.62%), posting quarterly results above expectations
- Technology (XLK, +2.92%) and consumer discretionary (XLY, +1.73%) are rebounding today after leading our major indices lower the past 1-2 months
- All 11 sectors are higher, but consumer staples (XLP, +0.08%) is the primary laggard
- Cryptocurrencies are also rebounding, with etherium ($ETHUSD, +6.75%) leading the charge
- Gold ($GOLD, -1.23%) is down ahead of today's Fed policy statement
- Crude oil prices ($WTIC, +2.49%) are jumping back above $87 per barrel, lifting energy (XLE, +1.04%)
- While the Federal Reserve is not expected to hike interest rates today, most market participants will be anxious to hear the latest statement, looking for new hawkish or dovish wording
- Tesla (TSLA, +3.85%) will be reporting its latest quarterly results after the bell today; thus far, TSLA has been holding key price support near 900
Market Outlook
I'm going to draw a couple pictures (charts) today to give you an idea of the wide, short-term trading range that we can expect with a breakdown underway, but with very high volatility readings. First, let's simply start with the S&P 500 and the potential head & shoulders pattern that we'll need to monitor carefully:
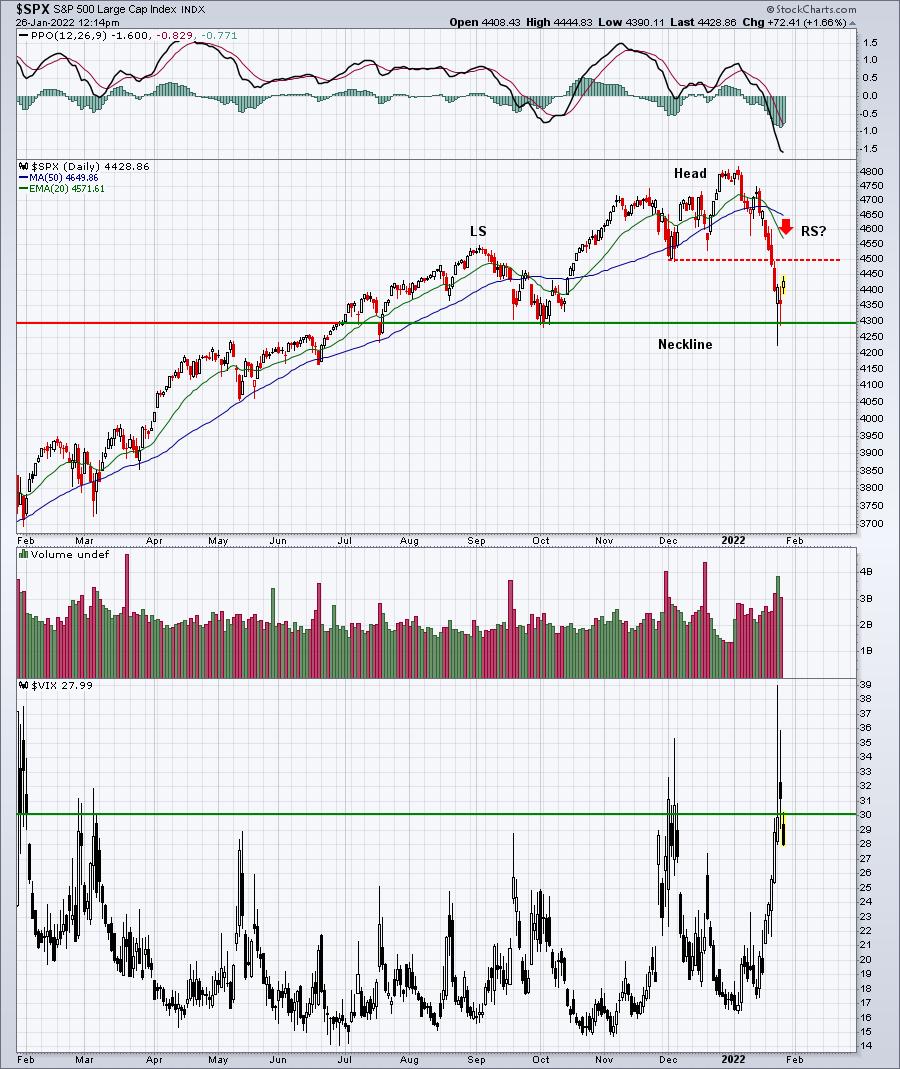
We're bouncing nicely today, but is this simply a trap? Is it a right shoulder printing before our very eyes? The 4500 price resistance, along with the 20-day EMA, currently near 4570, are the two key areas where I'd be looking for a reversal.
If you're interested in what the Fibonacci retracement levels look like, well look no further:
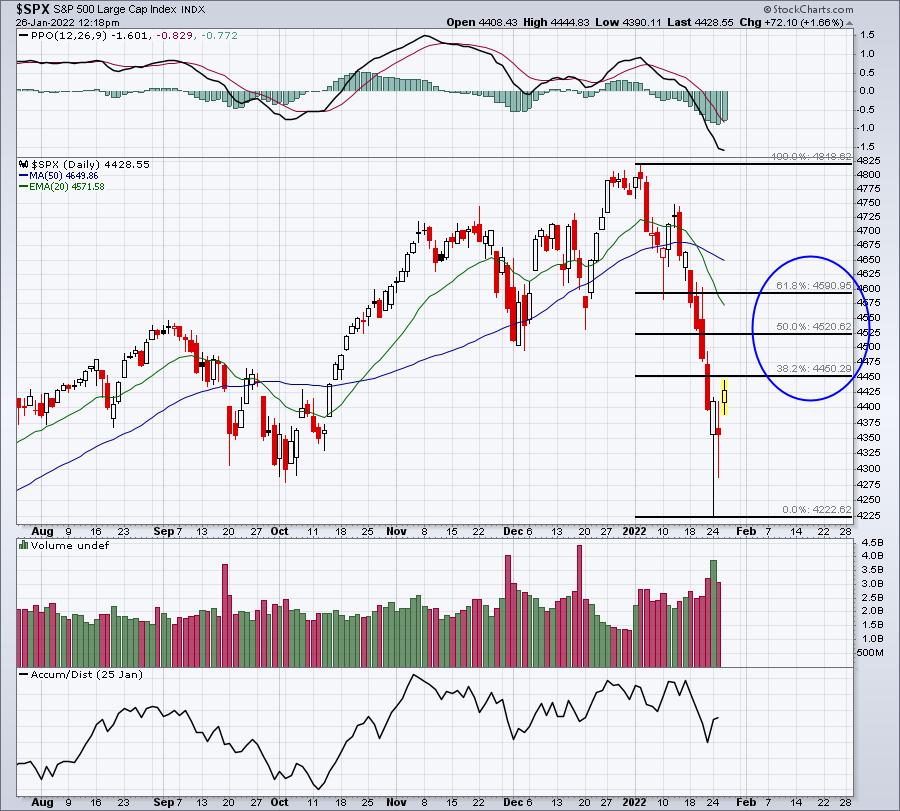
Again, we're looking in a similar area. Today's high nearly reached the initial 38.2% retracement level at 4450. 4520 and 4590 would represent the next two levels. Given the price resistance at 4500 and the 20-day EMA at 4570, that provides us four different possible resistance levels from 4500-4590. I'm expecting another reversal to the downside to kick in somewhere in that range - if not before. So we have another 1-3% of upside perhaps?
Should the S&P 500 continue rallying and close back above 4600, the argument would change to more of a sideways consolidating market, rather than a downtrending one. Let's take it one step at a time here.
Sector/Industry Focus
Software ($DJUSSW, +3.62%) is trying to rally on the heels of the MSFT quarterly earnings report. Using Fibonacci once again, here's what we can potentially look for if the DJUSSW continues to rally:
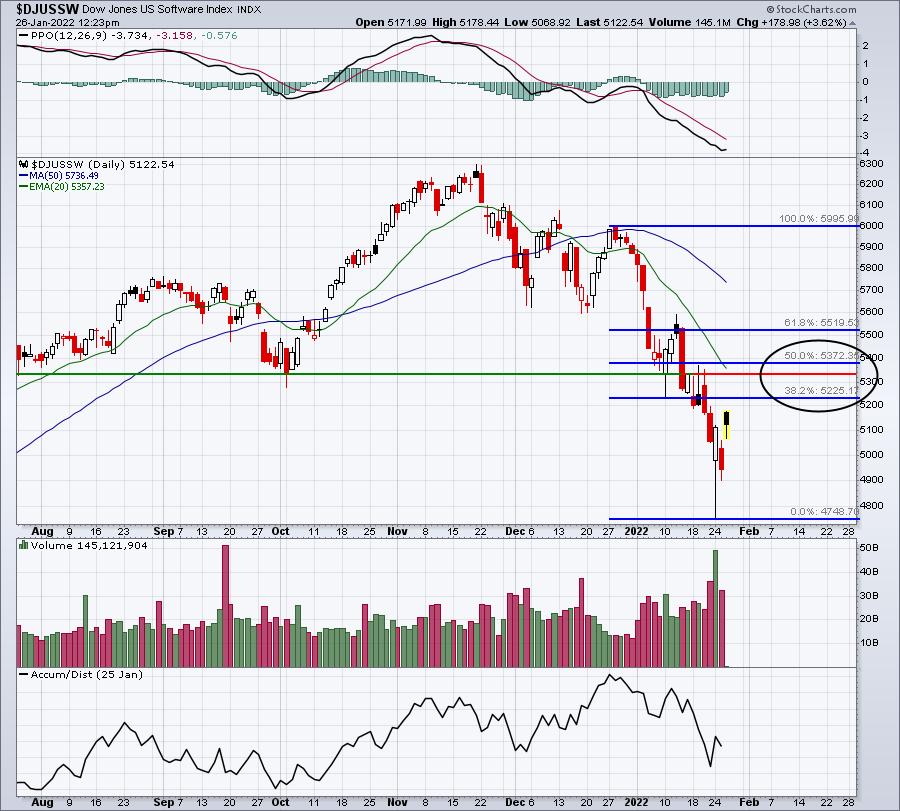
Because software has been very weak on a relative basis, I'd only expect a 38.2% or 50.0% Fibonacci retracement. So if the market stays bullish for the next few days, the DJUSSW could top out somewhere in the 5225-5375 range. We're currently trading at 5122. So anywhere from another 2-5% rally would be best case scenario IF we're truly in a downtrending market.
ChartLists/Strategies
Gold (GLD) is down ahead of the Fed announcement. I don't want to paint the GLD as a "safe" investment. Many times, it can move significantly after a Fed announcement. Below is a chart that highlights the day of a Fed announcement (black-dotted vertical line) so that you can see subsequent moves in gold, which can be quite volatile:
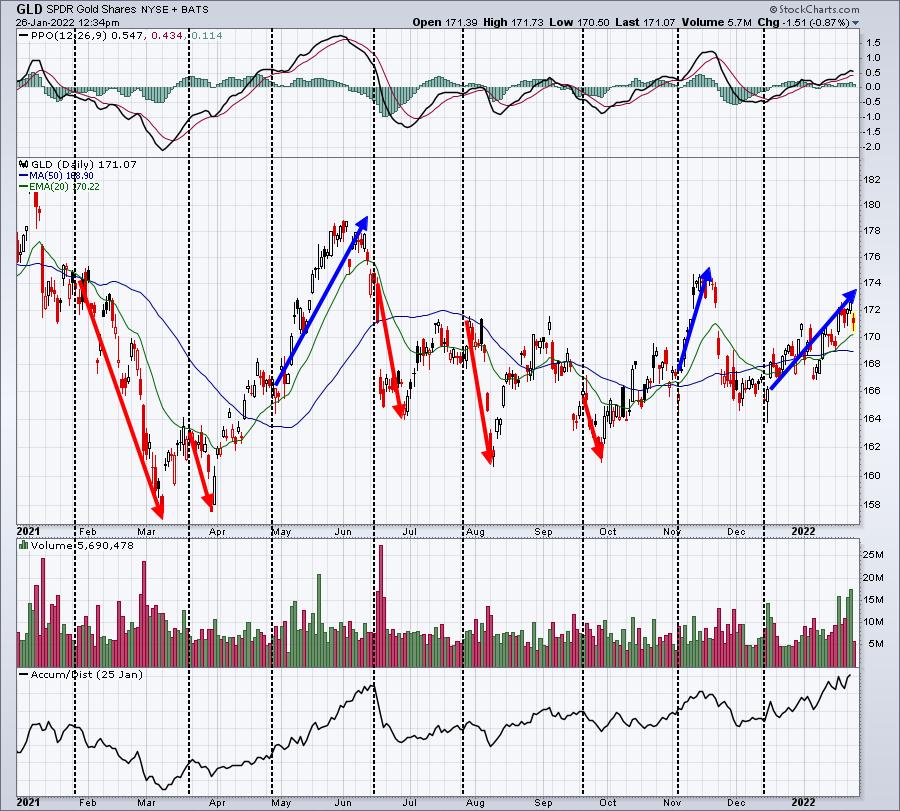
I like GLD as long as it's trading and closing above its 20-day EMA. Momentum currently is strong and the AD line suggests that I'm not the only one buying. However, if GLD is weak after today's Fed meeting, I have no problems taking a small loss and exiting into today's close. The 20-day EMA will be my line in the sand. I'm not married to any positions. I can always get back in later if I choose.
I just wanted to be sure to point this out as the GLD can be extremely volatile after a Fed meeting. It's certainly not for everyone.
Earnings Reports
Here are the key earnings reports for the next two days, featuring stocks with market caps of more than $10 billion. I also include a few select companies with market caps below $10 billion. Finally, any portfolio stocks that will be reporting results are highlighted in BOLD. If you decide to hold a stock into earnings, please understand the significant short-term risk that you are taking. Please be sure to check for earnings dates for any companies you own or are considering owning.
Wednesday, January 26:
TSLA, ABT, INTC, T, BA, ANTM, NOW, ADP, LRCX, CCI, EW, NSC, FCX, VRTX, GD, TEL, KMB, XLNX, APH, AMP, LVS, CHT, GLW, NDAQ, HES, TER, DRE, URI, STX, RJF, ROL, XM, MKTX, PTC, PKG, WHR, WOLF, AZPN, KNX, MKSI, LEVI, CACI, SLM, HXL, MTH, SIMO, CALX, LC
Thursday, January 27:
AAPL, V, MA, CMCSA, DHR, MCD, SAP, SYK, MDLZ, MO, MMC, BX, SHW, HCA, TEAM, CP, NOC, KLAC, DOW, MSCI, STM, XEL, TROW, ROK, RMD, VLO, AJG, BLL, NUE, CAJ, LUV, MKC, RCI, DOV, TSCO, TDY, IP, CE, WDC, EMN, TXT, WRB, RHI, AOS, EWBC, WAL, FICO, JNPR, CFR, OLN, ALK, EXP, NATI, X, MUR, JBLU, MTSI, KEX, ADS, BOOT, EXTR, FLWS
Economic Reports
December new home sales: 811,000 (actual) vs. 760,000 (estimate)
FOMC policy statement at 2:00pm ET
Happy trading!
Tom