
EB Daily Market Report - Thursday, January 27, 2022
Executive Market Summary
- Futures completely did an about face overnight, moving from deep red to solid green as the market opened
- Earnings results weren't awful, but earnings reactions have been
- Intel (INTC, -7.09%) and Lam Research (LRCX, -7.43%) are hurting the semiconductor group ($DJUSSC, -4.31%), despite both posting better-than-expected EPS; LRCX did miss its revenue estimate
- Tesla (TSLA, -11.17%) is seeing a TON of selling, despite crushing EPS estimates, $2.54 vs. $2.11
- Cryptocurrencies are also under pressure again, as etherium ($ETHUSD, -5.11%) takes another hit, threatening to close at its lowest level since July
- Commodities are under pressure as well, with gold ($GOLD, -2.02%) falling $37 per ounce; silver ($SILVER) is down nearly 5%
- Crude oil ($WTIC, -1.00%) is even down, a rarity of late, though energy (XLE, +0.11%) clings to a small gain
- Defensive sectors are clearly outperforming as utilities (XLU, +0.63%) and consumer staples (XLP, +0.52%) lead
- Meanwhile, it's another beating for consumer discretionary (XLY, -2.59%), led lower by TSLA and autos ($DJUSAU, -9.57%)
Market Outlook
The Fed is bound and determined to fight (the ghost of) inflation and announced that Wall Street should expect a rate hike at the March Fed meeting. As far as I'm concerned, the announcement of this hawkish policy nearly cements a cyclical bear market (20% drop). Did you see the market's reaction? If not, let me show you:
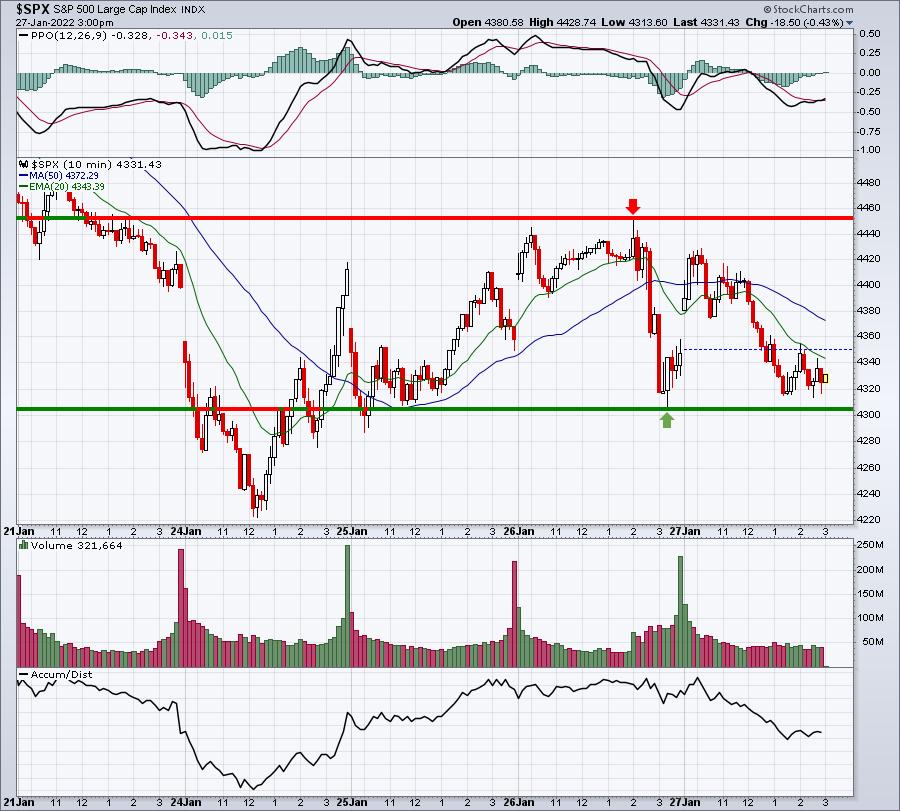
The short-term trading range was established at the 2pm ET high on Wednesday, just after the Fed announcement. That high was approximately 4453. The low, a little more than an hour later after an bear ambush, was 4304. Keep in mind that the daily chart also shows a key neckline at 4300. That area is BIG to the downside and we're not that far from it this afternoon.
Sector/Industry Focus
One key inflationary component is capacity utilization. It tells us how much of our resources is currently being used to produce our current level of output. I highlighted this on my Trading Places LIVE show at StockCharts TV this morning. If you didn't get a chance to see this, I wanted to share it:
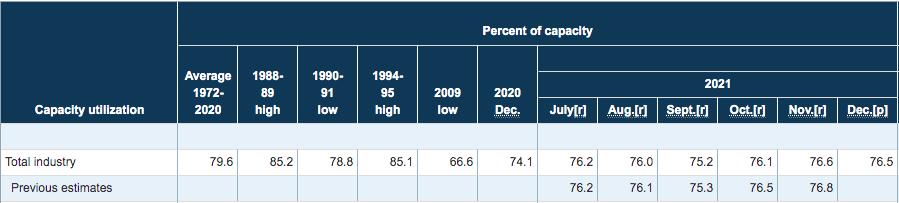
This table is from the Federal Reserve website. Notice on the left side that the AVERAGE capacity utilization over the 48 years from 1972 to 2020 was 79.6. Over the past several months, our capacity utilization is in the 75-76 range. Does this sound like an economy on the verge of overheating? I realize this is just one factor in inflation, but it's a fairly big one. I simply believe the Fed should be taking the stance of let's wait and see. They know the supply chain issues have resulted in excess demand, which is driving prices higher. I'd expect them to acknowledge the inflationary pressures without committing, at this point, to using Fed policy.
Honestly, I don't believe Wall Street is impressed at all with this current Fed. "Geronimo" Powell has now overreacted a second time to data - the first was in Q4 2018, when Powell raised rates and declared "two more hikes" were coming in 2019. That stock market lost about 9% in the next 4 trading days before finally recovering. The next Fed move came in July 2019, when the Fed CUT rates instead of raising them.
I don't see multiple rate hikes coming. If we do, then you can probably count on a recession in the second half of this year. Because as demand subsides naturally and the supply chain issues play "catch up", the last thing this economy will need are multiple rate hikes. Time will tell who's right and who's wrong. I know Geronimo's track record, though, and I wouldn't trust him to get this right. Neither does Wall Street.
ChartLists/Strategies
I'm sitting on my hands and staying in cash. I have no desire to try and guess whether we're going to get that bounce on the S&P 500 to 4500-4600. I look at it this way. I can buy a lot more with my cash if prices decline. So while I'm not "earning" anything, my purchasing power is increasing as the S&P 500 drops.
Earnings Reports
Here are the key earnings reports for the next two days, featuring stocks with market caps of more than $10 billion. I also include a few select companies with market caps below $10 billion. Finally, any portfolio stocks that will be reporting results are highlighted in BOLD. If you decide to hold a stock into earnings, please understand the significant short-term risk that you are taking. Please be sure to check for earnings dates for any companies you own or are considering owning.
Thursday, January 27:
AAPL, V, MA, CMCSA, DHR, MCD, SAP, SYK, MDLZ, MO, MMC, BX, SHW, HCA, TEAM, CP, NOC, KLAC, DOW, MSCI, STM, XEL, TROW, ROK, RMD, VLO, AJG, BLL, NUE, CAJ, LUV, MKC, RCI, DOV, TSCO, TDY, IP, CE, WDC, EMN, TXT, WRB, RHI, AOS, EWBC, WAL, FICO, JNPR, CFR, OLN, ALK, EXP, NATI, X, MUR, JBLU, MTSI, KEX, ADS, BOOT, EXTR, FLWS
Friday, January 28:
CVX, CAT, CHTR, CL, PSX, LYB, WY, VFC, SYF, CHD, BAH, RDY, ALV, GNTX, BMI
Economic Reports
Initial jobless claims: 260,000 (actual) vs. 265,000 (estimate)
December durable goods: -0.9% (actual) vs. -0.5% (estimate)
December durable goods ex-transports: +0.4% (actual) vs. +0.4% (estimate)
Q4 GDP (initial estimate): 6.9% (actual) vs. 5.7% (estimate)
December pending home sales: -3.8% (actual) vs. +0.6% (estimate)
Happy trading!
Tom