
EB Daily Market Report - Monday, January 31, 2022
ChartLists Updated
A number of our ChartLists were updated over the weekend. They are as follows:
- Strong Earnings ChartList (SECL)
- Strong Future Earnings ChartList (SFECL)
- Strong AD ChartList (SADCL)
- Short Squeeze ChartList (SSCL)
- Upcoming Earnings ChartLists - all 5 days this week
- Upcoming Earnings Relative Strength ChartList - all earnings this week in relative strength form
Between today and tomorrow, I hope to have both the Raised Guidance ChartList (RGCL) and Bullish Trifecta ChartList (BTCL) updated.
Executive Market Summary
- Futures were mixed overnight, but the NASDAQ (and growth stocks) have shown leadership all day
- Most commodities are higher, including both crude oil ($WTIC, +1.00%) and gold ($GOLD, +0.63%)
- Aiding gold is a falling dollar as the UUP sees profit taking after last week's 52-week high
- Consumer discretionary (XLY, +3.16%) is having a very solid day, led by automobiles ($DJUSAU, +8.66%); Tesla (TSLA) is rebounding nearly 10% on the session
- Specialty retailers ($DJUSRS, +4.53%) are cruising today after enduring an absolutely brutal January
- All 11 sectors are higher today, though defensive sectors like consumer staples (XLP, +0.41%) and health care (XLV, +0.53%) are underperforming
- January 2022 will close out as the worst calendar month for U.S. equities since March 2020, when the pandemic began
- Boeing (BA, +4.62%) is leading the Dow Jones higher after holding key price support just below 190 on Friday
Market Outlook
I show a lot of relative strength charts, particularly when I'm trying to highlight an intermarket relationship. But in order to truly see the magnitude of a major decline, it's important to view absolute charts as well. Small cap growth stocks ($DJUSGS) have been beaten up so badly over the past year and you can see the carnage quite clearly on this chart:
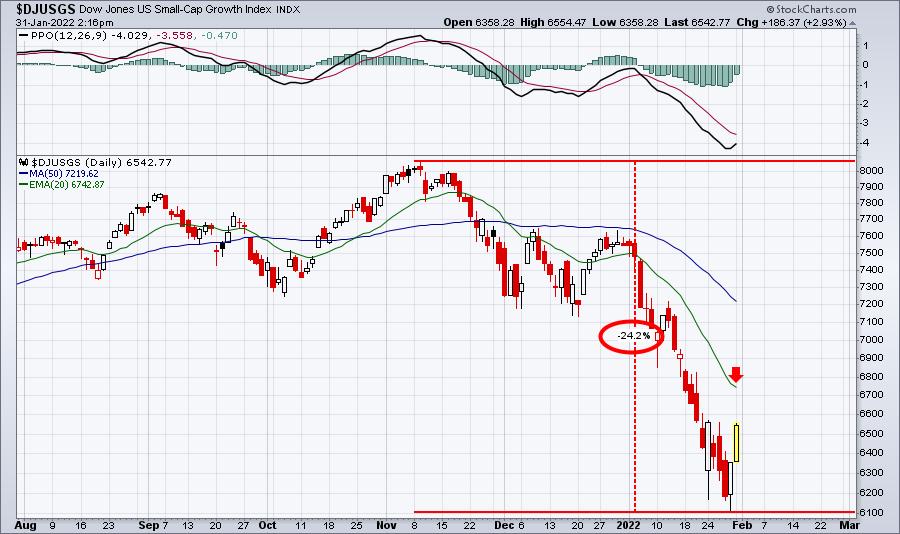
I've been discussing my belief that the S&P 500 will suffer through a cyclical bear market in 2022, which is defined as a 20% drop. Well look at the DJUSGS! It already lost 24% from its November high through Friday's low.
Sector/Industry Focus
From a Fibonacci retracement perspective, the S&P 500 is rapidly approaching its 50% retracement level of 4530. That's close to coinciding with the 20-day EMA, currently at 4528. But one look at the economically-sensitive transportation group ($TRAN) does not yield the same type of recent bounce. In fact, here's a chart of the TRAN, highlighting that its rebound has not yet reached the Fibonacci retracement level of 38.2%:
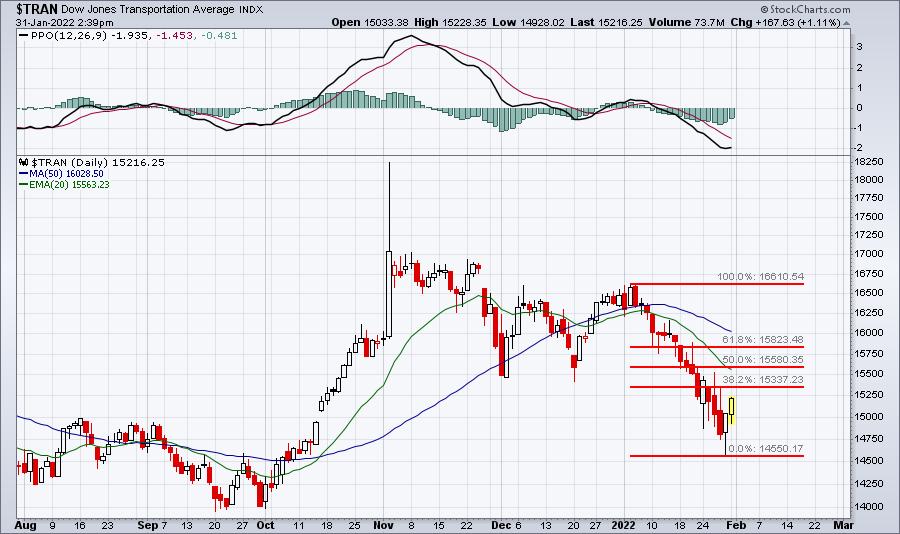
One thing this chart stresses to me is that Wall Street is not overly impressed by our economic prospects later this year. That seems to go against the multiple-rate-hike approach that the Fed is backing. Something has to give.
ChartLists/Strategies
Expect volatility to return. That makes short-term trading quite risky and even more so if you're trading the high growth stocks. Many of these stocks were being sold off at alarming rates earlier in January, while action on late Friday afternoon and today has been the exact opposite of that, with many marching considerably higher as we potentially print bearish right shoulders. Do remember, however, that head & shoulders patterns do not confirm until we see the high volume neckline breakdown. I expect that could take place in February or March. One date to keep in mind would be Thursday, February 10th. At 8:30am ET that morning, we'll get the latest CPI data. Once released, I suspect we're going to see yet another jump in the annual Core CPI rate.
If you're interested in shorting, you can use the scanning strategies on our website, but simply search for the opposite. For instance, on the 20-day EMA scan, instead of looking for a test of the 20-day EMA on a pullback, you'd be looking for a stock to move up from underneath to test its 20-day EMA. The scan criteria would look something like this:
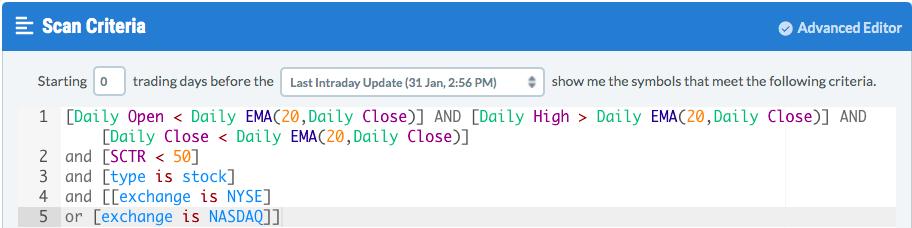
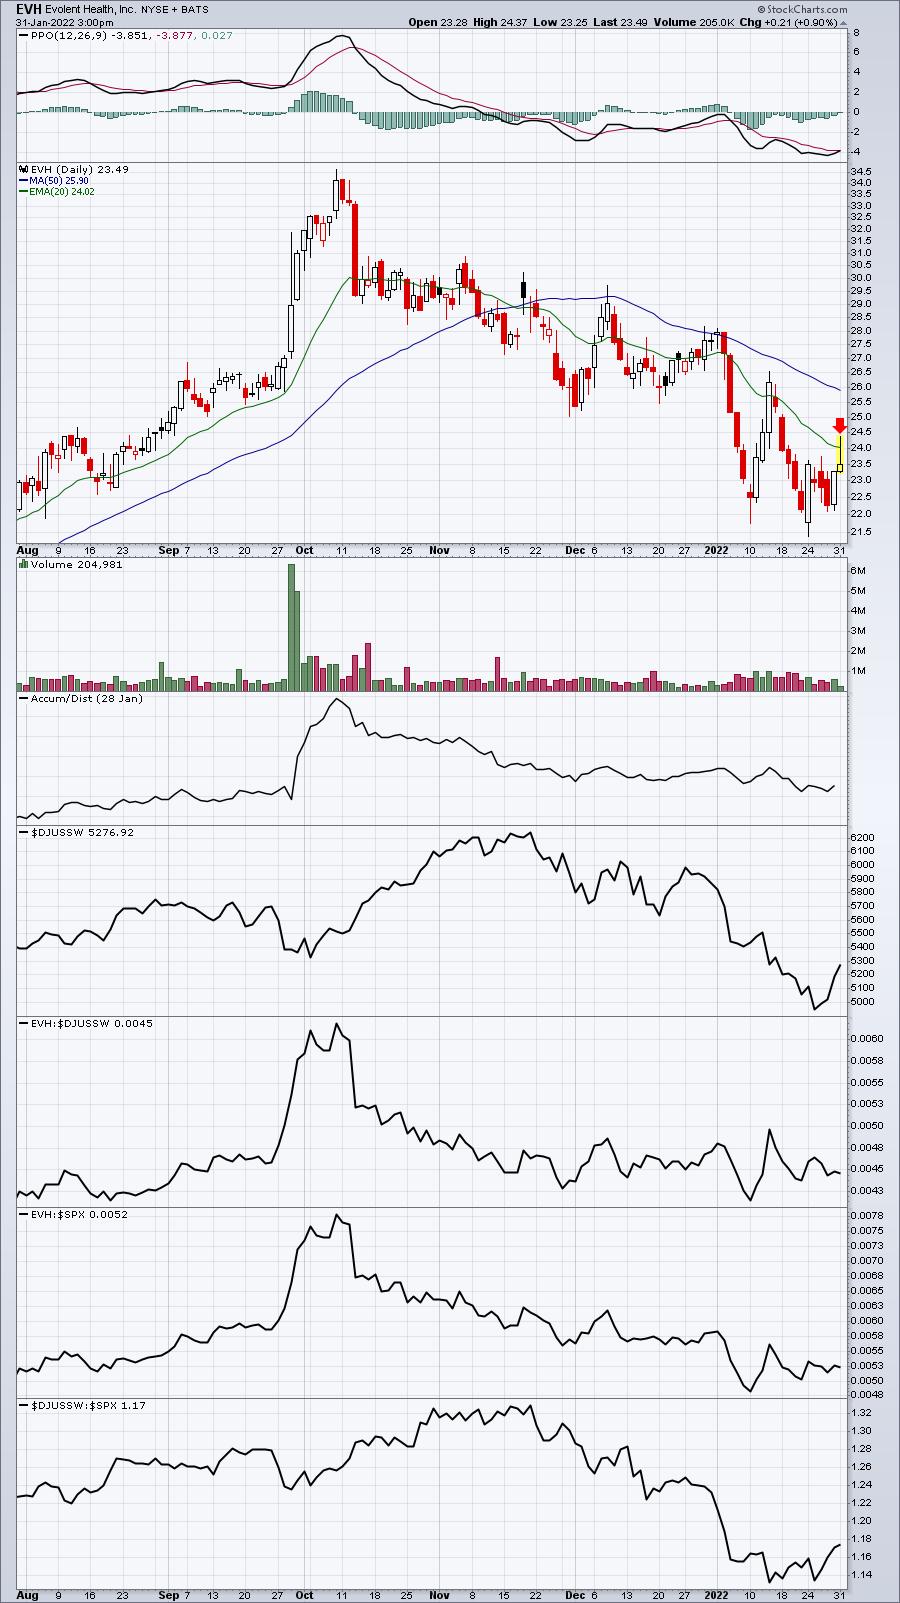
There were plenty of stocks returned from this scan, but to highlight what I'd look for to potentially short, here are two examples:
EVH:
SYNH:
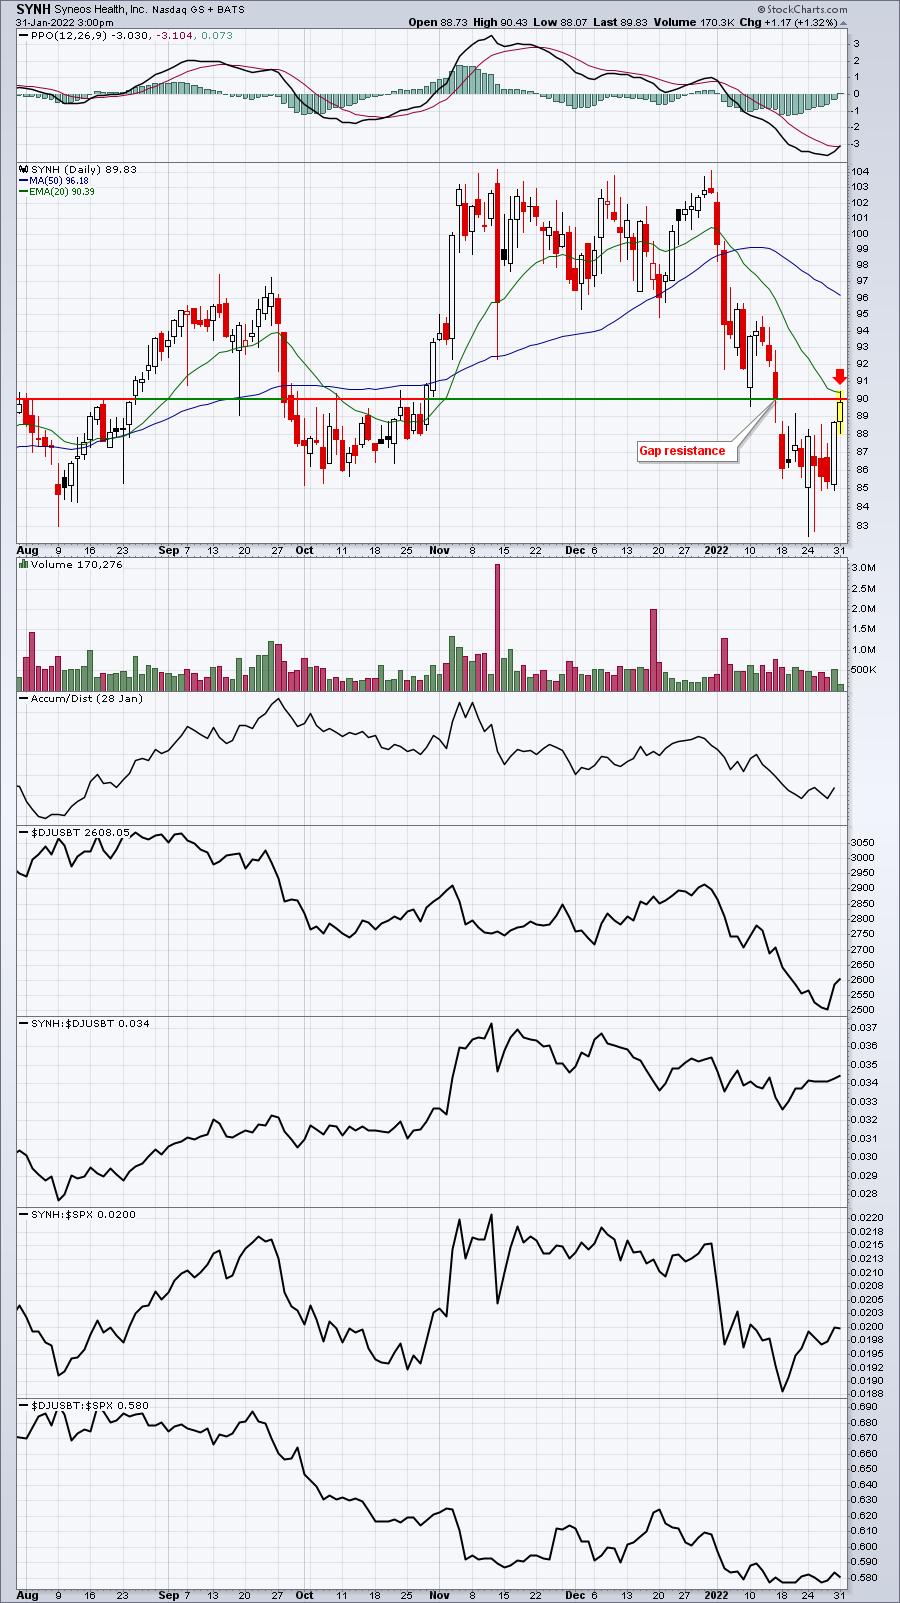
By allowing stocks to rally back to key levels of resistance, you can potentially enter on the short side with not a lot of risk. In the case of these two, I'd want to see the 20-day EMA continue to provide closing resistance. If it failed, I'd cover my position and exit quickly.
Earnings Reports
Here are the key earnings reports for the next two days, featuring stocks with market caps of more than $10 billion. I also include a few select companies with market caps below $10 billion. Finally, any portfolio stocks that will be reporting results are highlighted in BOLD. If you decide to hold a stock into earnings, please understand the significant short-term risk that you are taking. Please be sure to check for earnings dates for any companies you own or are considering owning.
Monday, January 31:
NXPI, LHX, TT, OTIS, ARE, GGG, CACC, AGNC, KRC, WWD, AXTA, CRUS, ATKR, FN, KMPR, PCH, CBT, HP, SANM, HLIT
Tuesday, February 1:
GOOGL, XOM, PYPL, UPS, AMD, SBUX, GILD, CB, GM, UBS, EPD, EA, EQR, MTCH, IMO, SWK, SIRI, PKI, WAT, AMCR, BR, CTLT, IEX, BEN, ENTG, TECH, PHM, PNR, LII, DOX, ST, SMG, MANH, MAN, UNM, TENB, AQUA, HRB, MRCY, APAM, ARCB, CSGS, ATEN
Economic Reports
January Chicago PMI: 65.2 (actual) vs. 62.1 (estimate)
Happy trading!
Tom