
EB Daily Market Report - Tuesday, February 1, 2022
Monday DMR
I did not receive the Daily Market Report (DMR) and there were reports that others did not as well. Couple things: First, always know that after publishing the DMR and mailing to EB.com members, I also post the DMR to our website. If you haven't received the DMR by 3:30pm ET, I'd suggest you take a look on our website for that day's report. We do have email issues occasionally, so posting the DMR to our website is our backup plan.
ChartLists Updated
If you did not receive the DMR yesterday, a number of our ChartLists were updated over the weekend. They are as follows:
- Strong Earnings ChartList (SECL)
- Strong Future Earnings ChartList (SFECL)
- Strong AD ChartList (SADCL)
- Short Squeeze ChartList (SSCL)
- Upcoming Earnings ChartLists - all 5 days this week
- Upcoming Earnings Relative Strength ChartList - all earnings this week in relative strength form
I am also updating the Raised Guidance ChartList (RGCL) and the Bullish Trifecta ChartList (BTCL) currently and they should be available on our website later today. The BTCL only has 5 stocks on it. Remember, this ChartList comprises stocks that are on ALL of the following ChartLists: SECL, SADCL, RGCL.
Executive Market Summary
- Futures were lower overnight, but rallied to open in positive territory, extending the recent rally
- Cryptocurrencies are continuing their rebound with ethereum ($ETHUSD) gaining close to 5% today
- Gold ($GOLD) is back above $1800 per ounce, reversing its recent downtrend, and despite the dollar (UUP, -0.10%) bouncing off its earlier intraday low
- Energy (XLE, +3.25%) is easily today's best-performing sector, despite crude oil ($WTIC, -0.42%) falling
- Industrials (XLI, +0.83%) are also having a nice day, led by a very strong delivery services group ($DJUSAF, +10.20%)
- United Parcel Service (UPS, +14.41%) is the top-performing S&P 500 stock after reporting quarterly results that exceeded expectations; UPS trades at an all-time high
- Utilities (XLU, -1.85%) is the clear laggard on today's session
- Alphabet (GOOGL, +0.78%), PayPal Holdings (PYPL, +0.53%), and Advanced Micro Devices (AMD, +0.50%) highlight a busy slate of earnings after today's close
Market Outlook
The rally off the S&P 500 low near 4200 has now reached what I'd consider a more mature stage. We're testing Fibonacci retracement levels, the 20-day EMA, and overhead price resistance. We are at the very beginning of February and we know from a historical perspective that the S&P 500 tends to perform quite well at the beginning of calendar months as new money comes into the market from pensions, 401(k) plans, etc. As a reminder, here are the annualized returns of the next several calendar days of ALL months:
- 1st (today): +45.96%
- 2nd (tomorrow): +39.21%
- 3rd (Thursday): +22.71%
- 4th (Friday): +5.33%
Once we move into next week (Monday is the 7th), bearish historical tendencies take over as the 7th through the 10th of all calendar months have produced annualized returns of -3.97% since 1950.
Sector/Industry Focus
In order to hopefully see a very short-term signal as to a potential near-term top and the next leg lower, I'm watching the S&P 500 chart, along with my favorite intermarket relationship, consumer discretionary vs. consumer staples (XLY:XLP). I've generally found that if the XLY:XLP ratio is moving up with the S&P 500, it's a solid signal that the market rally is sustainable. When this ratio moves opposite the S&P 500, it simply provides us a caution flag. I'd say based on the chart below, we should remain very careful and tread lightly on this rally:
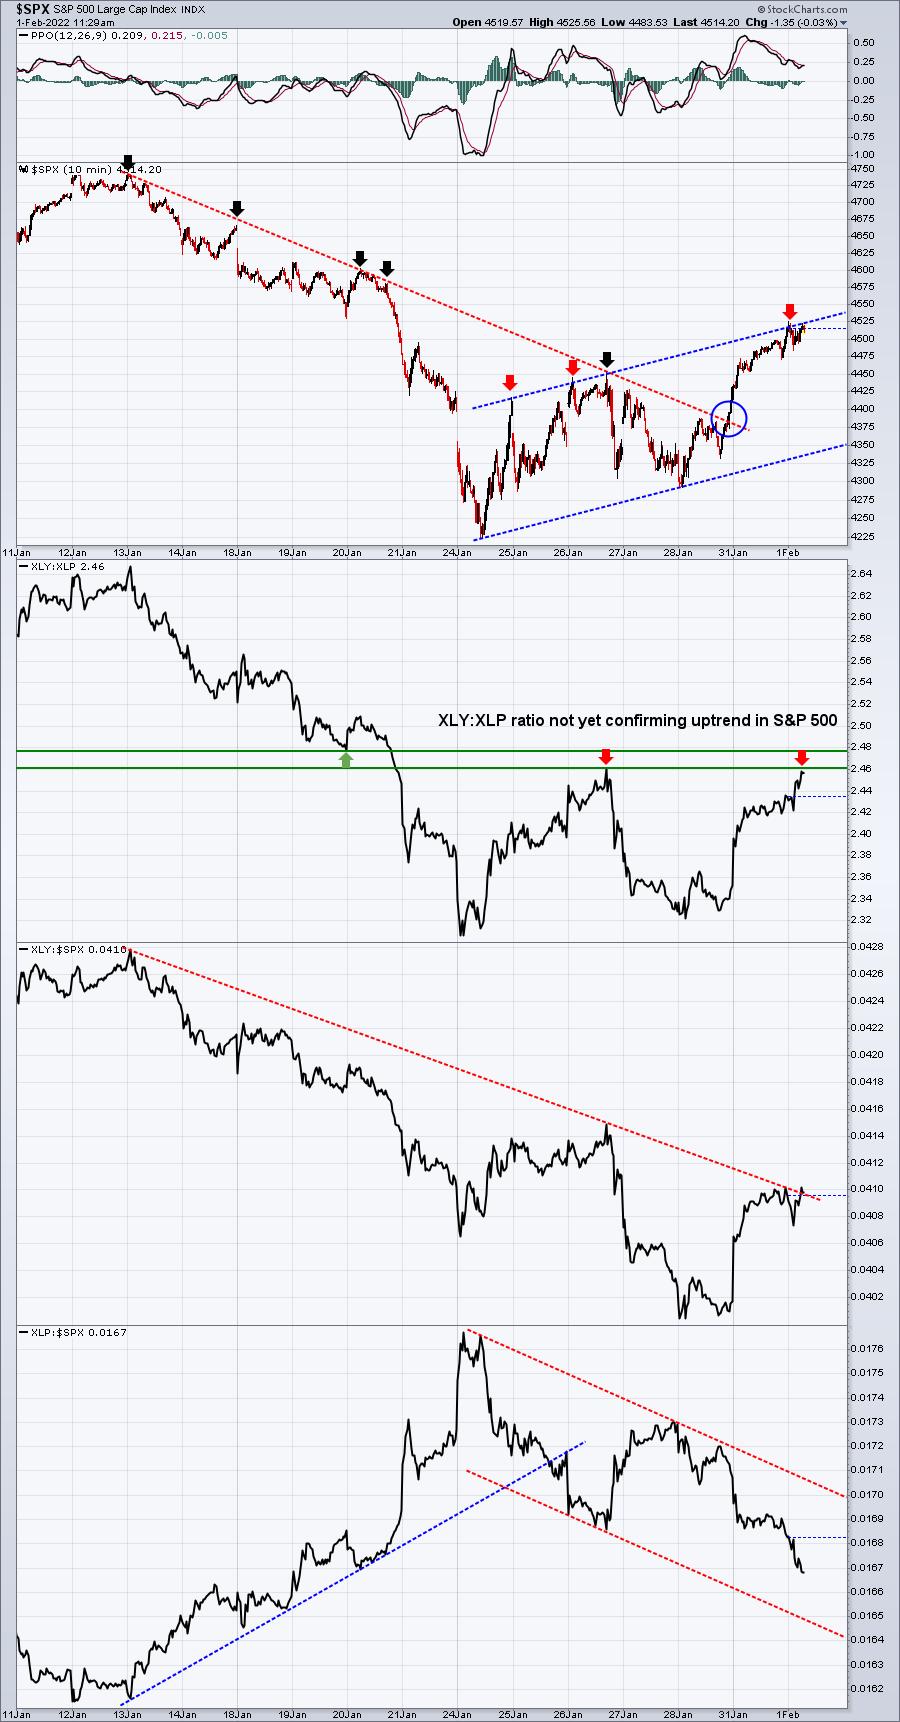
By connecting the two recent lows, we get a "slope" to this uptrend. By dragging that same "sloped" line to the recent highs, we can create a channel on the S&P 500. Unless we break the channel to the upside, the S&P 500 would seem to have a bit of a cap on it right now. While we certainly might move higher, it would appear that the likelihood of powerful gains like we've seen the past day and a half is not as likely. Furthermore, if the XLY:XLP ratio cannot break out and begins to turn lower, that would provide a signal that perhaps it's time to begin building short positions.
I've said before and I'll say it again. I'm not a big fan of shorting what I believe is a long-term secular bull market. However, short-term cyclical bear markets do occur within those longer-term secular bull markets and we have signals suggesting a cyclical bear market could very well be underway. Each individual has to approach trading/investing over the next few months as he/she deems appropriate. I cannot guarantee a market outcome - either higher or lower. I can only share what I believe are warning signs worth acknowledging.
ChartLists/Strategies
Now that we've seen a bounce, the opportunities to short abound. Let me remind you that while I believe the odds are greater that the market rolls over, which would likely mean great shorting opportunities, there's certainly the possibility that the market moves higher and returns to all-time highs. So if you do decide to short, I'd make sure I kept my line in the sand in terms of covering your short position(s). 20-day EMAs represent excellent entry points from a shorting perspective.
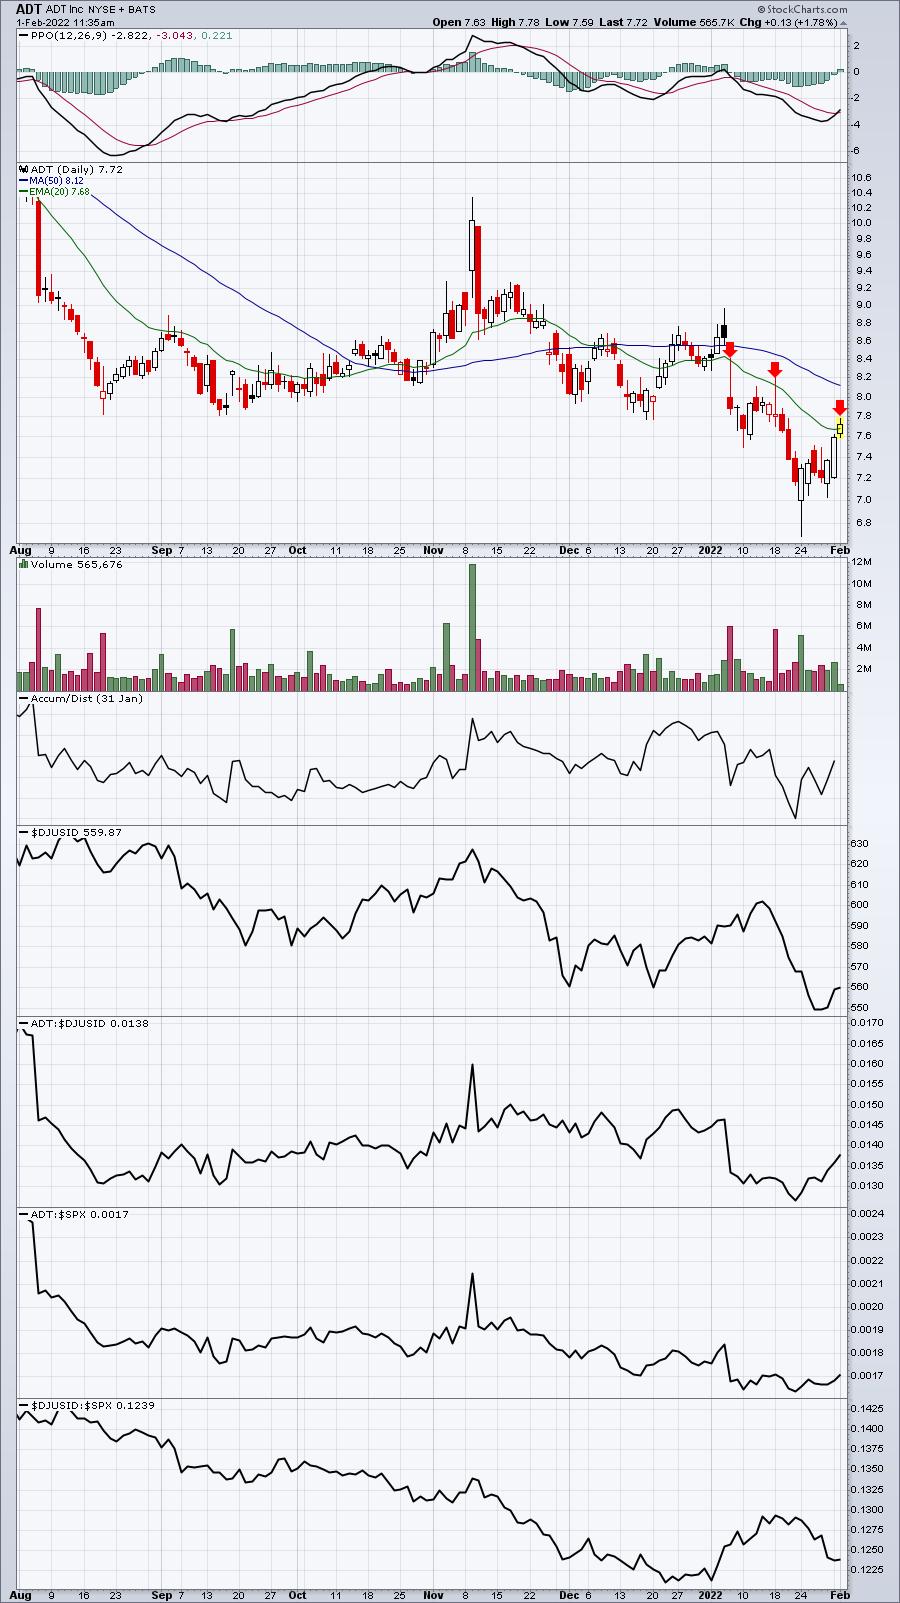
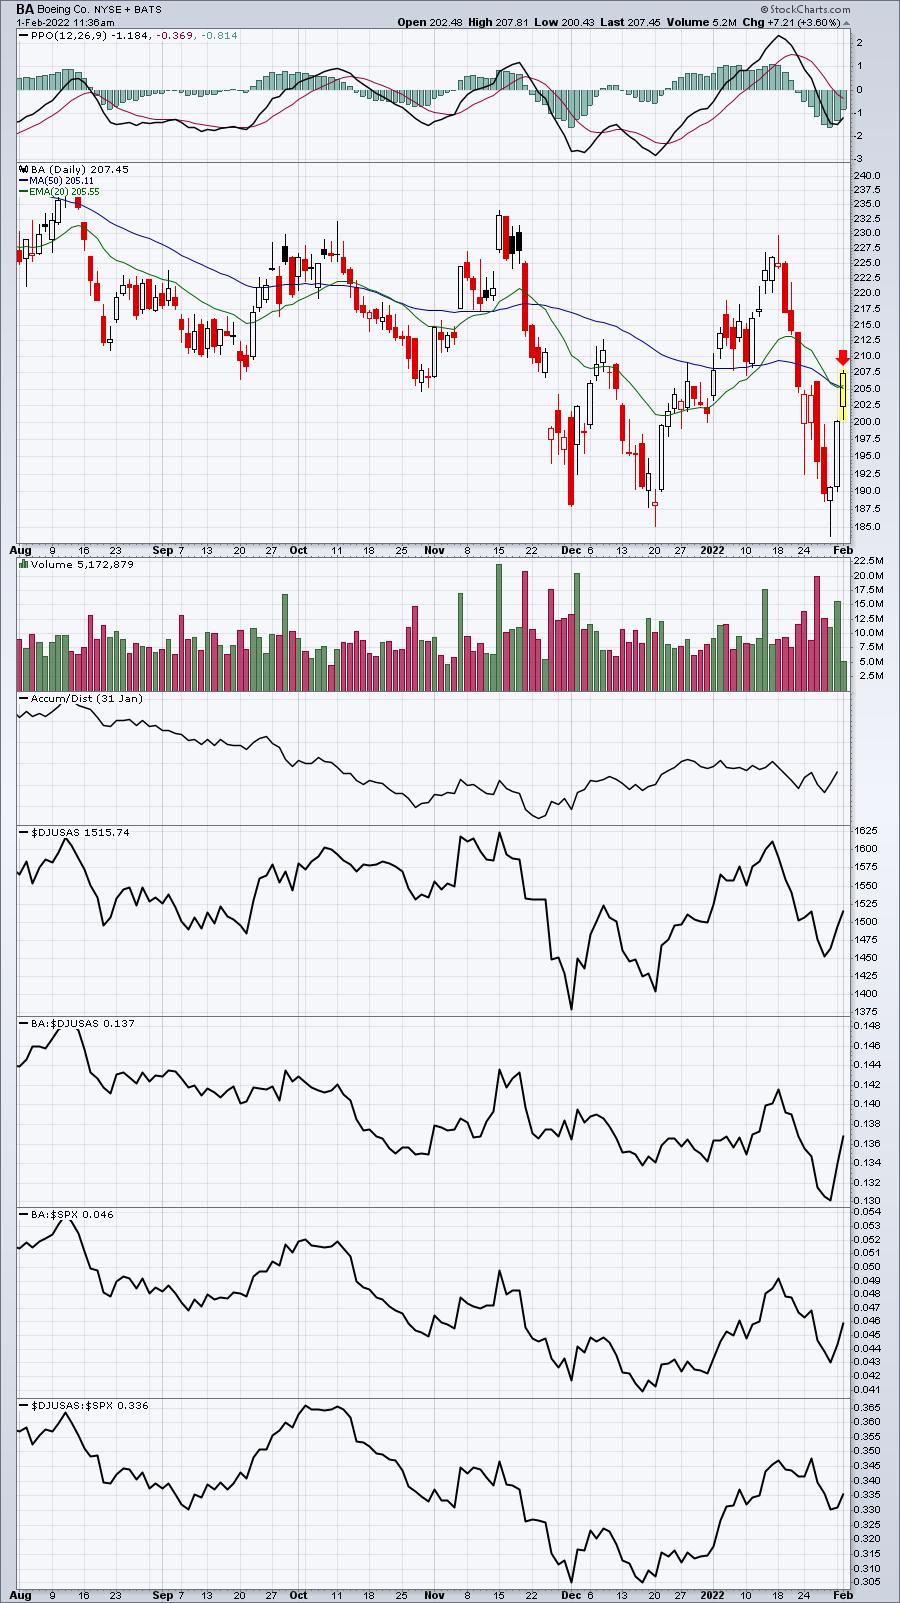
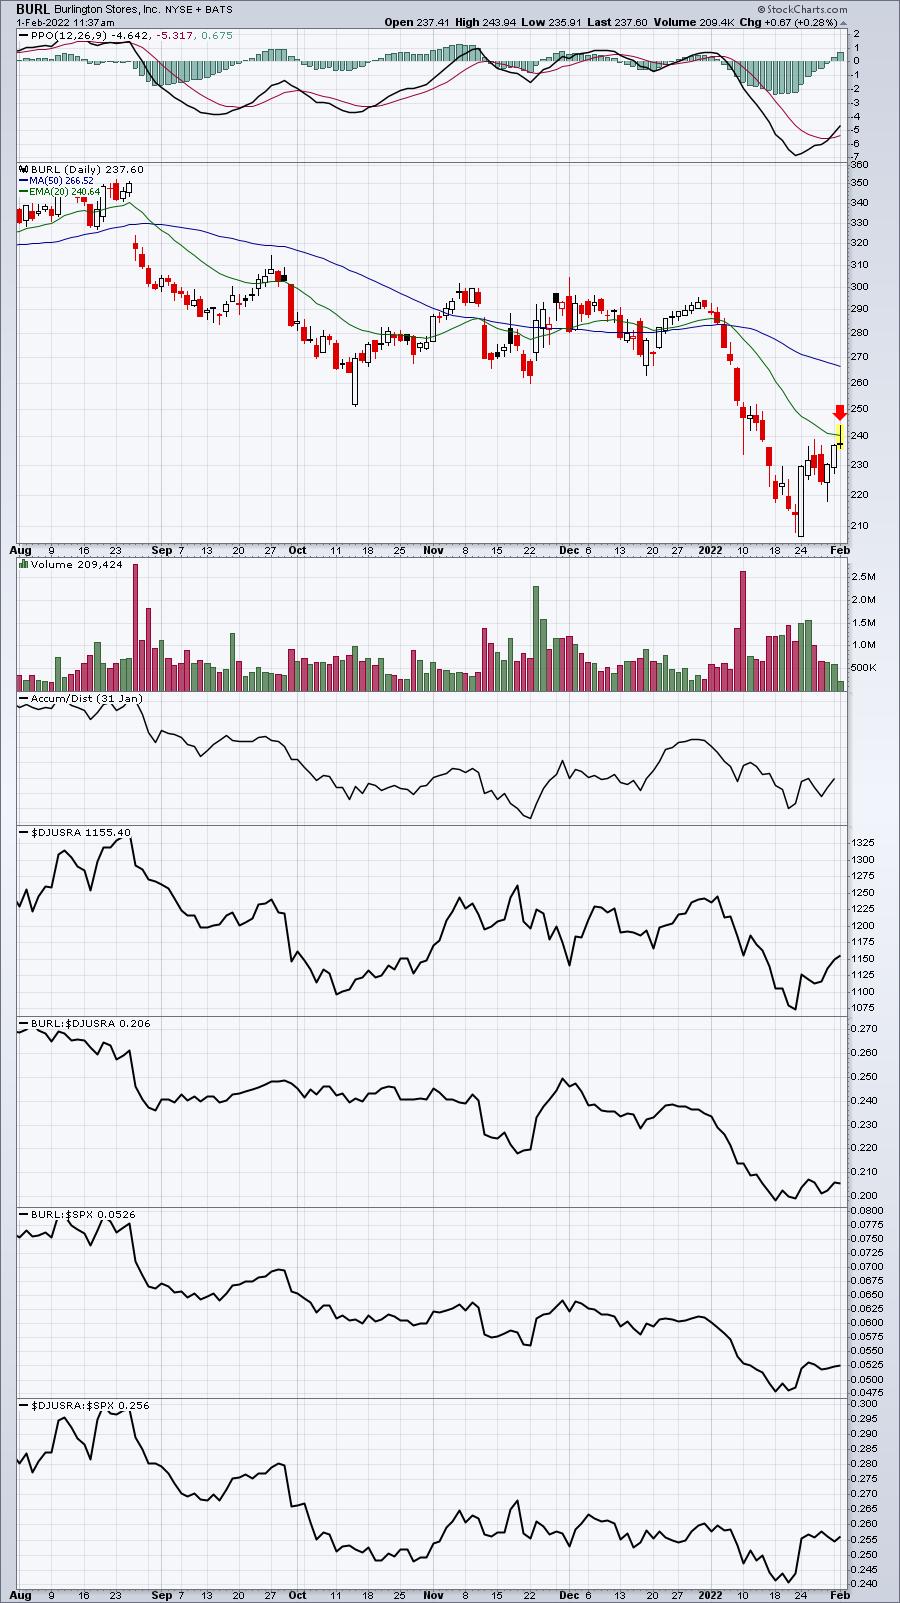
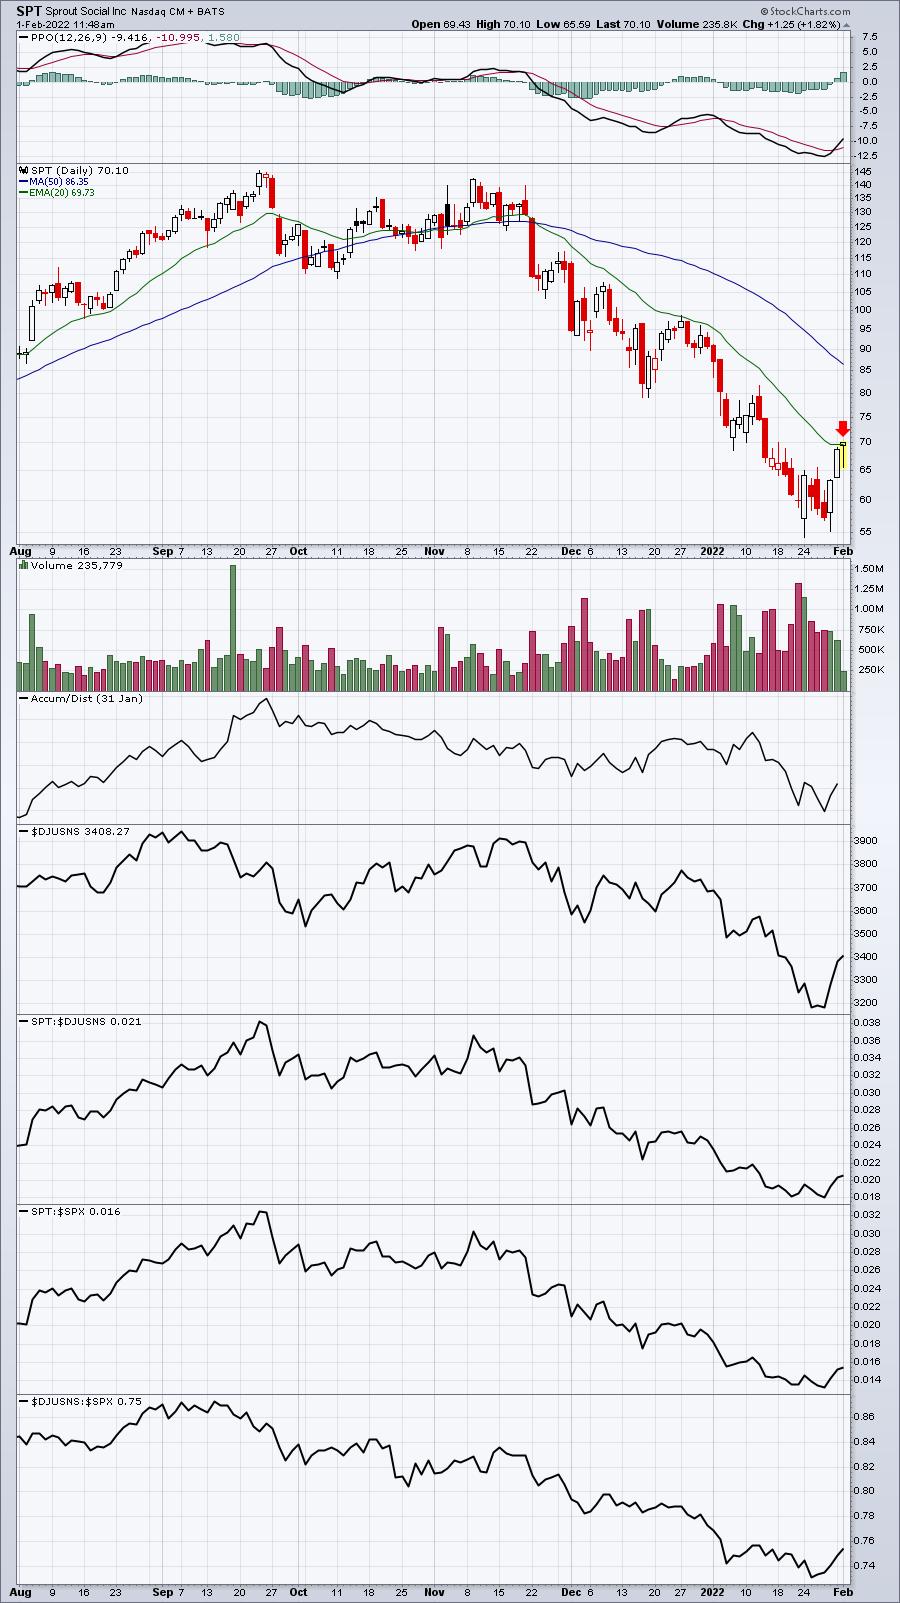
When I ran a scan this morning for companies testing their 20-day EMAs from underneath, there were over 200 companies listed. Here are 4 examples from this scan. The first two (ADT and BA) are trading above their 20-day EMAs, so I'd wait to see them drop beneath their 20-day EMA before considering a short. Then keep a tight stop. The 3rd stock (BURL) has already failed as it broke above its 20-day EMA, but is now below. That's a bearish look, though things could certainly change into today's close. Finally, SPT is in-between, trading slightly above its 20-day EMA. All of these stocks have recently been downtrending with PPOs showing bearish momentum (fresh low at last price low). These 20-day tests COULD be tops before another leg lower. I'd keep my stops in place though to minimize losses should the market continue climbing.
ADT:
BA:
BURL:
SPT:
Earnings Reports
Here are the key earnings reports for the next two days, featuring stocks with market caps of more than $10 billion. I also include a few select companies with market caps below $10 billion. Finally, any portfolio stocks that will be reporting results are highlighted in BOLD. If you decide to hold a stock into earnings, please understand the significant short-term risk that you are taking. Please be sure to check for earnings dates for any companies you own or are considering owning.
Tuesday, February 1:
GOOGL, XOM, PYPL, UPS, AMD, SBUX, GILD, CB, GM, UBS, EPD, EA, EQR, MTCH, IMO, SWK, SIRI, PKI, WAT, AMCR, BR, CTLT, IEX, BEN, ENTG, TECH, PHM, PNR, LII, DOX, ST, SMG, MANH, MAN, UNM, TENB, AQUA, HRB, MRCY, APAM, ARCB, CSGS, ATEN
Wednesday, February 2:
FB, ABBV, TMO, NVS, QCOM, TMUS, SONY, WM, BSX, MET, EMR, JCI, HUM, ROP, CTSH, MPC, RACE, IDXX, AFL, SU, MCK, ALGN, ALL, CTVA, AVB, ODFL, SPOT, MPLX, DHI, ABC, MAA, ESS, GIB, BIP, HOLX, MKL, AVY, DT, QRVO, HWM, FBHS, LNC, RRX, GL, CPRI, DXC, OHI, TTEK, SAIA, OMF, SLAB, MUSA, MTG, THG, EVR, SPR, SITM, LSPD, MXL, HI, KLIC, FORM, ALGT, RRR, CENT, ATI, SBH, EGHT, EAT, CRS, CLB
Economic Reports
January PMI manufacturing: 55.5 (actual) vs. 55.0 (estimate)
January ISM manufacturing: 57.6 (actual) vs. 57.5 (estimate)
December construction spending: +0.2% (actual) vs. +0.7% (estimate)
Happy trading!
Tom