
EB Daily Market Report - Wednesday, February 2, 2022
Executive Market Summary
- Futures soared overnight, especially on the NASDAQ, after Alphabet (GOOGL, +8.16%) posted better-than-expected quarterly results and announced a 20 for 1 stock split
- Advanced Micro Devices (AMD, +5.30%) also posted solid earnings, ahead of estimates
- PayPal Holdings (PYPL, -25.78%), meanwhile, fell short of its EPS estimate and is being crushed today
- The January ADP employment report showed a negative jobs number of 301,000, way short of the 225,000 job gain anticipated
- The 10-year treasury yield ($TNX) fell 4 basis points to 1.76%
- Communication services (XLC, +1.98%) is the best-performing sector today, but the next 4 are defensive sectors; this COULD represent the final leg of this current rally given this development
- Commodities are mostly higher; copper ($COPPER, +1.08%) is performing well; meanwhile, crude oil ($WTIC, +0.00%) is flat at just above $88 per barrel
- Facebook (FB, +0.85%) will be reporting its latest quarterly results after the bell tonight; FB does not look nearly as strong on a relative basis as GOOGL did - it will be interesting tonight for sure
Market Outlook
Since beginning this rally late on Friday from last week, we're seeing our major indices printing higher lows every day. By definition, an uptrend CANNOT end until we see a lower low print, so that's what I'd look for. Also, afternoon weakness can begin to show a weakening that is then confirmed by further weakness the next day. Currently, here's how our major indices (Dow Jones, S&P 500, and NASDAQ) look on a 15-day, 10-minute chart, along with our key XLY:XLP ratio (discretionary vs. staples):
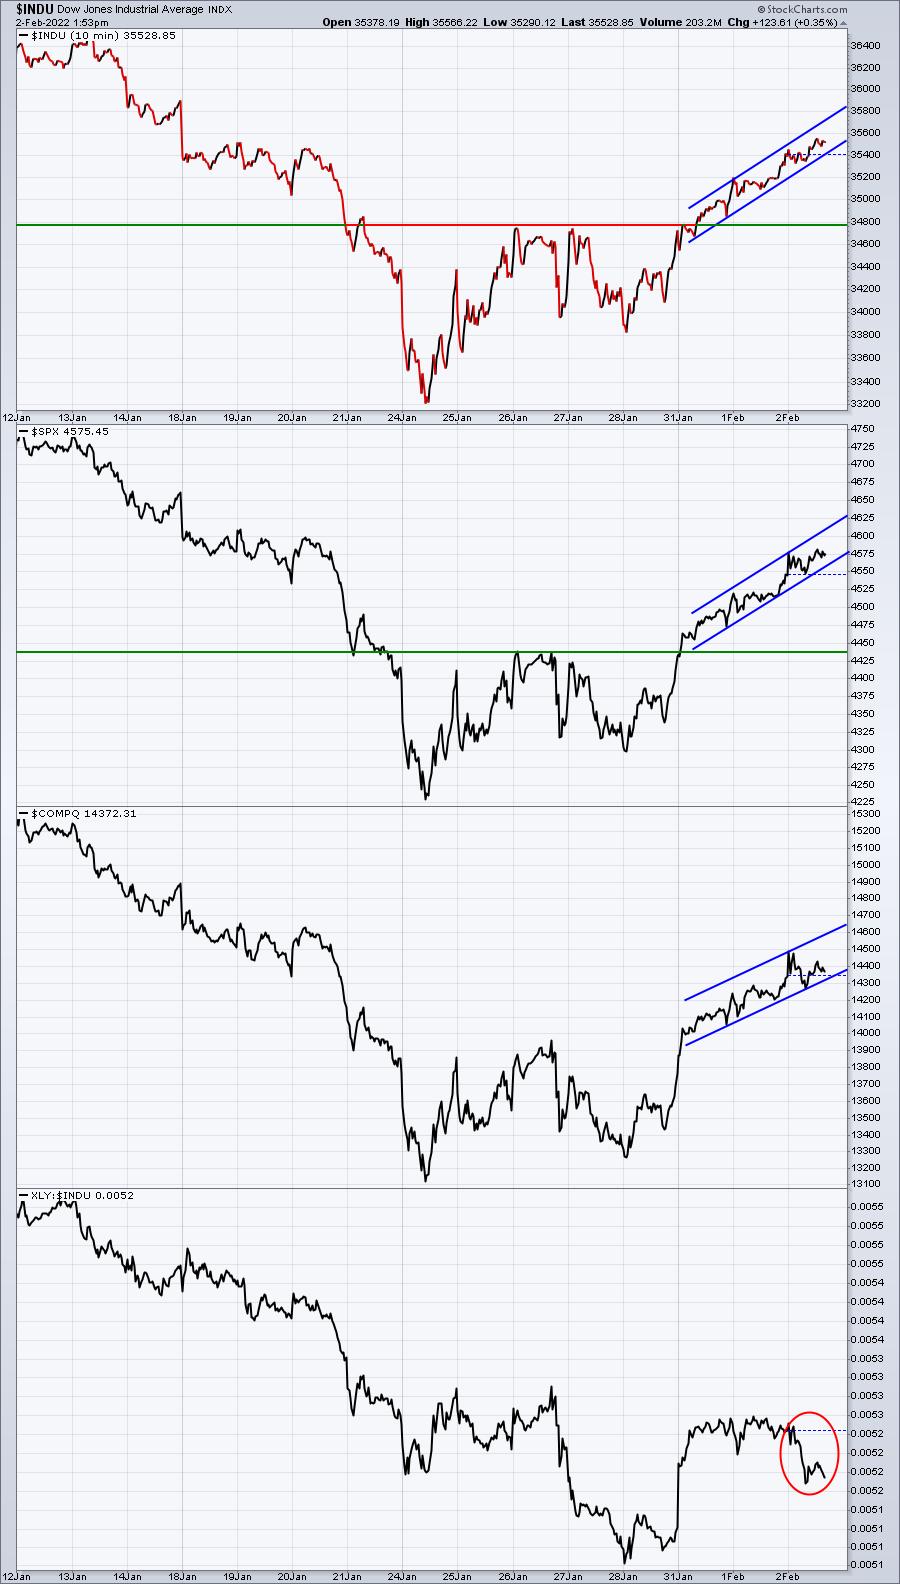
The bottom panel shows the XLY:XLP ratio turning lower, which is a bearish signal in my view. However, it's not confirmed until the market actually begins selling off. The blue channel lines are very tight, so a break of this channel to the downside is first required before a new intraday low can print. That lower low would add much more bearishness to this chart, especially since the big picture is telling me we could have begun a cyclical bear market.
Sector/Industry Focus
As the market rallies, I also want to pay attention to the key aggressive and defensive sectors and how they're each performing on a relative basis. If the rally continues, but leadership switches to defensive sectors, that would be yet another bearish signal. We are beginning to see some of that:
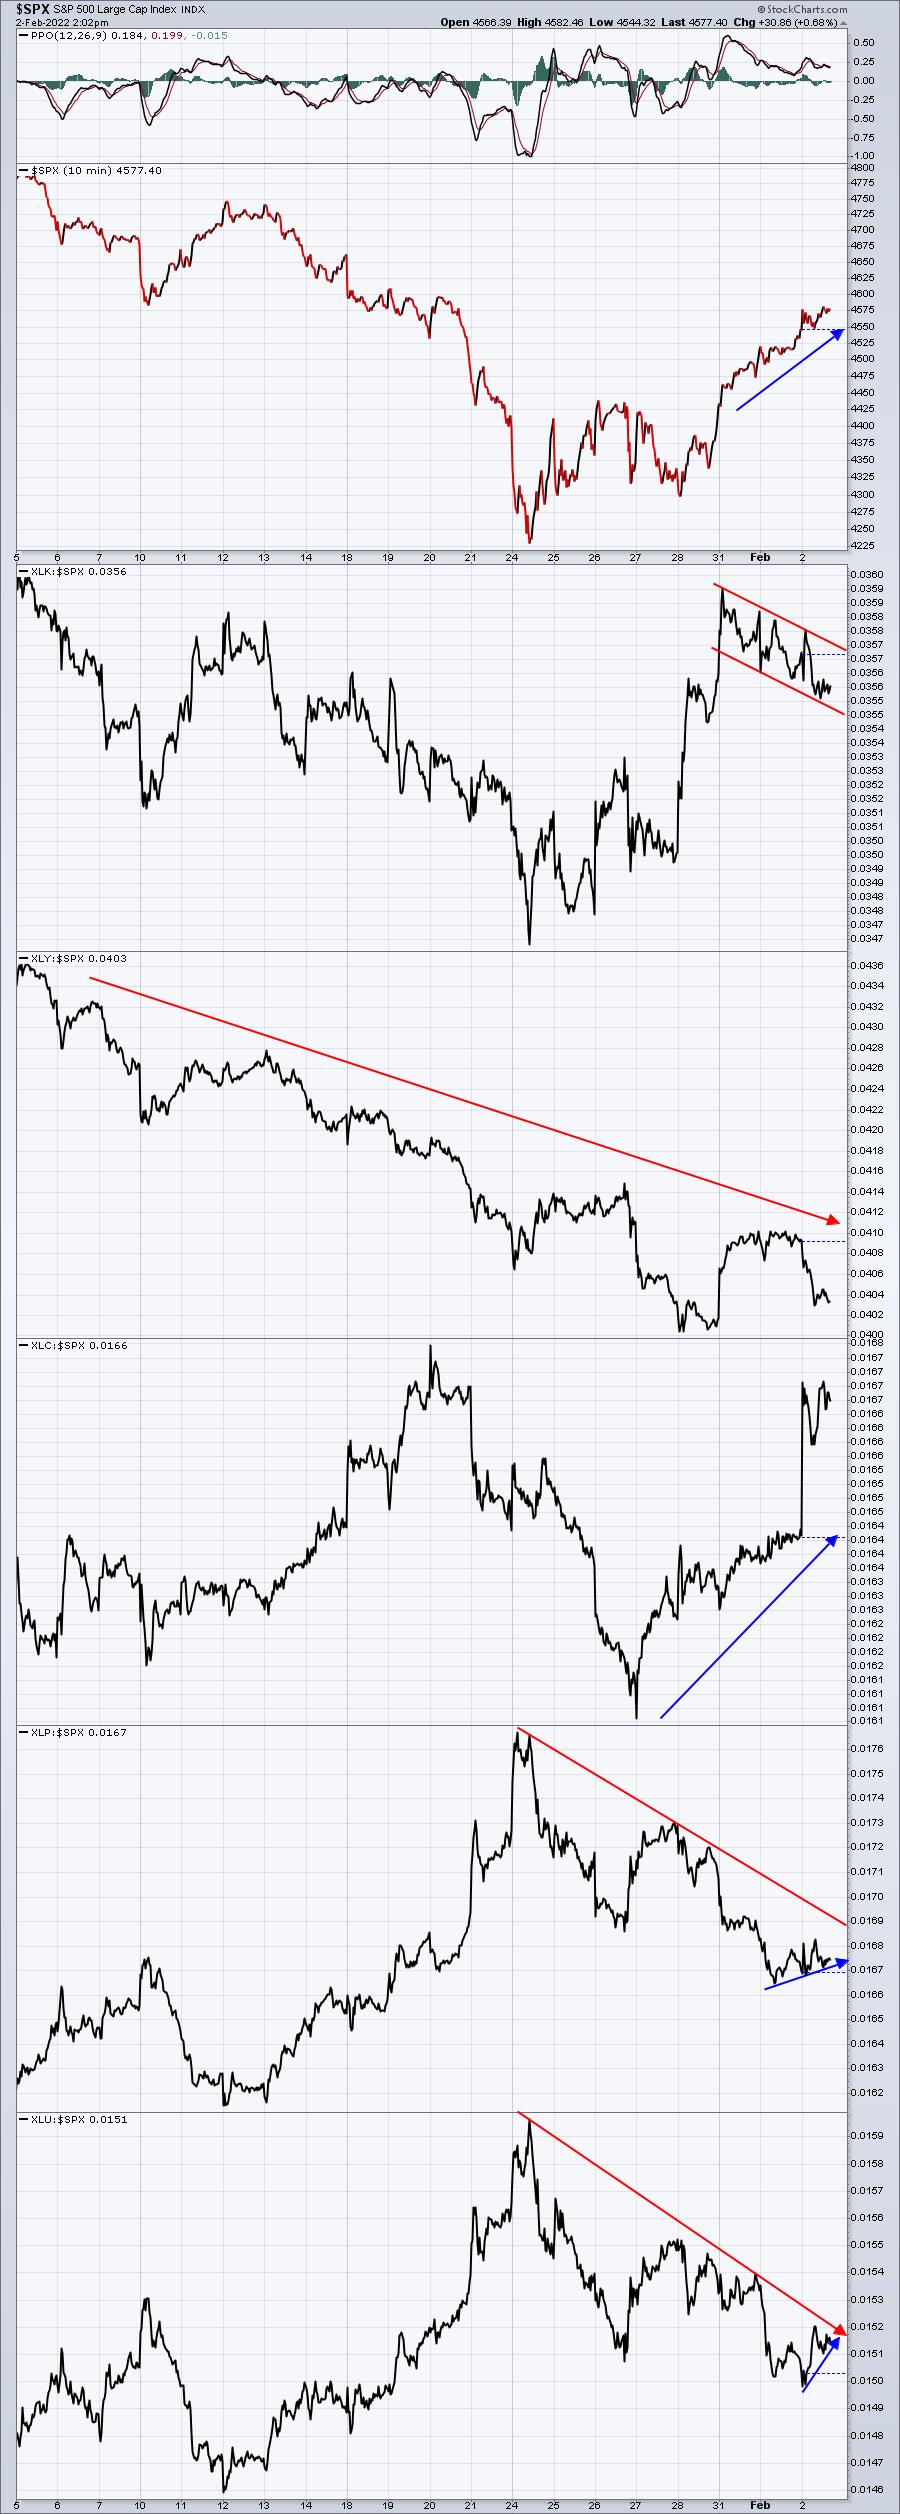
While the overall trend direction still appears to favor short-term bullishness, at least for now, there are a couple bearish "below the surface" signals beginning to emerge. As the S&P 500 pushes higher each day, note that the technology sector (XLK) jumps higher on a relative basis at the open, but then sells off. Since Monday's open, technology has been selling off vs. the S&P 500. Wall Street appears to be using the "rally" to unload tech shares. That's a concern. Furthermore, the relative downtrend in consumer discretionary (XLY) has not even paused, and isn't far from yet another relative breakdown. This doesn't appear like a rally that Wall Street firms are completely behind. Is the market being manipulated higher? Perhaps.
Also, today's move higher in the S&P 500 is being accompanied by both consumer staples (XLP) and utilities (XLU) moving higher - on both an absolute and relative basis. I'd grow much more cautious/bearish if our major indices reverse and begin to close weak in the afternoons.
ChartLists/Strategies
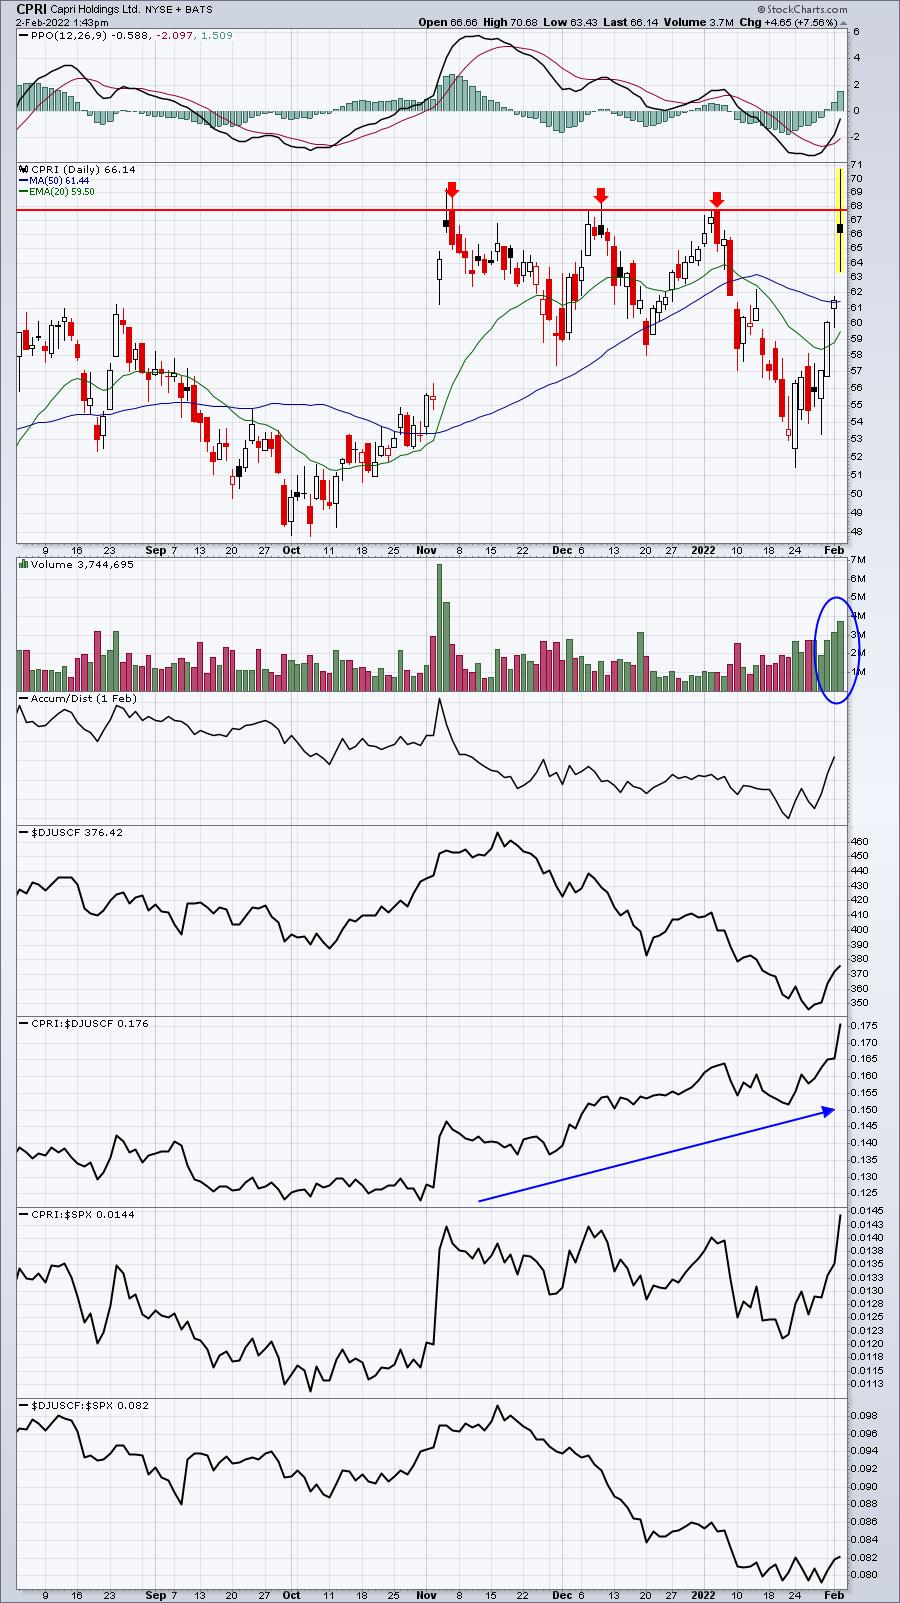
If you're interested in owning stocks (or selling stocks) into their earnings reports, I believe the relative strength vs. peers is about as important as anything. I wouldn't use this to predict whether a stock gaps up or down, however. Instead, I'd use it as a signal of what fundamentals to expect. In other words, downtrending stocks relative to peers are more likely to report a disappointment with earnings. Perhaps it's a revenue or EPS miss, or maybe it's a lowering of guidance. Here are two companies that reported quarterly results since yesterday's close - one produced excellent results and raised guidance (CPRI), while the other showed a significant drop in margins, despite beats on both top line (revenues) and bottom line (EPS):
CPRI:
DT:
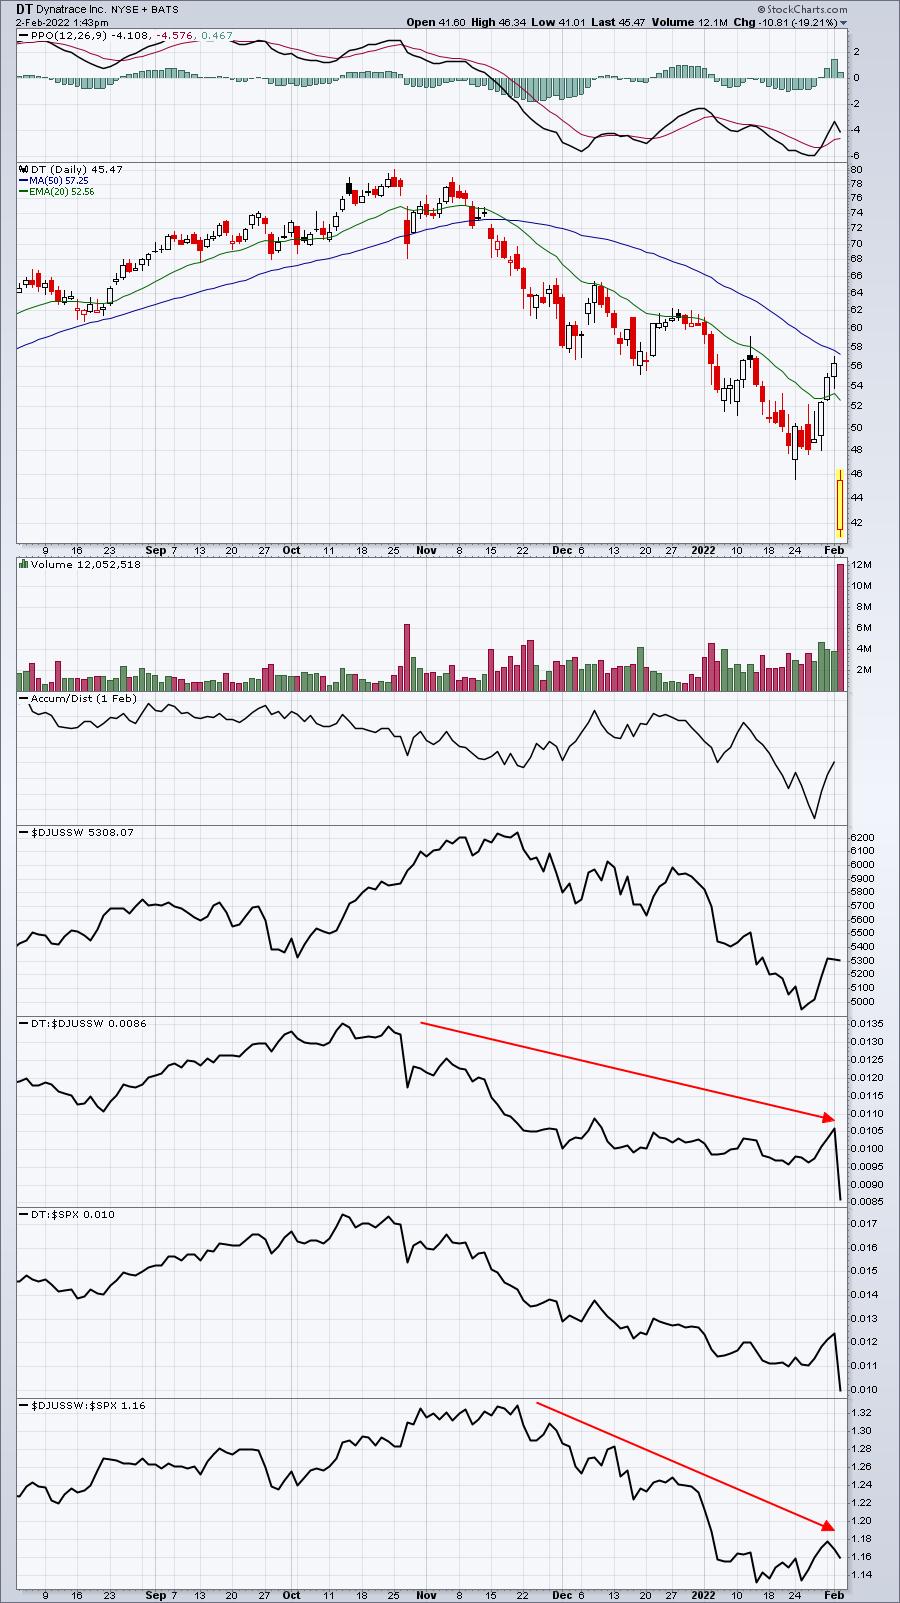
Wall Street meets with management teams prior to the end of their respective quarters. The best way to see which companies Wall Street is buying vs. selling is in how each stock trades relative to its peers. One of my best trades is to find a company that's performing extremely well on a relative basis, reports excellent results, then trades down to test key support levels. In such cases, many times a stock is simply seeing a "sell on news" event. Buying at key support can provide excellent reward-to-risk entry.
Earnings Reports
Here are the key earnings reports for the next two days, featuring stocks with market caps of more than $10 billion. I also include a few select companies with market caps below $10 billion. Finally, any portfolio stocks that will be reporting results are highlighted in BOLD. If you decide to hold a stock into earnings, please understand the significant short-term risk that you are taking. Please be sure to check for earnings dates for any companies you own or are considering owning.
Wednesday, February 2:
FB, ABBV, TMO, NVS, QCOM, TMUS, SONY, WM, BSX, MET, EMR, JCI, HUM, ROP, CTSH, MPC, RACE, IDXX, AFL, SU, MCK, ALGN, ALL, CTVA, AVB, ODFL, SPOT, MPLX, DHI, ABC, MAA, ESS, GIB, BIP, HOLX, MKL, AVY, DT, QRVO, HWM, FBHS, LNC, RRX, GL, CPRI, DXC, OHI, TTEK, SAIA, OMF, SLAB, MUSA, MTG, THG, EVR, SPR, SITM, LSPD, MXL, HI, KLIC, FORM, ALGT, RRR, CENT, ATI, SBH, EGHT, EAT, CRS, CLB
Thursday, February 3:
AMZN, LLY, MRK, HON, COP, EL, F, CI, ITW, BDX, ICE, ABB, ATVI, SNAP, FTNT, BCE, MCHP, PRU, HSY, PH, APTV, NOK, BIIB, AME, CMI, U, WEC, GWW, FTV, HIG, SWKS, AVTR, CLX, BILL, PINS, XYL, CMS, CG, TW, DGX, CPT, CHKP, NLOK, CAH, LPLA, MPW, ABMD, OTEX, WRK, NWSA, PCTY, SNA, HUBB, BERY, COLM, DLB, DECK, ARW, SYNA, RL, WMS, RGA, PENN, LITE, BYD, SKX, NOV, INGR, JHG, HBI, MIME, POWI, VIAV, BECN, HAIN, WERN, PBH, VSTO, MWA, SKYW, MTOR, ENVA, GPRO
Economic Reports
January ADP employment report: -301,000 (actual) vs. +225,000 (estimate)
Happy trading!
Tom