
EB Daily Market Report - Friday, February 4, 2022
January Effect Webinar on Saturday
Tomorrow morning at 10:00am ET, I will be hosting a special "January Effect" webinar as part of a 3-part February educational series. For more information, you can CLICK HERE. I have a room link below that you can use to access tomorrow's event. If you cannot attend live, no worries. We'll record the event, as we always do, so that you can watch it at your leisure.
This first event in the series is designed to provide you the history of January performance and how that typically translates into balance-of-year performance. While there are always "exceptions to the rule", it's truly amazing how January performance can help us with the direction of the stock market over the next 11 months. Here's the room link for tomorrow (the room should be open by 9:30am ET, at the latest):
https://earningsbeats.zoom.us/s/88693491836
I hope to see you there!
(By the way, all 3 events in this series will be FREE to EarningsBeats.com members. Tomorrow morning's event will be FREE to the public, but only members will be attending Events 2 and 3.)
Executive Market Summary
- Futures were significantly higher last night after Amazon.com (AMZN, +14.91%) reported EPS well ahead of estimates; but then came this morning's jobs report and futures reversed and were mixed
- January nonfarm payrolls were 467,000, more than tripling the estimate of 150,000
- The 10-year treasury yield ($TNX) has surged higher by 10 basis points to 1.92% - see below for more
- It's a risk-on kind of day with cryptocurrencies soaring - etherium ($ETHUSD) is up nearly 14%
- Crude oil ($WTIC, +2.30%) has moved above $92 per barrel; most other commodities are higher as well
- Consumer discretionary (XLY, +3.13%) is soaring much like communication services (XLC) did yesterday; AMZN's big move higher is lifting the XLY
- Broadline retail ($DJUSRB, +11.72%) is doing little to lift retail stocks as a whole as the widely-diversified retail ETF (XRT, -0.29%) remains in negative territory today
- Energy (XLE, +1.89%), benefiting from the higher crude oil prices, is next in line; financials (XLF, +1.83%) also are performing well, given the huge rise in the TNX
- Meanwhile, 6 of our 11 sectors are lower today; materials (XLB, -1.10%) is the primary laggard, while our 4 defensive sectors are all fractionally lower
Market Outlook
Interest rates remain close to historically-low levels, which is why all the 2022 fuss about higher inflation and higher interest rates is more bark than bite. Listen, I said several months ago that inflation and interest rates were going to be the next "crisis" on every media outlet you turned to. This time, however, we've moved to ridiculous levels of bullish sentiment in the options world and that NEEDS to be reset for us to truly launch higher again. I'm not saying that the stock market cannot go higher from here, because I've been wrong plenty of times before, so what's one more time? But if the stock market were to go higher, the risk of jumping on board to ride the bullish train would be VERY SIGNIFICANT. If we can wait and allow the inflation and interest rate worries to drop prices and reset sentiment, we'll be in a SUPER position to enter U.S. equities for the next phase of this multi-decade secular bull market. I'm about as convinced as I can get that we'll be back at all-time highs - maybe this year, but more likely next year. Some might say then why worry about all this and just stay long and strong? Well, losing money has a way of completely altering your mindset. You might feel that way today, but if the S&P 500 is at 3500 in 2-3 months and you read constant gloom and doom media reports, will you feel the same way? When everyone starts predicting armageddon, that's when many buy-and-holders give up, throw in the towel, and vow to never own another stock ever.
We need to avoid that mentality and try to remain one step ahead of everyone else.
That's why I'm comfortable remaining mostly in cash and sacrificing possible returns if the stock market moves higher. It's all about identifying risk and then managing it. If I'm right about this being a cyclical bear market, as traders, we'll be in a much better position to own stocks at a much lower level. For those who are extremely aggressive, short selling is a viable option - especially after short-term rallies.
I say all of this, because that TNX is soaring today and nearing its highs from 2019 in the 1.95%-1.97% area. A breakout above that and move above 2% is going to freak out a lot of investors, especially with the media telling them that this is really, really bad. Check out the TNX long-term chart:
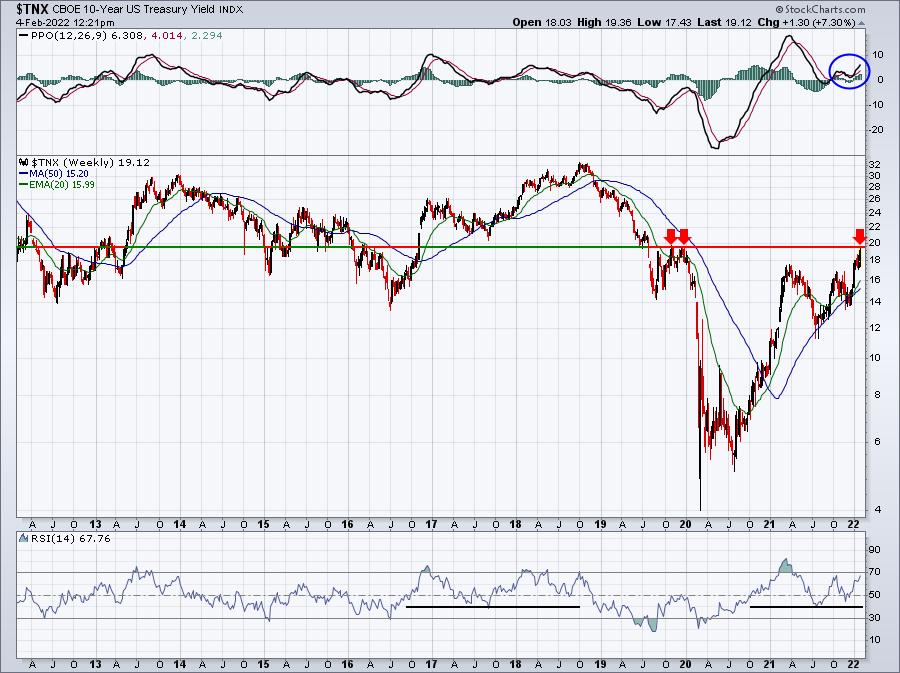
The TNX is clearly trending higher. The PPO is positive and rising. Also, note that the RSI has been holding 40 support. Those are two signals that typically accompany an uptrend. The last time we saw a consistent rise in the 10-year treasury yield back from 2016 through 2018, U.S. equity prices rose as well. The reason? Bonds were being sold, because the economy was strengthening. U.S. equities rise for the same reason. This time is different. While we could argue that the economy remains strong, I believe most would acknowledge rates are rising due to the threat of inflation. The problem with this scenario is that rising interest rates lower the valuations of growth stocks. If everything else is constant, higher interest rates will lower the value of future cash flows and future earnings growth. So we need to get past the inflation scare before we'll see a meaningful climb in growth stocks.
Wall Street will many times begin to see the light at the end of the tunnel long before the media catches on. Plus, who wants to read good news when media outlets can paint a picture of armageddon? By following the charts, we'll see what Wall Street is doing and gain an advantage over others. At least that's the plan. :-)
Sector/Industry Focus
Rising rates due to a strengthening economy is generally very good news for the performance of financials (XLF). But if rates are rising due to inflation, it's not nearly the same. Below is a long-term chart of the XLF vs. the S&P 500, with the lower panel reflecting the 1-year rate of change in the consumer price index ($$CCPI):
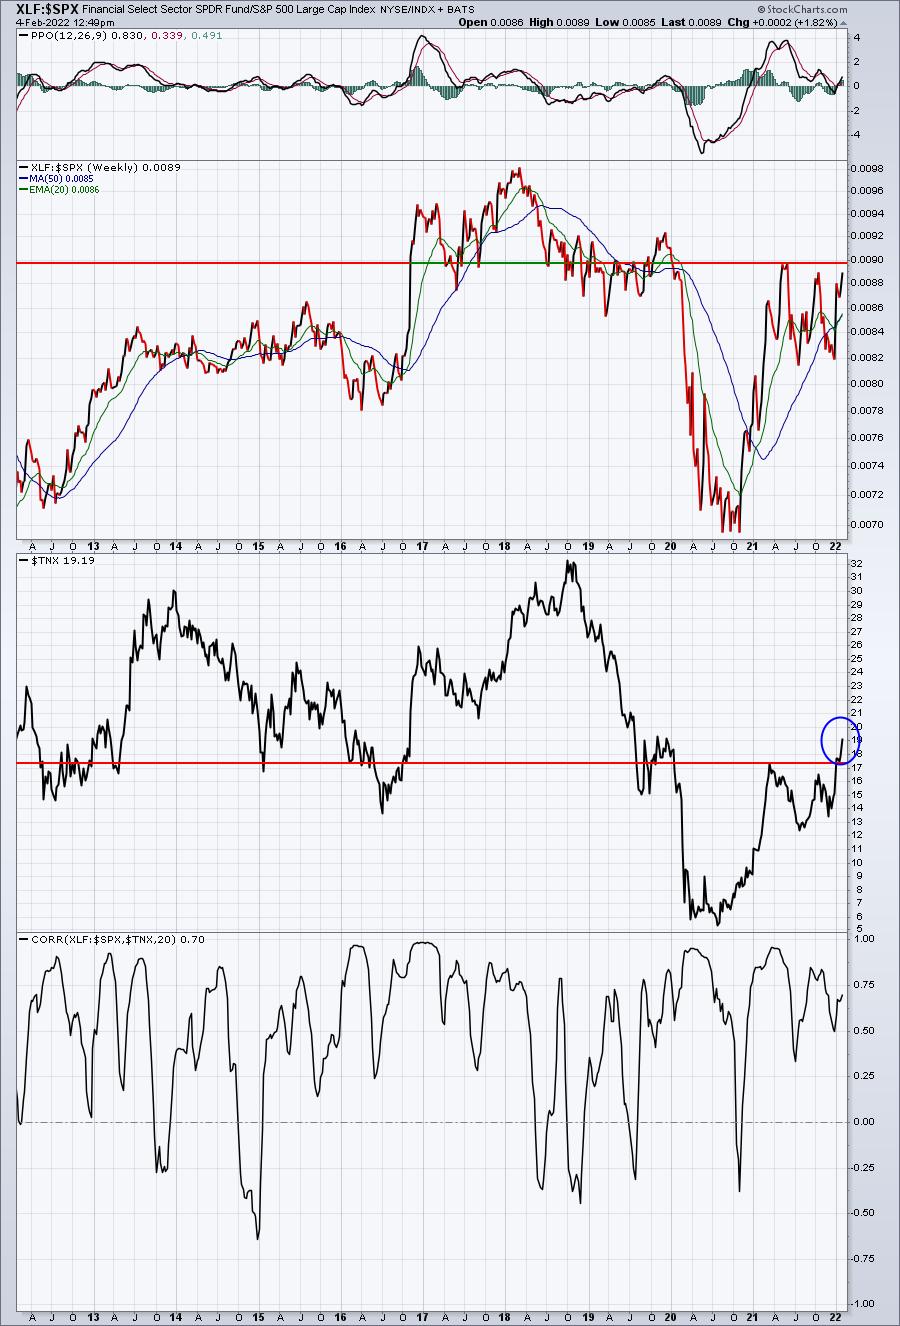
Two things on this chart I'd like to point out. First, we've seen the TNX break out, but we have yet to see the XLF:$SPX ratio break out. That is likely due to the fact that higher rates are being driven, at least in part, but probably mostly, by inflationary pressures. However, the second thing to note from this chart is how closely the XLF outperformance vs. the benchmark is tied to rising treasury yields. It's an interesting intermarket relationship that's always worth remembering.
ChartLists/Strategies
Our ChartLists are primarily designed to trade the stocks within them on the long side. We look for great earnings, exceptional relative strength, breakouts, tests of rising moving averages, etc. While they're are likely to still be some of those in our ChartLists, the overall market environment has changed. We COULD put together shorting ChartLists, but the time required to do so is enormous. If I believed we were in a multi-year downtrend, then yes we'd figure out a way to create ChartLists specifically for shorting. But, by the time we spent hundreds of hours putting together a more bearish array of ChartLists, the stock market will likely find a bottom. I will point out charts that could be shorted here in the DMR and explain my reasons for doing so, but to completely revise our service for a fairly short period of market weakness doesn't seem to be the best use of my/our time.
If you're interested in putting together a potential list of short candidates, I'd consider downloading stocks making 52-week lows into a ChartList. From there, you could run scans that are OPPOSITE the scans we provide on our website. For instance, the 20-day EMA test scan, you'd have to change the wording from daily low less than the 20-day EMA to daily high greater than the 20-day EMA. To short, I'd like to see a stock attempting to break above its 20-day EMA, but failing to do so. This type of scan could be run later in the afternoon.
Earnings Reports
Here are the key earnings reports for the next two days, featuring stocks with market caps of more than $10 billion. I also include a few select companies with market caps below $10 billion. Finally, any portfolio stocks that will be reporting results are highlighted in BOLD. If you decide to hold a stock into earnings, please understand the significant short-term risk that you are taking. Please be sure to check for earnings dates for any companies you own or are considering owning.
Friday, February 4:
BMY, SNY, REGN, ETN, APD, AON, RCL, CBOE, ADNT, SPB, TWST, VRTS, ROAD
Monday, February 7:
AMGN, SPG, TSN, ON, ZBH, PFG, TTWO, NUAN, HAS, CNA, BAP, ACM, THC, AMG, LEF, SSD, TDC, VRNS, CHGG, KMT, RMBS, ENR, CRNC, ACLS, AOSL, SLQT
Economic Reports
January nonfarm payrolls: 467,000 (actual) vs. 150,000 (estimate)
January private payrolls: 444,000 (actual) vs. 150,000 (estimate)
January unemployment rate: 4.0% (actual) vs. 3.9% (estimate)
January average hourly earnings: +0.7% (actual) vs. +0.5% (estimate)
Happy trading!
Tom