
EB Daily Market Report - Monday, February 7, 2022
Earnings Reactions Event Today
I'll be hosting our quarterly Earnings Reactions Sneak Preview event later this afternoon at 4:30pm ET. The room will be open at 4:00pm ET and you can access the webinar using this link:
https://earningsbeats.zoom.us/j/81602631755
I hope you can join me!
Executive Market Summary
- Futures were slightly lower overnight, but the market actually opened slightly higher this morning
- There's no economic news this morning and relatively little earnings news; that changes later this week as hundreds of companies will report earnings and a key CPI (inflation) report will be out Thursday morning
- Cryptocurrencies were strong late Friday and that's carried over to today; bitcoin ($BTCUSD) is up 6%
- Commodities are mixed today with crude oil ($WTIC, -1.39%) lower, while gold ($GOLD, +0.75%) and silver ($SILVER, +2.56%) advance
- Despite a lower WTIC, energy (XLE, +1.35%) is today's best-performing sector
- Industrials (XLI, +0.49%) is strong on a relative basis, lifted by airlines ($DJUSAR, +3.14%)
- Communication services (XLC, -1.48%) is once again the primary laggard as Meta Platforms (FB, -4.77%) sees further selling on heavy volume
- Peloton Interactive (PTON, +18.70%) was the acquisition talk of the weekend, with Amazon.com (AMZN, +0.82%), Apple (AAPL, +0.12%), and Nike (NKE, +0.28%) all considered potential suitors
- A couple of big health care names will be reporting earnings - Amgen (AMGN, +0.73%) today after the bell and Pfizer (PFE, +0.31%) tomorrow morning before the bell
Market Outlook
Trying to predict very short-term market swings in a highly volatile market is nearly impossible. Just when you think you have a short-term move nailed, the market reverses and the whipsaw action creates emotional issues as well as financial issues. I tend to avoid these types of intraday swings, but I'll throw my hat in and compare the short-term action with my key sustainability ratio - the XLY vs. the XLP (discretionary vs. staples stocks). Look at this chart:
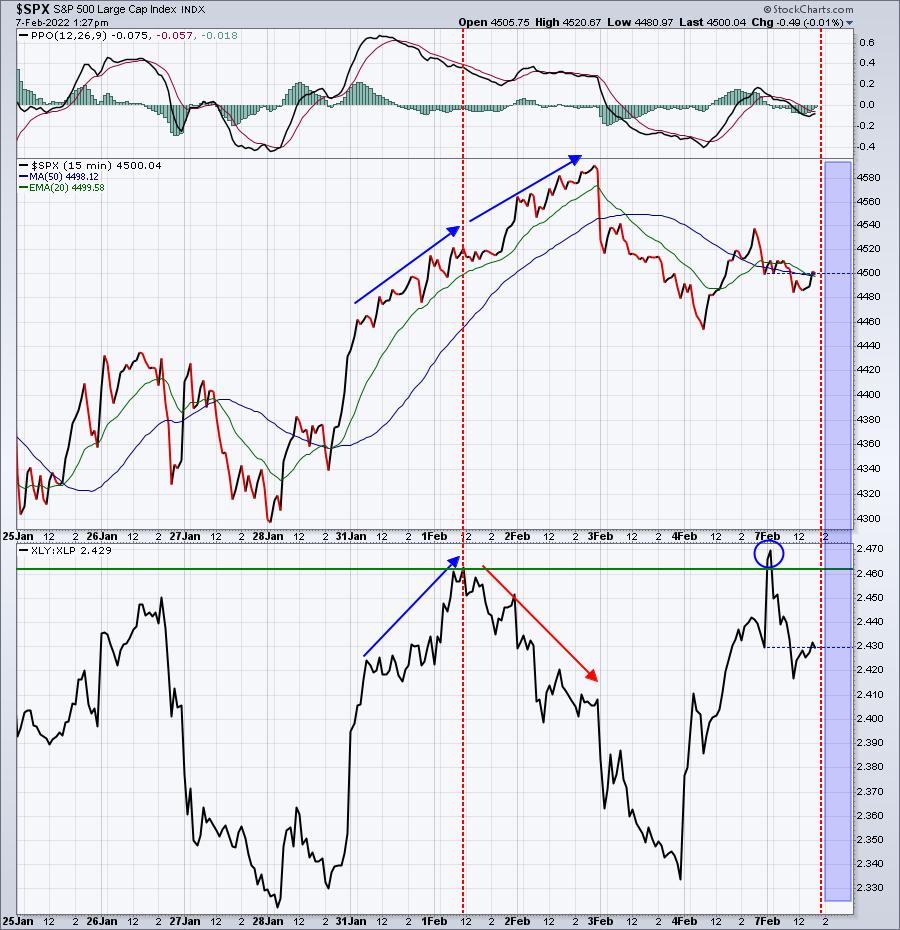
The move higher early last week was accompanied by a rapidly-rising XLY:XLP ratio, indicating sustainability of the advance. However, to the right of the red-dotted vertical line on February 1st, you can see the S&P 500 continuing to push higher, while the XLY:XLP literally fell out of bed. That always worries me about an advance, though short-term signals can whipsaw you. I'm much more swayed by these types of signals on a daily or weekly chart. I mean this is a 15-minute chart and lots can change 4 times an hour. But it's at least one signal that I'd keep an eye on to help confirm the directional move that you're anticipating. The blue-shaded area on the right side of the chart - which way does the S&P 500 go and does the XLY:XLP support the move? That's one piece of the short-term market puzzle.
Sector/Industry Focus
On Friday, I showed how rising rates are typically a good sign of economic strength and that it usually translates into strong financial performance - on a relative basis. I also indicated that I would show you the 1-year rate of change in the consumer price index ($$CCPI). I think I grabbed the wrong chart to attach, because the $$CCPI was not included. I apologize for that, but I'm correcting that error today. Also, instead of featuring financials, I want to feature transports ($TRAN). I believe this will help to illustrate that rates are now apparently rising for inflationary concerns, not necessarily because of economic strength ahead. Check this out:
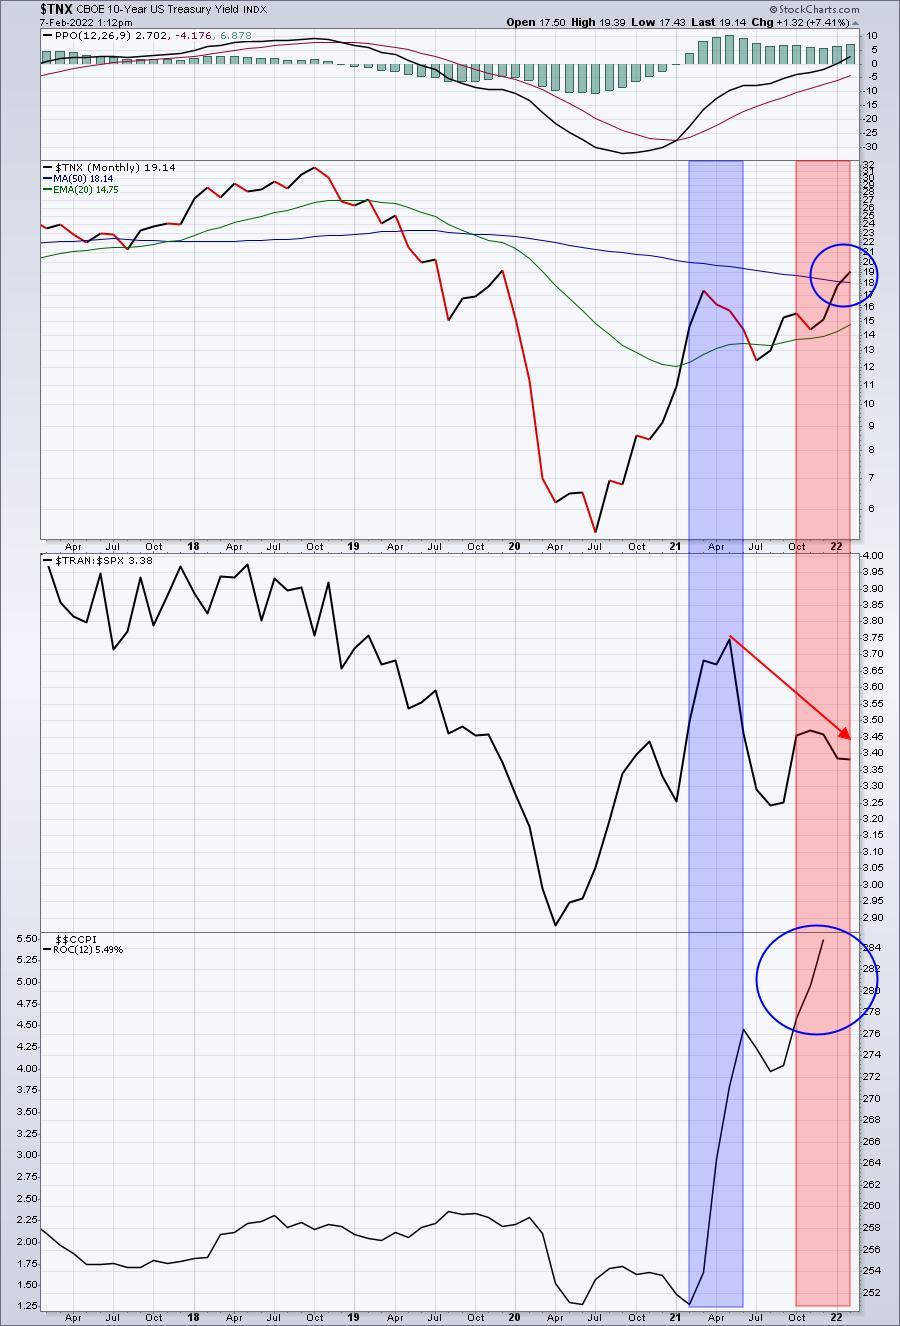
The blue-shaded area represents the inflationary surge back from February-May 2021. We had seen a surge in the 10-year treasury yield ($TNX) and also a surge in the relative strength of transports ($TRAN:$SPX). So was it inflation or economic strength that was driving bond investors to the sidelines? I could argue either side. But this latest breakout in the TNX is coinciding with the surge in inflation, while transports FALTER on a relative basis. This latest signal is a clear one that says Wall Street is now turning its attention more to inflation. That's bad for U.S. equities and fits into a potential cyclical bear market theme.
ChartLists/Strategies
We continue to add new products to help our members navigate a very difficult market and make more informed investing and trading decisions. Listen, if our goal is perfection, we'll continually fall short. Our goal should be to improve our decision-making process to improve our odds for success. It should be knowing when to be more aggressive and when to be more defensive. We need to learn to listen to market signals better. We need to sharpen those signals. Those are all goals I strive for and, quite honestly, I tend to learn more about the market by making mistakes rather than by making great calls.
One ChartList that we've added the past 3-4 weeks is our Upcoming Earnings Relative Strength ChartList. If you haven't used it or considered it, I'd encourage you to do so. We spend many hours putting this together for our EB members every week and I believe it's one of the absolute BEST signals to pay attention to heading into earnings. Personally, I would NEVER hold any stock showing relative weakness among its peers into its earnings report. I think the risk is WAAAAY too great. Below are the best relative performers among the 332 companies that we're tracking. These are companies where I'd expect solid quarterly results (but not necessarily great market reactions):
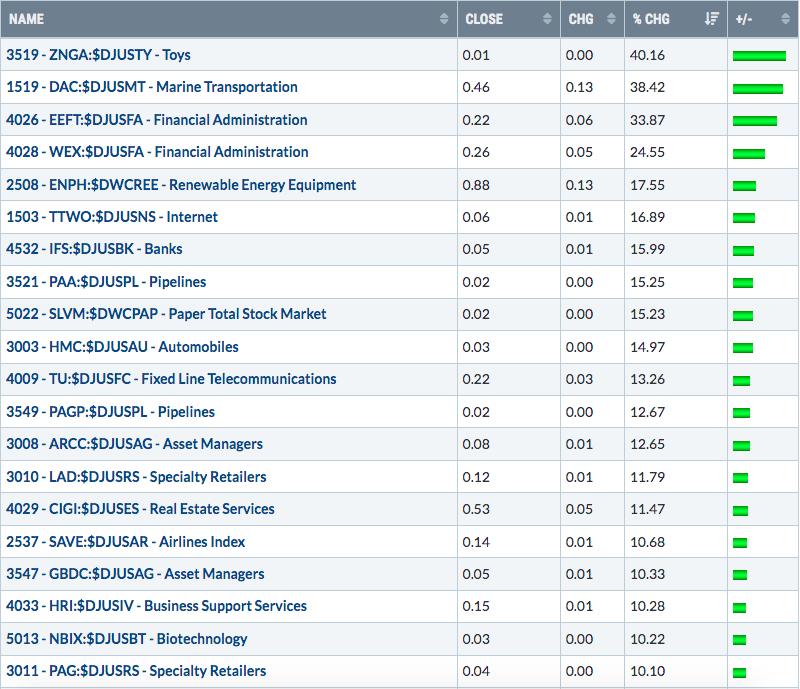
For me, this is the STARTING point of my analysis. Nothing is a replacement for actually looking at the absolute and relative strength charts of each company. After reviewing these 20 companies and their respective charts, here are my two favorites as they approach their earnings this week:
PAA:
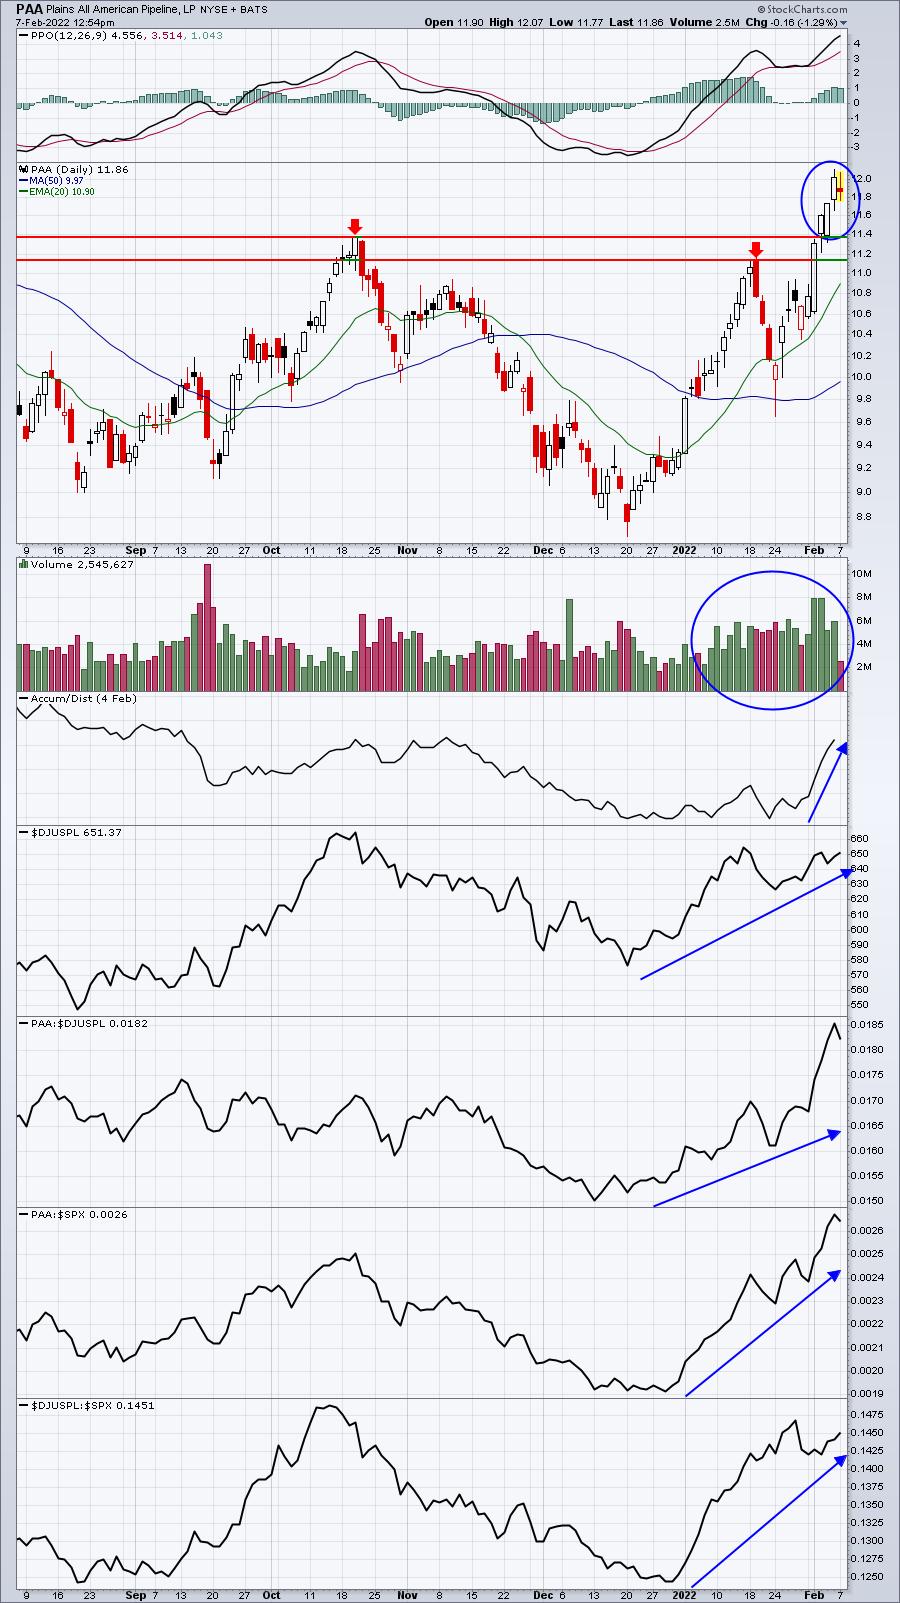
PAA reports its results Wednesday after the close. In the ChartList above, the number before the ticker symbol provides the earnings date. The first number correlates to the day of the week. For PAA, 3 is the first number, which means it reports on Wednesday (3rd day of week). The second number will be either 0 or 5. 0 means it's a "before market opens (BMO)" report. 5 means it's a "after market closes (AMC) report. So PAA has a 35 to start its number, which is Wednesday afternoon. Keep in mind that we do this manually and errors can be made from time to time, so I'd strongly encourage you to confirm the dates and times ALWAYS. Pipelines ($DJUSPL) have been a very strong industry group and PAA has been a strong stock within that space. Leading stocks in leading industry groups generally produce strong results. It doesn't always mean "gap higher" though. If PAA delivers a strong report and it pulls back to the levels of the recent breakouts, that would represent strong entry, in my opinion. We'll soon find out if PAA reports strong results.
ARCC:
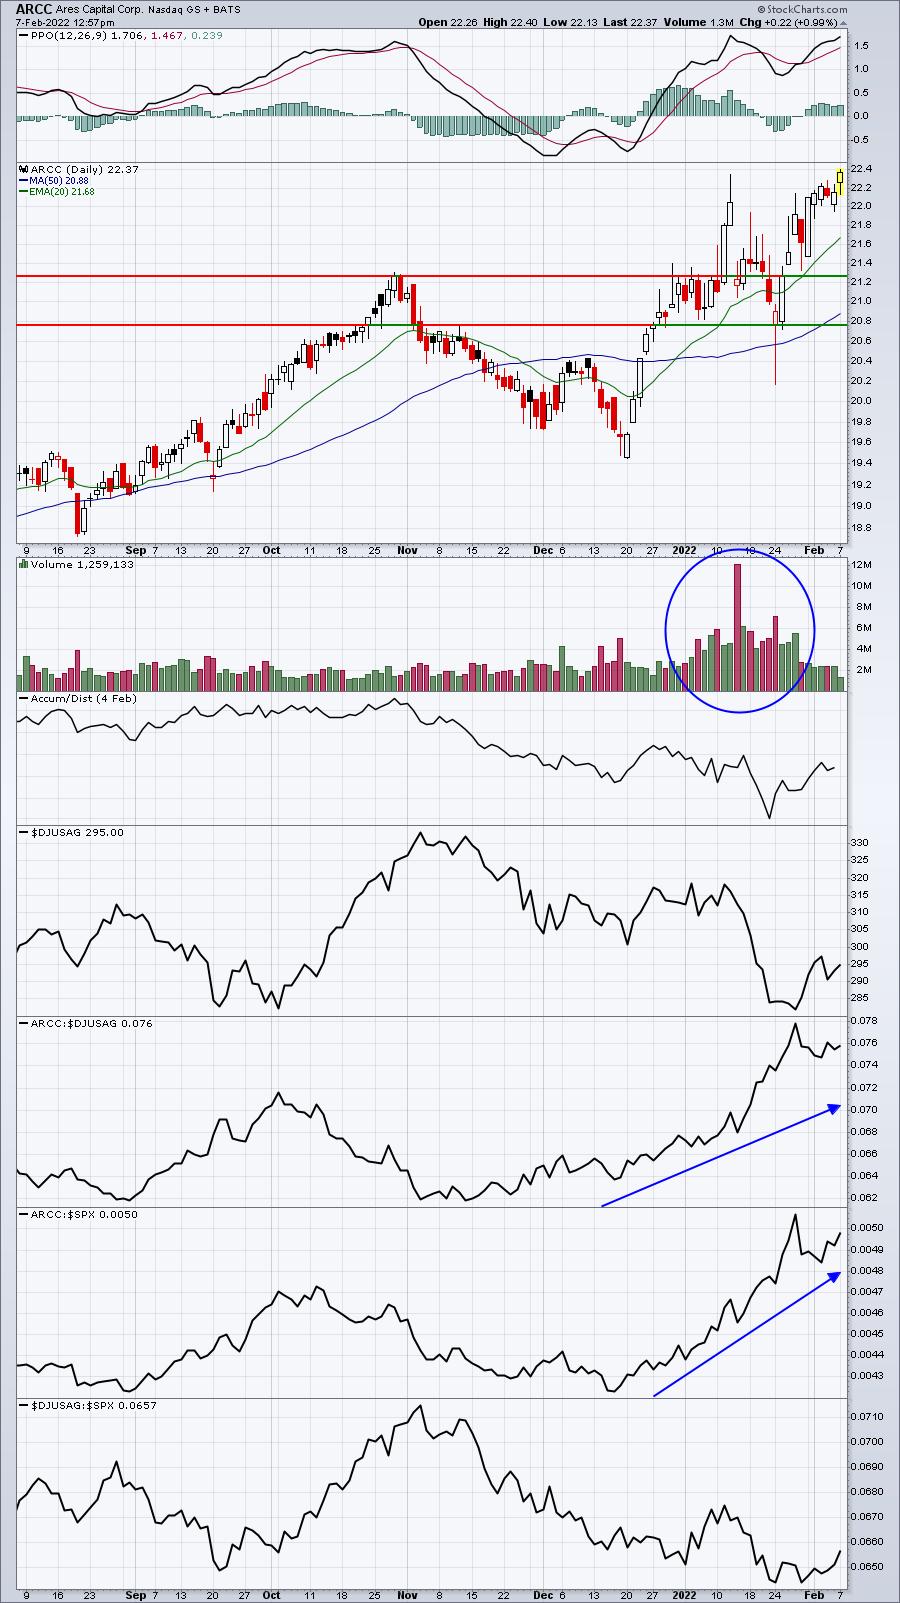
ARCC starts with the number "30", so that means it will report Wednesday morning (before the market opens). This one is a little different than PAA. ARCC's industry group, asset managers ($DJUSAG), has not been great for the past 3 months, but ARCC has still been able to easily outperform the S&P 500, because it's one of the best asset managers stocks right now on a relative basis. We'll find out how this strength translates on Wednesday morning.
This is a great resource to at least consider in making your decision to buy or sell a stock before earnings.
Earnings Reports
Here are the key earnings reports for the next two days, featuring stocks with market caps of more than $10 billion. I also include a few select companies with market caps below $10 billion. Finally, any portfolio stocks that will be reporting results are highlighted in BOLD. If you decide to hold a stock into earnings, please understand the significant short-term risk that you are taking. Please be sure to check for earnings dates for any companies you own or are considering owning.
Monday, February 7:
AMGN, SPG, TSN, ON, ZBH, PFG, TTWO, NUAN, HAS, CNA, BAP, ACM, THC, AMG, LEF, SSD, TDC, VRNS, CHGG, KMT, RMBS, ENR, CRNC, ACLS, AOSL, SLQT
Tuesday, February 8:
PFE, BP, SPGI, FISV, TRI, CNC, KKR, CMG, DD, SYY, CARR, YUM, TDG, CVE, WTW, GFS, IT, STE, WMG, CNHI, YUMC, FLT, PAYC, PEAK, ENPH, UDR, J, OMC, INCY, MAS, CCK, ATO, FMC, LYFT, JKHY, QGEN, LEA, ARMK, AIZ, AGCO, DOCS, XPO, PTON, HLIT, COTY, NEWR, AZTA, VVV, INSP, NVT, VIRT, HOG, NCR, ONTO, APPS, TMHC, CNO, VSH, HUBG, USNA, ICHR, VREX
Economic Reports
None
Happy trading!
Tom