
EB Daily Market Report - Tuesday, February 8, 2022
Executive Market Summary
- Futures were mixed overnight and we saw a bifurcated open with the Dow Jones leading to the upside
- Meanwhile, the NASDAQ opened lower, but has since turned positive
- All of our key indices are higher intraday, though we've seen late-day selling quite often in 2022 - let's see how we finish
- Financials (XLF, +1.39%), benefiting again from a rise in the 10-year treasury yield ($TNX, up 4 basis points to 1.95%), leads all sectors
- Banks ($DJUSBK, +2.00%) and life insurance ($DJUSIL, +2.10%), two beneficiaries of rising rates, are both helping to lift financials
- Crude oil prices ($WTIC, -1.75%) have fallen back beneath $90 per barrel, sending energy shares (XLE, -1.94%) lower
- 8 of the 11 sectors are higher today, however, including both consumer discretionary (XLY, +1.08%) and technology (XLK, +0.93%); to sustain today's intraday advance, we'll likely need to see further strength in both
- Growth stocks (IWF) are up slightly relative to value stocks (IWD), though their overall relative weakness since late 2021 has been quite apparent
Market Outlook
Yesterday, I looked at the XLY:XLP ratio (discretionary vs. staples) on a very short-term basis. Today, I thought I'd pull it up on an intermediate-term basis (hourly chart over past couple months) to help better understand signals that we should at least pay attention to. I'll be the first to say that the combination of price and volume is our primary indicator. EVERYTHING else is secondary, including ratios, divergences, overbought/oversold, etc. But I like to follow other signals to help confirm or refute what I'm seeing in price action. If I see a price breakout and it's supported by (1) strong sustainability ratios like the XLY:XLP, (2) a strong PPO (momentum), and (3) a chart that's not too overbought, then I'm going to trade on the long side with much more confidence. The biggest problem I have right now is realizing the stock market could REALLY use a reset in the equity only put call ratio ($CPCE), which will require an extended period of consolidation or outright selling. But let's look at that XLY:XLP ratio on an hourly chart (vs the S&P 500):
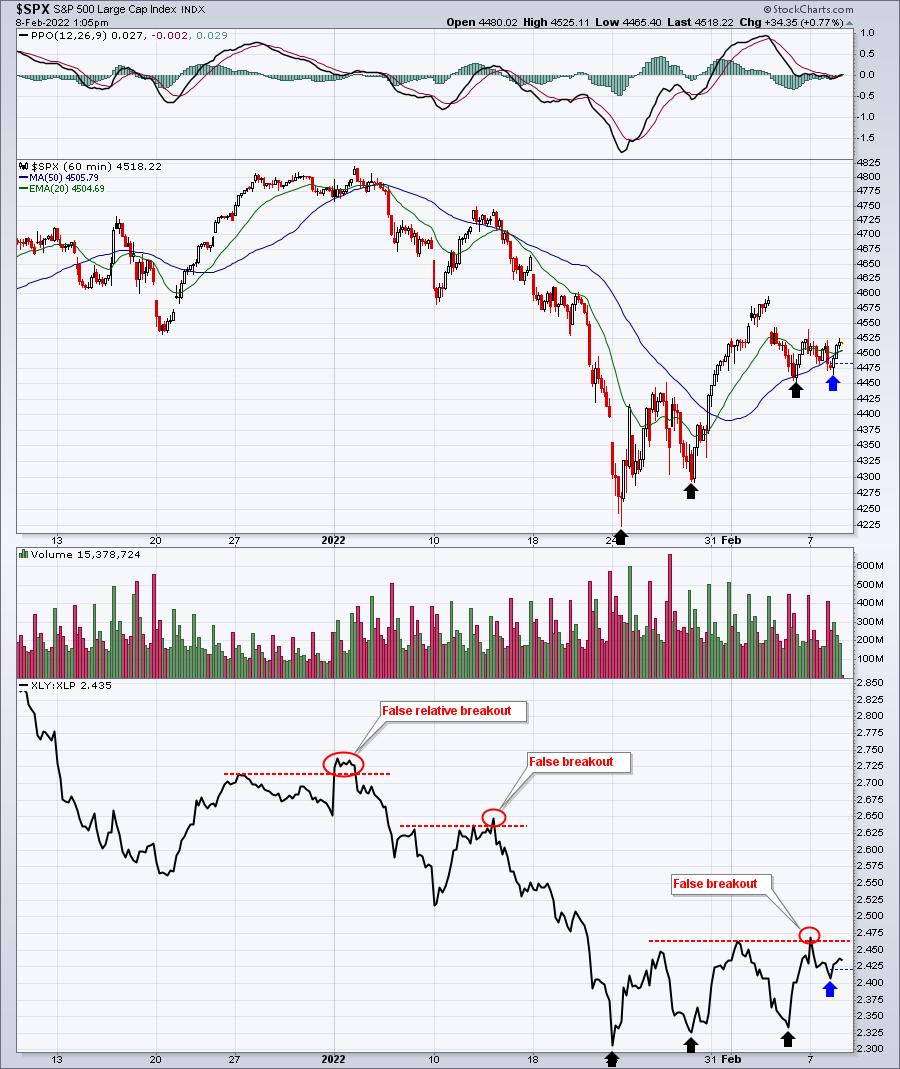
The red circles highlight false relative breakouts where we saw the XLY:XLP immediately turn back lower and end relative uptrends that are fairly important to sustain rallies. The overall trend, meanwhile, is clearly lower and that unequivocally tells us that Wall Street is reallocating resources from offense to defense. It's going to be very difficult to sustain any rally if this XLY:XLP ratio does not turn higher and then trend higher. A breakout above that latest red circle on Monday morning would be the initial step to repairing the recent technical damage.
The black arrows show the rising lows in the S&P 500, but they also show the XLY:XLP ratio moving back down close to previous lows. That does not give the market a very good look and tells me its recent rally is most likely unsustainable. The blue arrow, however, shows this ratio staying well above its most recent previous low while price action nearly tested that previous price low. That's at least one positive on the chart, but to truly see a sustainable move to the upside, we need to see price ultimately clear both 4600 and the 50 day SMA, currently at 4613 (not pictured above because this is an hourly chart, not daily).
On my Trading Places LIVE show this morning, I also mentioned that the S&P 500 keeps failing at its 20-day EMA, so I suggested any strength up to the 20-day EMA is not that significant technically. We need to see that first breakout:
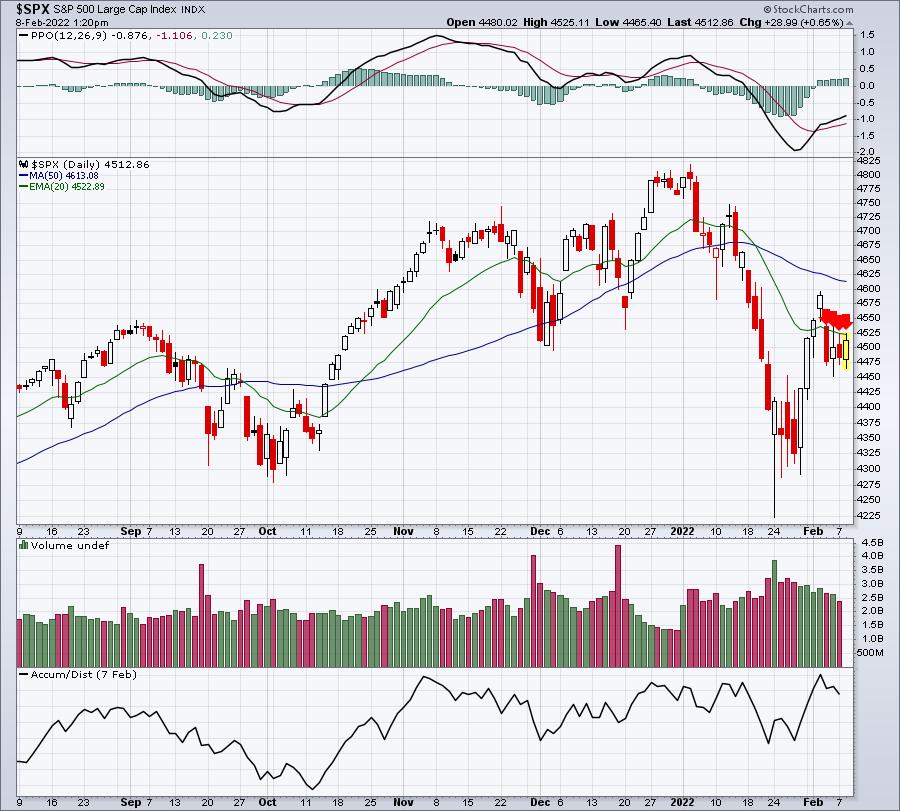
4 days in a row of touching that 20-day EMA without once closing above it. If we go back to a very short-term intraday chart (5-day, 10-minute chart), check out the S&P 500 making a higher high today without the XLY:XLP following suit:
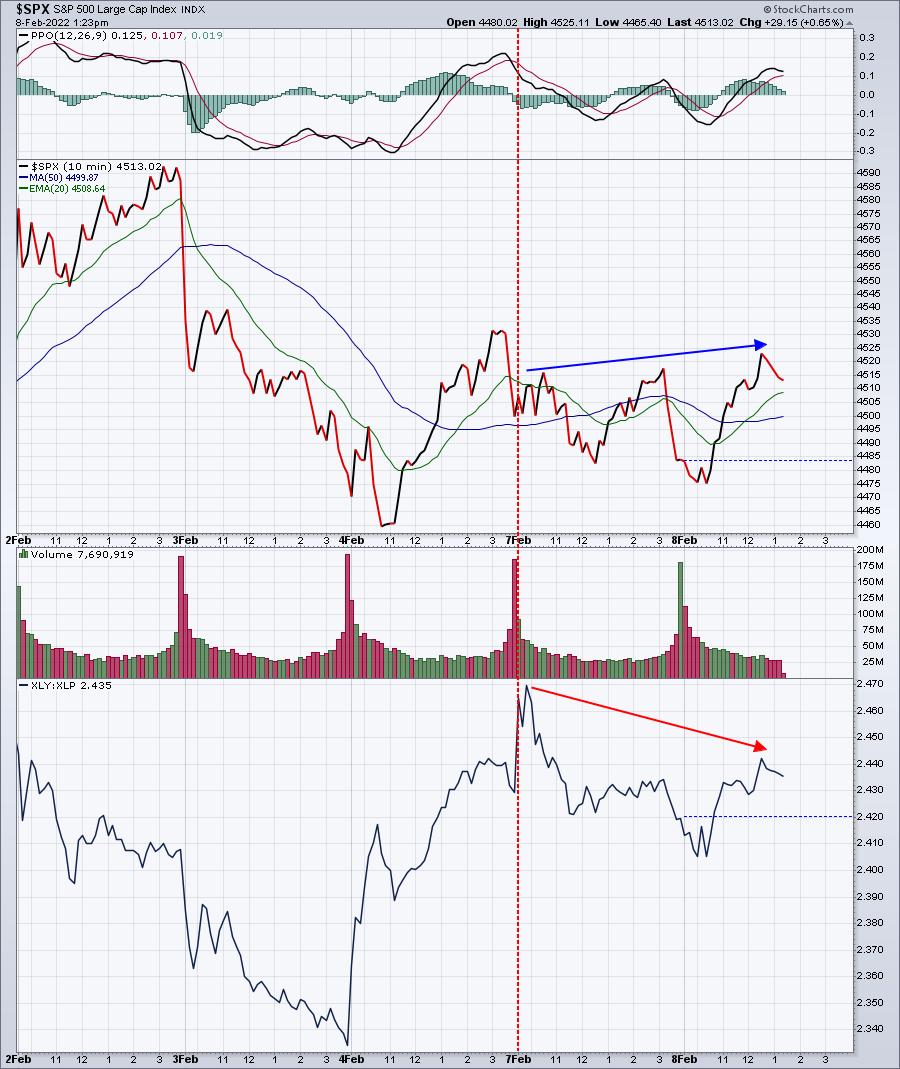
Hey, this can all change. Alls it takes is a surge to the upside with that XLY:XLP surging with it. But right now, I'm skeptical because of the points I've made above. Also, and this is VERY important, the January CPI report will be released on Thursday morning in pre-market (8:30am ET). Knowing what I know about where these inflation numbers are heading, I couldn't in good conscience be buying stocks into that report. But I can also say I've seen stranger things in the stock market.
Just be careful.
Sector/Industry Focus
I continue to like gold ($GOLD). It's been moving back and forth within a symmetrical triangle, which I believe will ultimately resolve itself to the upside. Here's the latest look at that triangle:
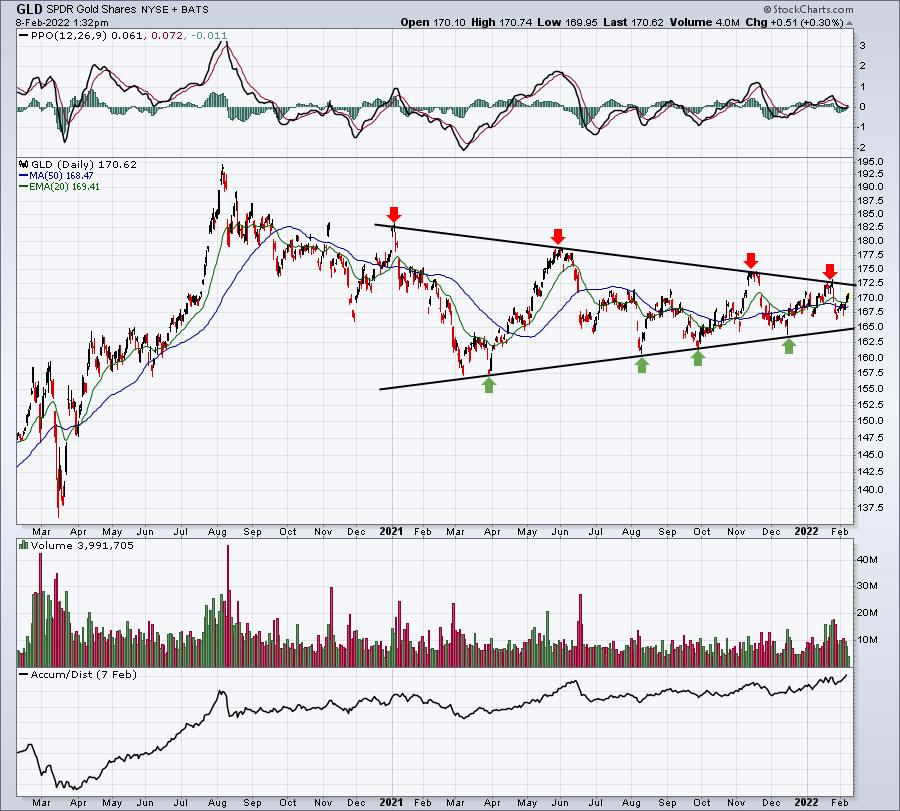
Check out the AD line in the bottom panel. There certainly appears to be accumulation taking place on weakness. As I said before, this pattern doesn't confirm until we see the breakout to the upside, but I still believe there's a reasonable chance to see $2000 gold by the end of this quarter and if volatility and weakness remain with us throughout much of 2022, I don't believe it's a stretch that we could see $2500 gold during the year.
(Full Disclosure: I own GLD)
ChartLists/Strategies
I bought a position this morning and I'm constantly asked to walk through trades, including my thoughts along the way, so I thought I'd take a couple minutes to go over the reasons for the trade I made this morning and what I'm looking for:
Bought PH at 302.32 this morning.
Why? Parker Hannifin (PH) beat revenue and EPS estimates when it reported its quarterly results several days ago. They also raised guidance, so I kept the stock on my radar - at least initially. Earlier this morning, I was working to update the Strong Earnings ChartList (SECL) for all of last week's earnings reports and I saw PH has beaten estimates, which reminded me of the earlier beat, then looked at this chart:
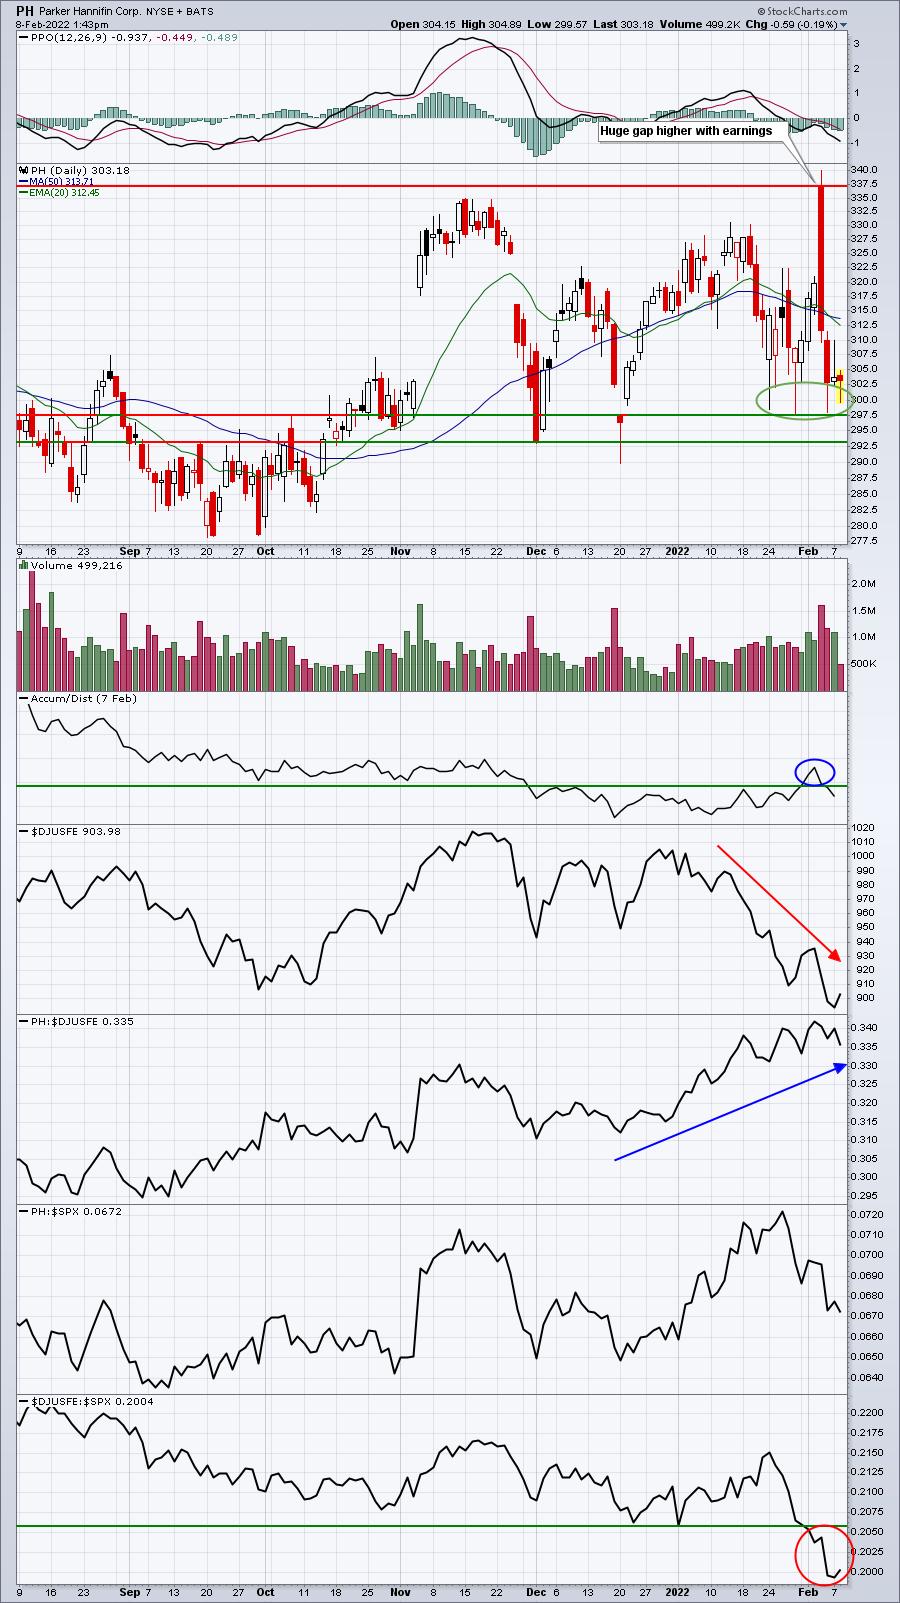
This is a perfect example of how ruthless the stock market can be from time to time and how imperfect and inefficient it is in the near-term. After PH reported stellar results, beating estimates and raising guidance, it proceeded to gap more than 5% higher. Those who chased at the open potentially rode the stock lower by 12% over the next 24 hours. While no trade is a guaranteed profit, I do think a lot of the risk has been shaken out of this stock. Also, the 298-305 area has been tremendous price support over the past couple weeks. Building a position from the current range down to the December low close to 293 makes sense. Below that and I'd take the loss.
I believe this is a case of the "baby thrown out with the bath water." PH has shown tremendous relative strength, but its peers in industrial machinery ($DJUSFE) have been crushed. PH has simply followed suit. This area seems to be strong support, so I took the chance. We'll see what happens and I'll try to revisit this trade in future DMRs as conditions change. While my goal (target) would be a retest of that opening gap near 337, I'd consider selling sooner if we see a quick move higher. The 20-day EMA and 50-day SMA are both near 312-313. That'd be an interesting spot to take quick profits if PH rebounds quickly.
Earnings Reports
Here are the key earnings reports for the next two days, featuring stocks with market caps of more than $10 billion. I also include a few select companies with market caps below $10 billion. Finally, any portfolio stocks that will be reporting results are highlighted in BOLD. If you decide to hold a stock into earnings, please understand the significant short-term risk that you are taking. Please be sure to check for earnings dates for any companies you own or are considering owning.
Tuesday, February 8:
PFE, BP, SPGI, FISV, TRI, CNC, KKR, CMG, DD, SYY, CARR, YUM, TDG, CVE, WTW, GFS, IT, STE, WMG, CNHI, YUMC, FLT, PAYC, PEAK, ENPH, UDR, J, OMC, INCY, MAS, CCK, ATO, FMC, LYFT, JKHY, QGEN, LEA, ARMK, AIZ, AGCO, DOCS, XPO, PTON, HLIT, COTY, NEWR, AZTA, VVV, INSP, NVT, VIRT, HOG, NCR, ONTO, APPS, TMHC, CNO, VSH, HUBG, USNA, ICHR, VREX
Wednesday, February 9:
DIS, CVS, GSK, EQNR, CME, UBER, HMC, ORLY, MFC, MSI, TWLO, SLF, IFF, EFX, CDW, SGEN, FOXA, MGM, ACGL, TRMB, MOH, BG, LUMN, CDAY, RE, AFG, NLY, REXR, GFL, ARCC, ZNGA, TEVA, LAD, PAA, EQT, CCJ, ITT, PAG, MAT, PPC, IIVI, ASGN, REYN, RPD, WTS, DIOD, ENSG, MC, SONO, CGC, RAMP, CRTO, KN, PI, IRBT, AVYA, TWOU, TGI
Economic Reports
None
Happy trading!
Tom