
EB Daily Market Report - Wednesday, February 9, 2022
Executive Market Summary
- Futures were higher overnight and saw an excellent gap higher to start the session
- After a third day of relatively few economic reports of any kind, that changes tomorrow when the January CPI report will be released
- The 10-year treasury yield ($TNX) hit 1.97%, a 23-month high, prior to dropping back the past 24 hours
- All 11 sectors are trading higher today, led by real estate (XLRE, +1.92%), communication services (XLC, +1.89%), and materials (XLB, +1.88%)
- Technology (XLK, +1.73%) and consumer discretionary (XLY, +1.42%), two key sectors, are also having strong days thus far
- Consumer staples (XLP, +0.08%), a defensive group, is today's primary laggard
- Media agencies ($DJUSAV, +4.66%) are particularly strong, led by Omnicom Group (OMC, +13.08%) after the company reported excellent quarterly results, handily beating both revenue and EPS estimates
- Commodities are mostly higher, especially copper ($COPPER, +3.13%)
Market Outlook
Depending on where we close today, there are more positive signs that have developed. For instance, the XLY:XLP ratio that I've been discussing often of late did, in fact, make at least a short-term breakout to support today's intraday advance:
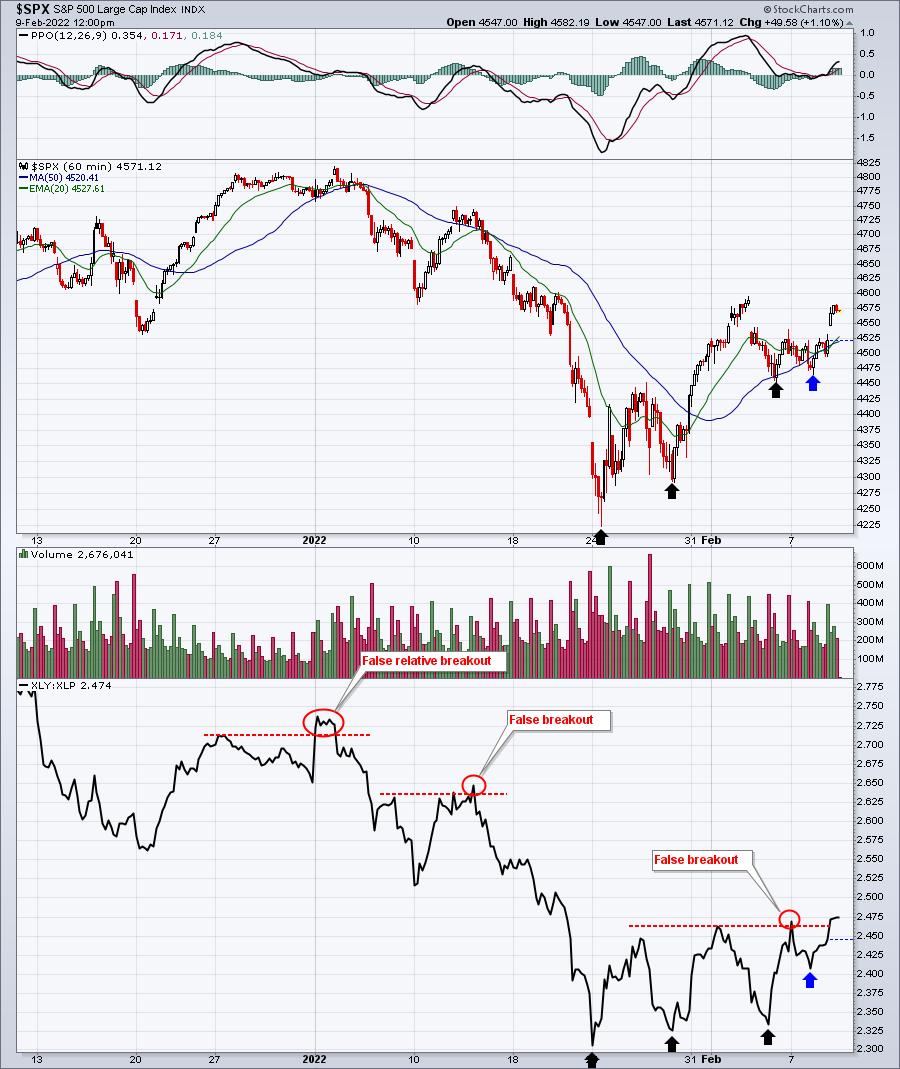
The S&P 500 is quickly approaching the high from last week just beneath the 4600 level. It's also not far from the 50-day SMA, which currently stands at 4611. If this the end of the advance? Is the XLY:XLP ratio breaking out the fourth false breakout of 2022? That's the bearish argument, along with the obvious bigger picture concerns involving higher inflation and higher interest rates.
This afternoon and tomorrow morning will be most interesting. Has the selling been overdone on growth stocks, so that we might be able to push higher and consolidate near-term? Or has the selling just begun, with tomorrow's CPI report triggering yet another highly-volatile decline?
I'd favor the latter, but honestly anything goes with the stock market. I believe we'll have another scary selloff or two, but one doesn't have to occur now. Let's see how we close today, open tomorrow, and go from there.
One last thing and this could be very important, depending on your view. During the January swoon, the QQQ dropped 50 bucks from the close on January 3rd to the close on January 21st. The NET of all the gaps during that period was -10, meaning that we saw gap ups and gap downs during those 18 days that cumulatively was a NET GAP DOWN of 10 bucks. The remaining 40 dollar drop occurred intraday. On January 24th and January 25th we saw HUGE gaps lower, followed by intraday buying. In my opinion, that was market makers returning from "vacation". Now, would you like to get a sense of what's truly happened since that January 25th close? From January 25th through the February 8th close (yesterday), the QQQ rose 14.55. The NET GAP UP during this period was 11.59, while the actual intraday buying accounted for just 2.42 of the climb. So the January decline was roughly 21% gap downs and 79% intraday selling (distribution). The recovery, on the other hand, has been 83% gap ups and 17% intraday buying (accumulation). This does not include today's activity where once again we saw a big GAP UP. Where will we finish today? Could we see a weak finish, adding to the unusual behavior the past two weeks?
I don't know, but this seems like manipulation to me. I'll discuss more on this at Saturday's "The Anatomy of a Cyclical Bear Market" event. By then, I'll have more data as well.
Sector/Industry Focus
I looked at our relative strength industry group ChartList to see which industry has performed best over the past week as the overall market tries to break out. First, here are the Top 10 industries, followed by the Bottom 10 industries:
Top 10:
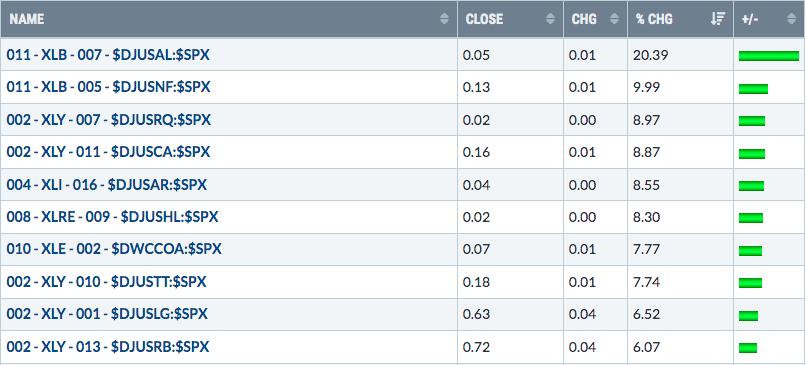
Notice what's missing? Semiconductors ($DJUSSC). Software ($DJUSSW). Computer hardware ($DJUSCR). Renewable energy ($DWCREE). Internet ($DJUSNS). Autos ($DJUSAU). Truckers ($DJUSTK). These are six fairly critical industry groups and not one of them is in the Top 10 industry groups leading this latest charge higher. The first 5 industries should do well in a growth environment, while the 6th (truckers) is more economically-sensitive.
Bottom 10:
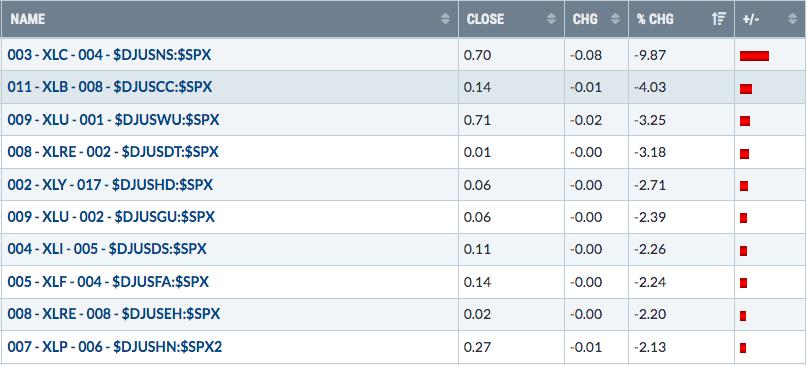
Well, we now know where internet fell on the list. It's dead last over the past week, thanks in large part to Meta Platforms (FB).
Let's get back to that solid performing aluminum group ($DJUSAL). Check out this breakout:
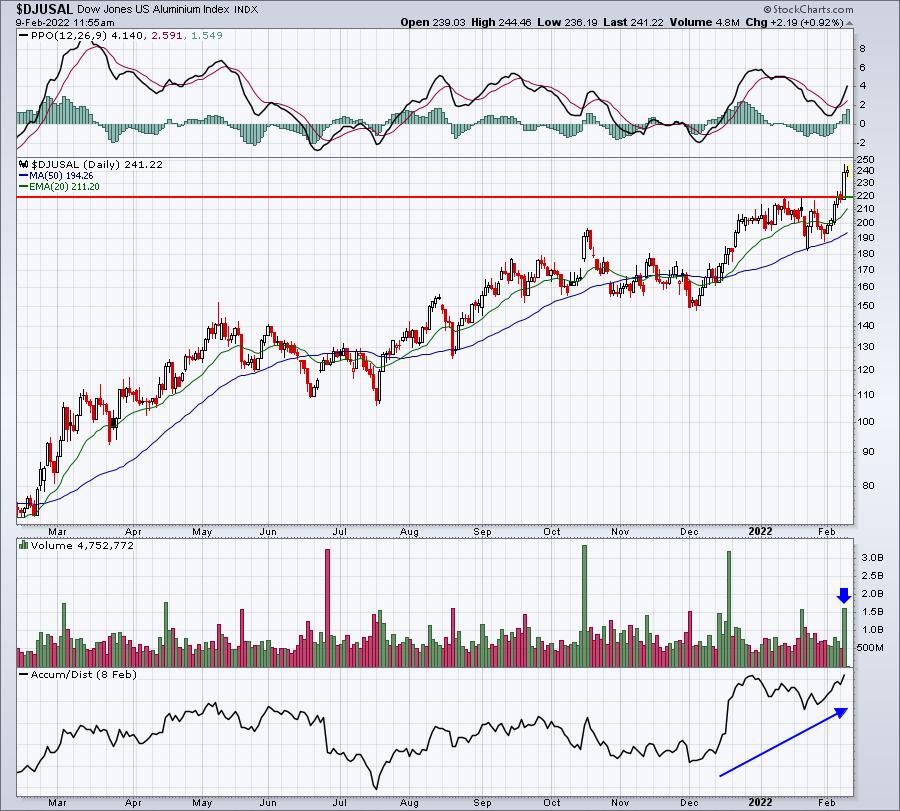
The heavy volume (blue arrow) supported yesterday's breakout and the new high in the AD line helps to confirm the outperformance here. It sure looks like aluminum stocks are being accumulated, which is interesting as we're now less than 24 hours away from our latest inflation report at the consumer level.
ChartLists/Strategies
I said I'd follow my PH trade through conclusion. Well, it's concluded. I never scoff at a 3% profit in 24 hours in a volatile market. If the overall market stays strong, sure PH could go much higher. But what if we see a reversal later today or after a hot CPI report tomorrow? I can walk away with 3% in ONE day or continue to risk my investment. I chose the former. Here's what the chart looks like now:
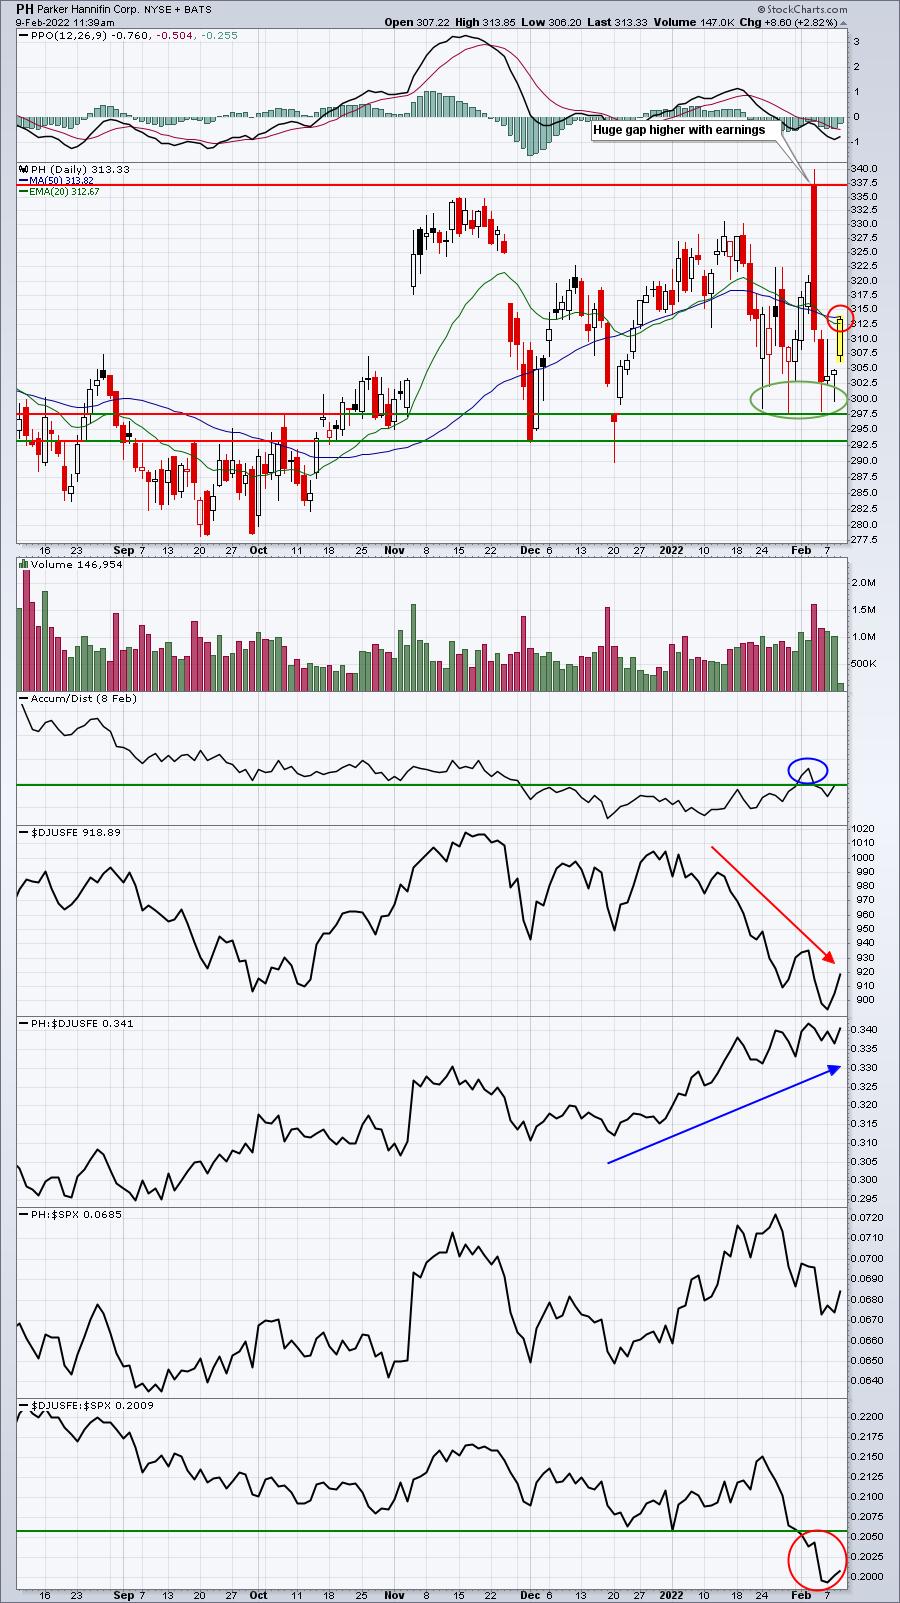
This is the same chart I highlighted yesterday. The only annotation that I added was the red circle at the 20-day EMA and 50-day SMA. I said yesterday that if PH could rally quickly to that level, I'd likely take the profit. That's what I did. If you bought and decide to hold, I'd look for confirmation of a close above both these moving averages. Then a close back beneath both would be my cue to be sure to book profits.
Earnings Reports
Here are the key earnings reports for the next two days, featuring stocks with market caps of more than $10 billion. I also include a few select companies with market caps below $10 billion. Finally, any portfolio stocks that will be reporting results are highlighted in BOLD. If you decide to hold a stock into earnings, please understand the significant short-term risk that you are taking. Please be sure to check for earnings dates for any companies you own or are considering owning.
Wednesday, February 9:
DIS, CVS, GSK, EQNR, CME, UBER, HMC, ORLY, MFC, MSI, TWLO, SLF, IFF, EFX, CDW, SGEN, FOXA, MGM, ACGL, TRMB, MOH, BG, LUMN, CDAY, RE, AFG, NLY, REXR, GFL, ARCC, ZNGA, TEVA, LAD, PAA, EQT, CCJ, ITT, PAG, MAT, PPC, IIVI, ASGN, REYN, RPD, WTS, DIOD, ENSG, MC, SONO, CGC, RAMP, CRTO, KN, PI, IRBT, AVYA, TWOU, TGI
Thursday, February 10:
KO, PEP, AZN, PM, LIN, DUK, MCO, ILMN, DDOG, GPN, DXCM, RSG, MTD, NET, TU, MT, PCG, TWTR, EXPE, ZBRA, LH, VRSN, MLM, DTE, HUBS, FE, K, SSNC, BIO, MPWR, CFLT, ALNY, AFRM, KIM, IPG, EQH, GDDY, ZG, REG, ZEN, CSL, DVA, TPR, WSO, MHK, AVLR, HII, WU, EEFT, FLO, CYBR, BL, QLYS, HRI, ELY, NSP, UPWK, MAC, GOOS, SSTK, NSIT, TEX, GPI, COUR, VCRA, TTGT, FROG, TGH, BTU, COHU, EB
Economic Reports
December wholesale inventories: +2.2% (actual) vs. +2.0% (estimate)
Happy trading!
Tom