
EB Daily Market Report - Thursday, February 10, 2022
ChartLists Updated
We've updated the Strong Earnings ChartList (SECL) and Strong Future Earnings ChartList (SFECL) through Monday, February 7th's earnings. The SECL is much, much smaller than it's been in recent quarters, because of two primary factors. First, not as many companies are beating both revenue and EPS estimates. Second, and perhaps more importantly, the charts of many companies have simply turned more bearish as the January selling took its toll. You'll see that several charts added are not necessarily in uptrends, but they're leaders within their industry. I wanted to continue to include those companies in the event we spot a market bottom. Generally, money will rotate first into industry leaders.
Executive Market Summary
- Futures were relatively flat until the January CPI report was released at 8:30am ET
- There was an immediate and drastic drop in futures when the CPI and Core CPI both came in above expectations
- The headline inflation number hit 7.5%, its highest level since 1982
- The 10-year treasury yield ($TNX) is up 9 basis points to 2.02%, the highest we've seen since July 2019
- Materials (XLB, +1.33%), energy (XLE, +0.89%), and financials (XLF, +0.39%) are the only 3 sectors up currently
- Technology (XLK, -1.34%) is the hardest-hit sector as telecom equipment ($DJUSCT, -1.96%) and software ($DJUSSW, -1.48%) lead this aggressive sector lower
- Most commodities are higher with crude oil ($WTIC, +1.86%) jumping back above $91 per barrel, while copper ($COPPER, +1.85%) surges for a second straight day
- The S&P 500 leaderboard is dominated by materials stocks - Intl Flavors (IFF, +7.10%) and Mosaic (MOS, +5.63%) are in the top two spots
Market Outlook
If today doesn't summarize what we've already experienced in 2022 and what we're likely to continue experiencing, then I'm not sure what will. At 8:30am ET this morning, the January CPI report was released and it showed that inflation at the consumer level was even a bit hotter than expected, rising 0.6%, which was slightly above the +0.5% expected. That headline number reached 7.5% annually, while core CPI hit 6.0%. Futures immediately tanked, as I would have expected. However, what I did not expect was a rebound that would carry our major indices to positive territory - or close to it.
There's still a LONG way to go in today's session, but I thought I'd show you a chart of the S&P 500 and provide black-dotted vertical lines marking the dates of recent CPI report release dates:
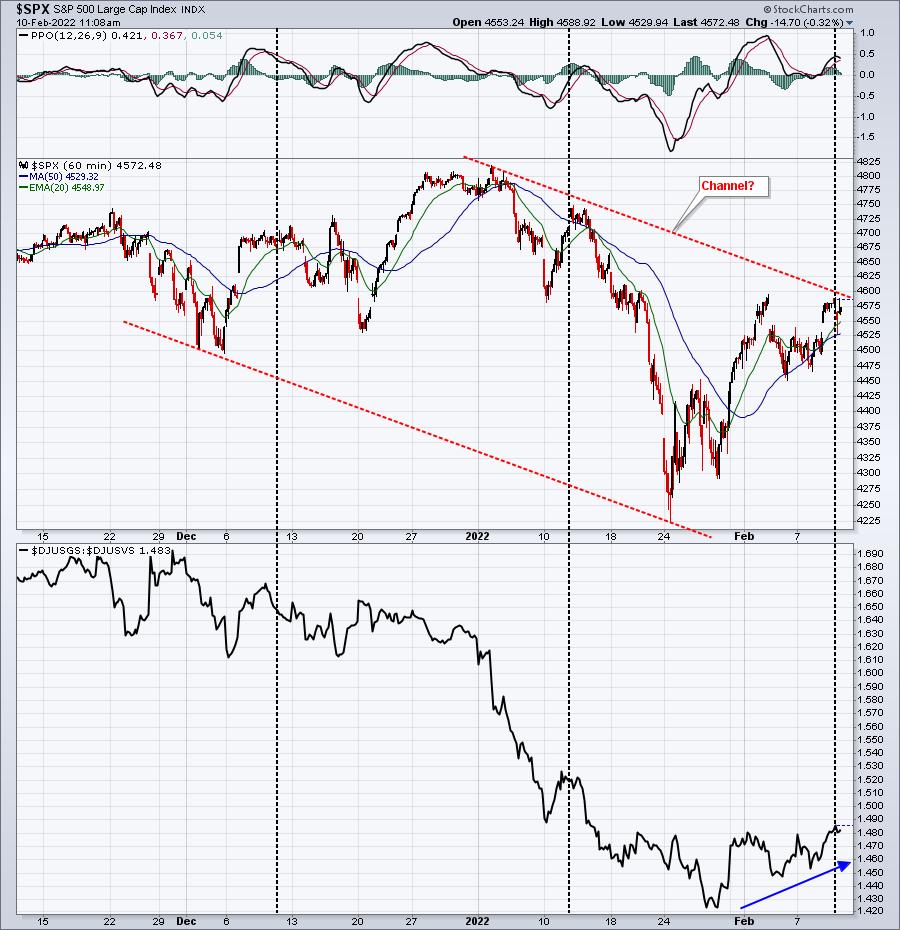
The last two times the monthly CPI report was released - on December 10th and January 12th - the S&P 500 immediately topped and began downtrending. The bottom panel shows small cap growth vs. value ($DJUSGS:$DJUSVS) struggling mightily after both reports were released. So I guess the big question is.....has the worst of inflation already been priced in? The bottom panel may give us that answer. Small cap growth was crushed in January as the DJUSGS fell nearly 20% in 4 weeks. Going back to November, the DJUSGS tumbled nearly 2000 points, falling from just above 8000 to 6100. It could be that small cap growth holds up much better during the next phase of this bear market.
The other interesting point here is that when I connected the two recent lows and drew a trendline, and then copied that same trendline and connected the all-time high in early January, it nearly intersects with the current price. So we could have a major battle right at this current level near 4600 on the S&P 500.
Sector/Industry Focus
The large cap growth names are actually struggling more than their small cap and mid cap growth peers today and that might be a theme for the next few weeks. Here's the chart of the Dow Jones U.S. Large Cap Growth Index ($DJUSGL):
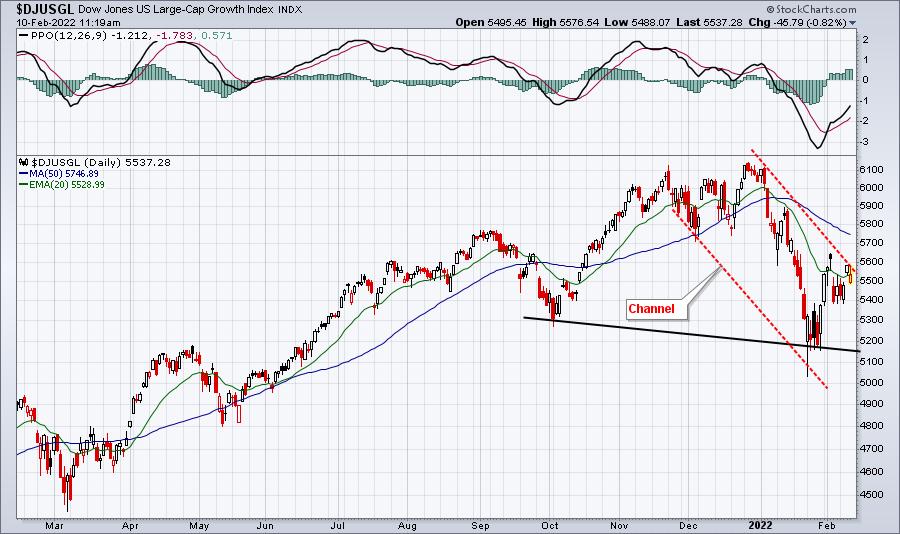
I'll be watching the 5600-5650 resistance range. If the bulls cannot negotiate that level, then the likelihood grows that this asset class rolls over. And if large cap growth rolls over, that will be a big problem for our major indices.
ChartLists/Strategies
I'm picking and choosing spots to buy a stock here or sell a stock there. I mentioned the PH trade to capture about 3% in a day. Today, I used the strength to short a stock - Abercrombie & Fitch (ANF). It reached a key gap resistance level at a time when the S&P 500 could roll over. I'll keep a tight stop on any close above this gap:
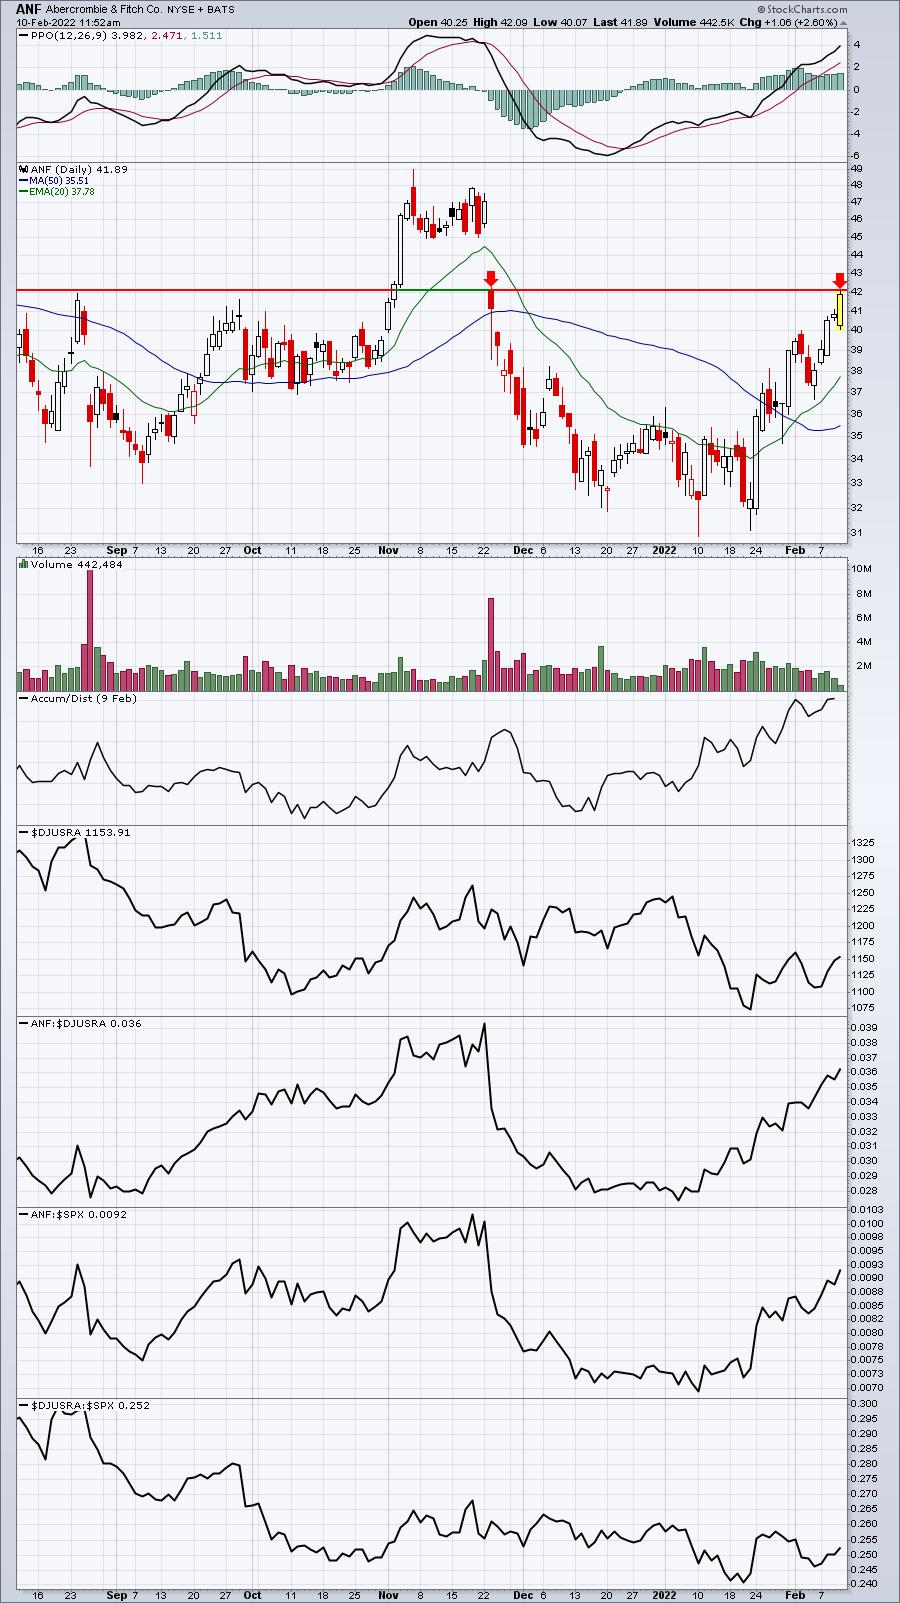
Any close above 42.06 and I'll cover. Also, any intraday move above about 42.75 and I'll cover. I'm willing to lose 2% and I have a relatively small position. No big chances here. ANF is not scheduled to report earnings until 3/2, so I shouldn't have to worry about that in the very near-term. As far as a target goes, today's low near 40 would represent a 5% gain. If it were to move their quickly, I'd probably take it. I definitely will be out on a 20-day EMA test.
ANF is showing more relative strength of late and its AD line is strengthening as well. Those are two reasons why any pullback could prompt me to take a quicker-than-usual profit.
Earnings Reports
Here are the key earnings reports for the next two days, featuring stocks with market caps of more than $10 billion. I also include a few select companies with market caps below $10 billion. Finally, any portfolio stocks that will be reporting results are highlighted in BOLD. If you decide to hold a stock into earnings, please understand the significant short-term risk that you are taking. Please be sure to check for earnings dates for any companies you own or are considering owning.
Thursday, February 10:
KO, PEP, AZN, PM, LIN, DUK, MCO, ILMN, DDOG, GPN, DXCM, RSG, MTD, NET, TU, MT, PCG, TWTR, EXPE, ZBRA, LH, VRSN, MLM, DTE, HUBS, FE, K, SSNC, BIO, MPWR, CFLT, ALNY, AFRM, KIM, IPG, EQH, GDDY, ZG, REG, ZEN, CSL, DVA, TPR, WSO, MHK, AVLR, HII, WU, EEFT, FLO, CYBR, BL, QLYS, HRI, ELY, NSP, UPWK, MAC, GOOS, SSTK, NSIT, TEX, GPI, COUR, VCRA, TTGT, FROG, TGH, BTU, COHU, EB
Friday, February 11:
ENB, D, MGA, ARES, FTS, APO, WPC, BRKR, CLF, NWL, UAA, G, CAE, GT, ESNT, COOP, PRLB
Economic Reports
Initial jobless claims: 223,000 (actual) vs. 230,000 (estimate)
January CPI: +0.6% (actual) vs. +0.5% (estimate)
January Core CPI: +0.6% (actual) vs. +0.5% (estimate
Happy trading!
Tom