
EB Daily Market Report - Friday, February 11, 2022
Special Saturday Event
We recently announced our February Educational Series, which began last Saturday, February 5th, with "The January Effect". If you didn't see it, the recording is available. Tomorrow, February 12th, I'll be presenting "The Anatomy of a Cyclical Bear Market", where I'll describe what we might expect throughout 2022 based on previous cyclical bear markets to include both duration and severity.
We'll send out room instructions in the morning. The event will start at 10:00am ET and the room should be open by 9:30am ET, at the latest. I hope to see you there!
If you can't make it live, no worries. We'll record the event and you'll be able to view the recording at your leisure.
Executive Market Summary
- Futures were relatively flat overnight and this morning, moving back and forth from slight gains to slight losses
- After opening slightly higher with a bit of strength, renewed selling kicked, eclipsing the Thursday afternoon low
- Relative weakness remains and appears to be accelerating in NASDAQ shares
- We're seeing a bit of profit taking in commodities, though crude oil ($WTIC, +1.60%) is showing strength
- Energy (XLE, +1.80%) to lead all sectors; sectors are mixed, however, with 5 higher, 5 lower, and 1 unchanged
- Weakness is primarily found in technology (XLK, -0.79%) and consumer discretionary (XLY, -0.52%)
- Semiconductors ($DJUSSC, -2.12%) are keeping downward pressure on technology shares
- Under Armour (UAA, -9.61%) is the worst performing S&P 500 stock, despite beating estimates; they warned, however, because of supply chain issues
Market Outlook
Beware the afternoon selloffs. The S&P 500 appears to have rolled over with the significant selling on Thursday. We do have key short-term support that we're approaching. The bulls really need to hold this level:
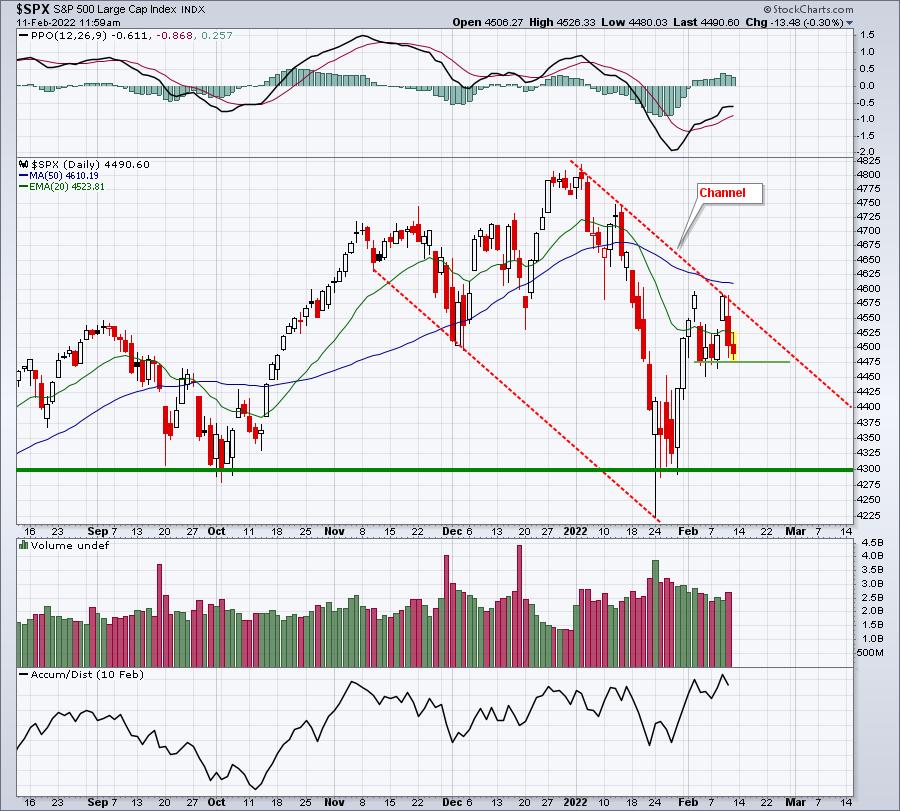
Since the rally that carried the S&P 500 to near 4600 and establish what appears to be right shoulder resistance, we have not seen a close back beneath 4477. If we lose that support, we could see a quick decline back to that major neckline support at 4300.
Downtrends typically see more bullish morning behavior and more bearish behavior in the afternoons and into the close. Thursday was a perfect example. The only strength we saw was the very first hour or so. Then we treaded water until midday, then the selling began in earnest in the afternoon, closing near the low of the day. This is a pattern that many times will repeat itself, so just remember that when you see prices higher in the morning. I personally will not chase morning strength.
Sector/Industry Focus
While the rally in the S&P 500 recently was nice on the surface, you can see from the chart below that small cap growth stocks ($DJUSGS) barely recovered any of its relative weakness vs. small cap value stocks ($DJUSVS):
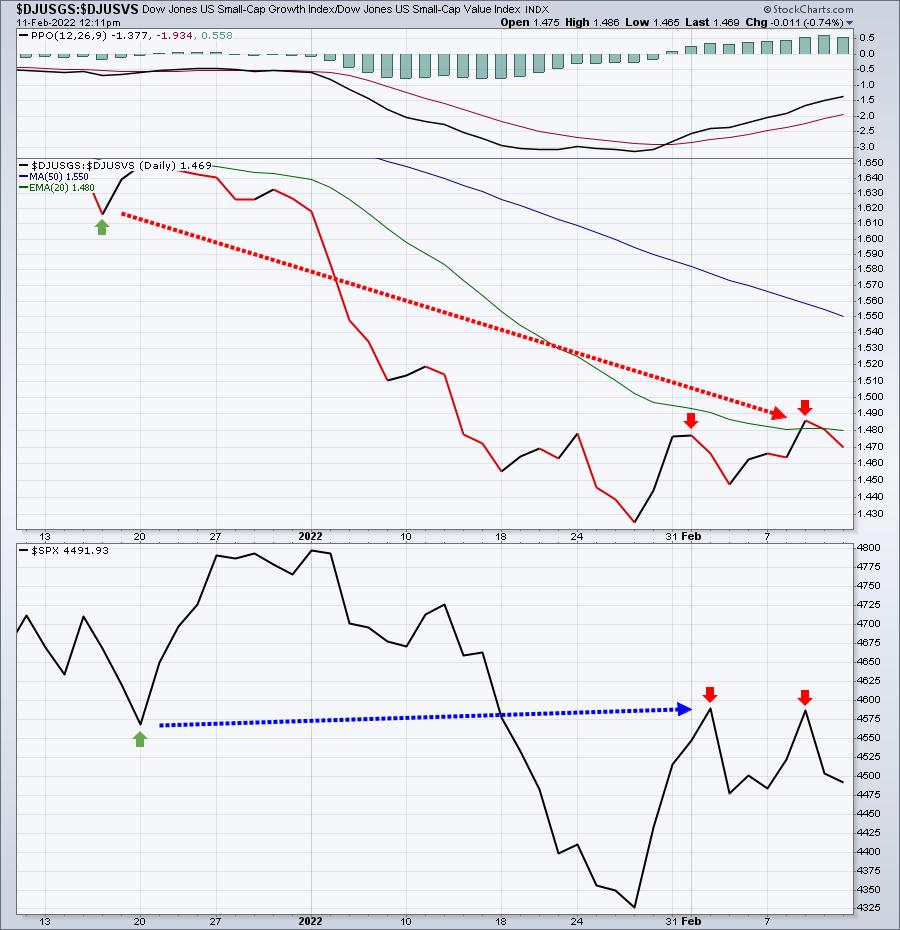
This is particularly damaging, because it's usually growth stocks that lead major market rallies. Without the relative support of growth stocks, I just don't see U.S. equities rallying back to all-time highs. Based on this chart alone, I'd say we have much more pain ahead.
I hope I'm wrong.
ChartLists/Strategies
Well, the Abercrombie & Fitch (ANF) short sell trade lasted about as long as the Parker Hannifin (PH) long trade. The opportunity to short exactly at key resistance paid off in this instance as ANF weakened into the close as the S&P 500 did, in fact, roll over as was pointed out in yesterday's DMR. Personally, I bought (covered) half near the close yesterday as I was already up 2%. I sold the balance this morning with close to a 4.5% gain. Hopefully, you're getting a picture of what I'm trying to do here. My goal is to quickly take small profits and move back to the sidelines. I definitely have more of a shorting slant right now, especially after the recent rally.
Here's the current chart on ANF:
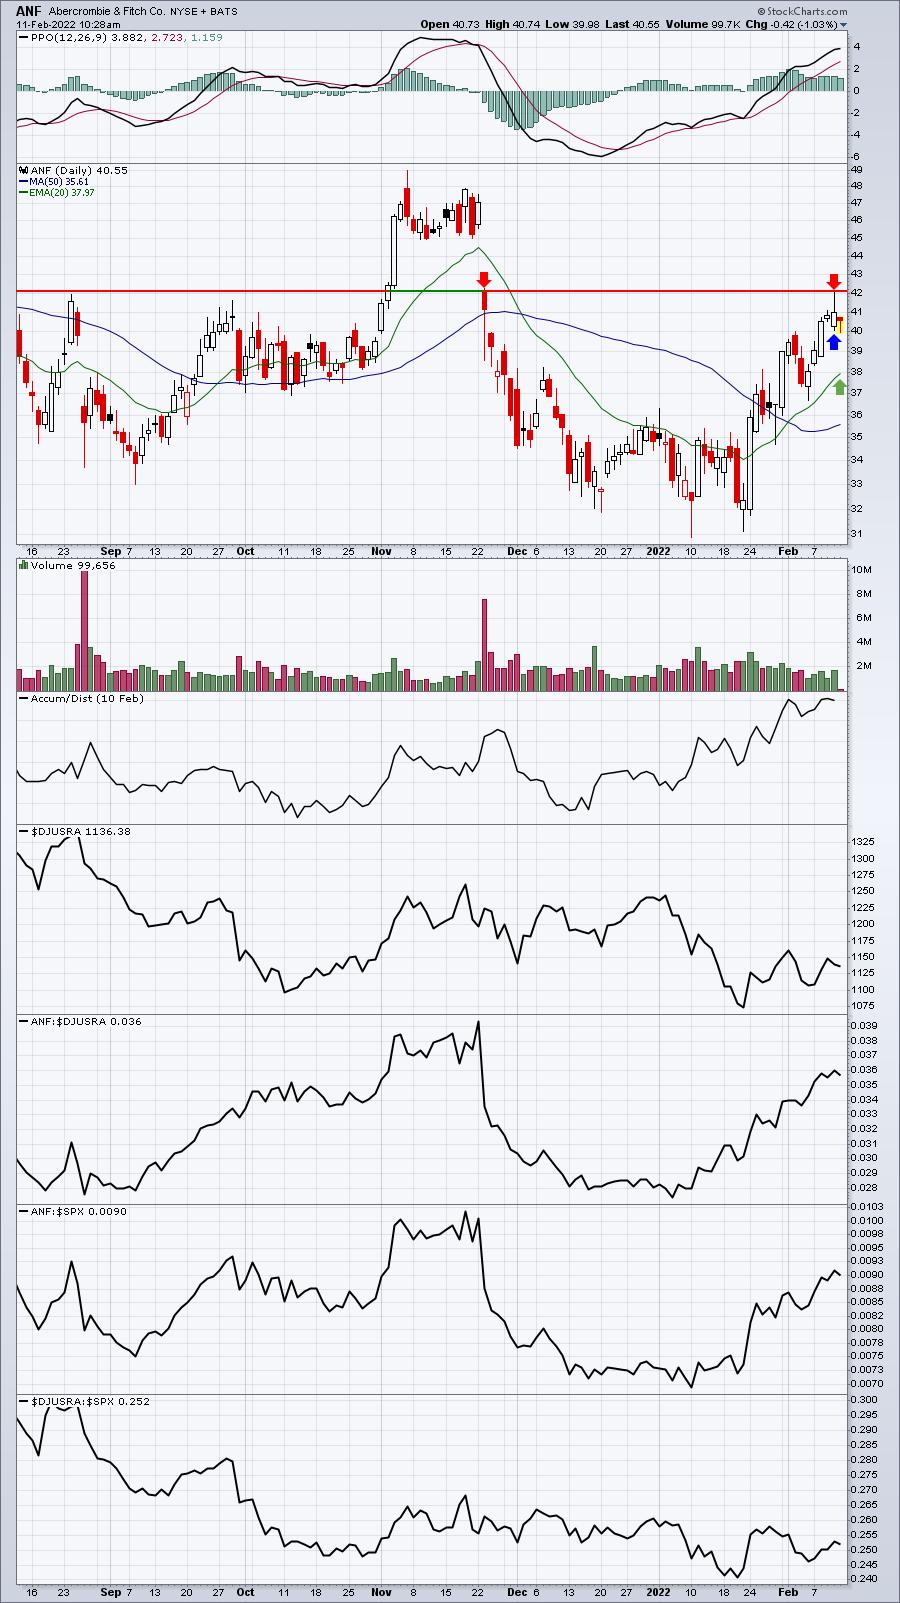
I added a blue arrow and green arrow to the chart I provided in yesterday's DMR. The blue arrow simply points to the low from Thursday. A move back from 42 back to 40 represented a 5% gain and was what I was looking for initially. I decided to take the 2% profit on the first half to simply reduce my overall risk in the trade. I figured even if I lost on the balance of my shares, I'd do no worse than breakeven on the entire trade. Then this morning we saw further weakness and we actually printed a slightly lower low, providing ample opportunity to exit. That portion of my portfolio returned back to cash with profit intact. In this crazy, volatile market, any gain is a good gain and I really prefer maintaining a large cash position. If you shorted and desire to hold longer, the rising 20-day EMA could be an opportunity for a larger gain, but I'd remember to keep my stop in place. Any close over 42.06 would take me out of a short position. Intraday, you just have to pick a level where you are comfortable and keep a stop there.
Earnings Reports
Here are the key earnings reports for the next two days, featuring stocks with market caps of more than $10 billion. I also include a few select companies with market caps below $10 billion. Finally, any portfolio stocks that will be reporting results are highlighted in BOLD. If you decide to hold a stock into earnings, please understand the significant short-term risk that you are taking. Please be sure to check for earnings dates for any companies you own or are considering owning.
Friday, February 11:
ENB, D, MGA, ARES, FTS, APO, WPC, BRKR, CLF, NWL, UAA, G, CAE, GT, ESNT, COOP, PRLB
Monday, February 14:
ANET, CLR, AAP, CAR, SCI, VNO, OMCL, MEDP, PRI, TNET
Economic Reports
February consumer sentiment: 61.7 (actual) vs. 67.5 (estimate)
Happy trading!
Tom