
EB Daily Market Report - Monday, February 14, 2022
Happy Valentine's Day!
ChartLists Update
The Upcoming Earnings ChartLists for each day of this week have been added to our website, so you can review or download (downloading requires StockCharts Extra or Pro membership) at your leisure. The Upcoming Earnings Relative Strength ChartList was just added to the website this afternoon. Every chart in this ChartList is shown on a relative strength basis vs. its industry peers. This is a great way to quickly zero in on companies that have been showing excellent relative strength vs. their peers over some predetermined period. I like to use "Summary" form on the ChartLists and then use a 1-month period. Then I sort it by % change and it lists the best relative performers over the past month (pre-earnings) in order of relative strength. It will provide one more piece of evidence to consider before earnings are released.
Executive Market Summary
- Futures were mixed overnight, but our major indices gapped lower to begin the day
- NASDAQ shares performed better on a relative basis throughout much of the day, while the Dow Jones lagged
- Since the first 90 minutes, however, selling has picked up on the NASDAQ on a relative basis - not good
- To complicate matters, options expire this Friday, so don't be shocked to see leaders become laggards and vice versa; keep this in mind if the bears seem to be in control at some point and a major reversal occurs
- Consumer discretionary (XLY, +0.37%), a very weak sector, is the only sector out of 11 in positive territory
- Meanwhile, the best sector in 2022 - energy (XLE, -2.81%) - is by far today's worst performing sector
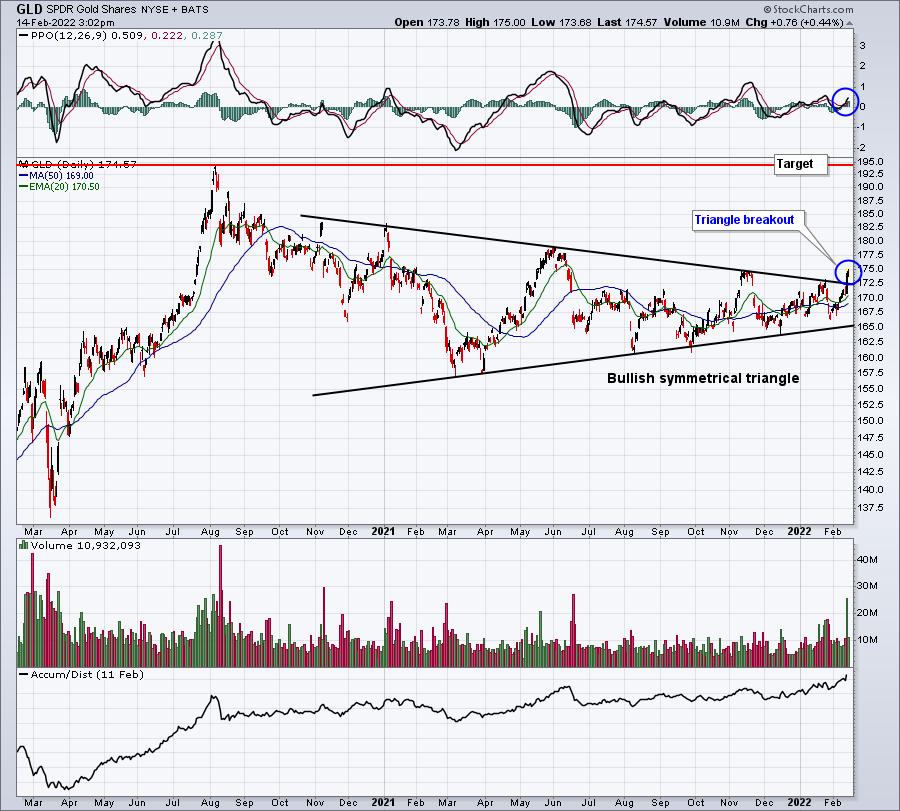
- Commodities are mostly higher with gold ($GOLD, +1.61%) rising to $1871 per ounce, challenging the November 2021 high and breaking out of a bullish symmetrical triangle - see more below
- Crude oil ($WTIC, +1.59%) is nearing $95 per barrel
Market Outlook
On Friday, I mentioned to beware the afternoon selloffs and we're now potentially looking at the Monday version of it. While the overall market went negative this afternoon and is trying to battle back, I want you to check out the growing problem of large cap growth stocks ($DJUSGL):
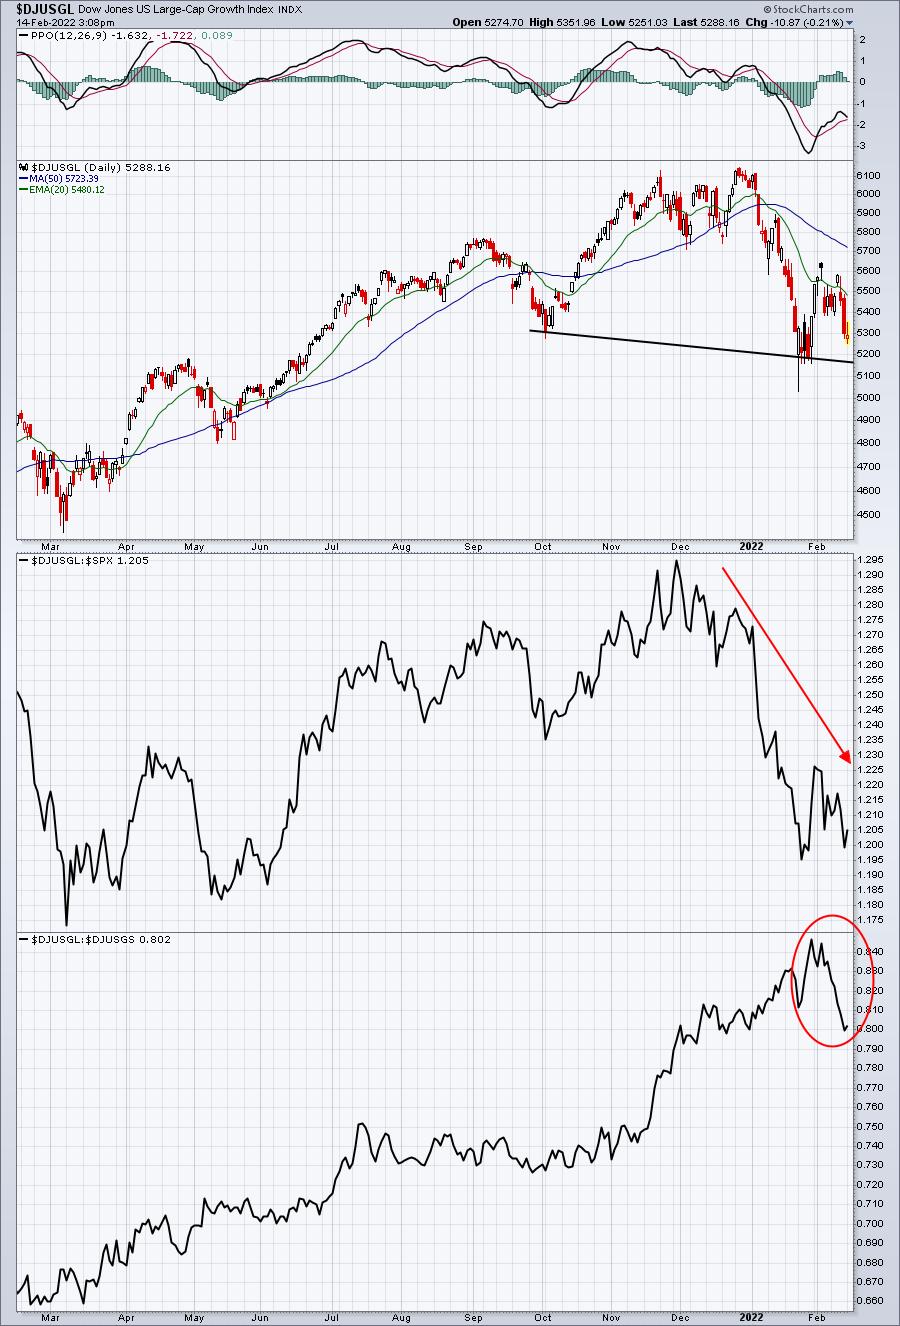
We're moving precariously close to a breakdown beneath a down sloping neckline in a bearish head & shoulders pattern. The bottom two panels show that growth stocks have finally deteriorated vs. the benchmark S&P 500. And the red circle in the bottom panel tells me that sellers have moved from small cap growth stocks to large cap growth stocks. The latter is what has held the S&P 500 together for the past year throughout the inflation surge. If this downtrend doesn't reverse, the S&P 500 will likely be under much more selling - and very likely in the near-term.
Sector/Industry Focus
Given all the renewed fear and uncertainty, gold (GLD) has made the symmetrical triangle breakout that I've been looking for. I believe the GLD is poised to make a run for 195 to test the August 2020 high. GLD tends to be at its best in terms of relative strength when the S&P 500 is under intense selling pressure. The breakout late last week occurred as impulsive selling in U.S. equities accelerated - not surprising at all:
(Full Disclosure: I own GLD shares)
ChartLists/Strategies
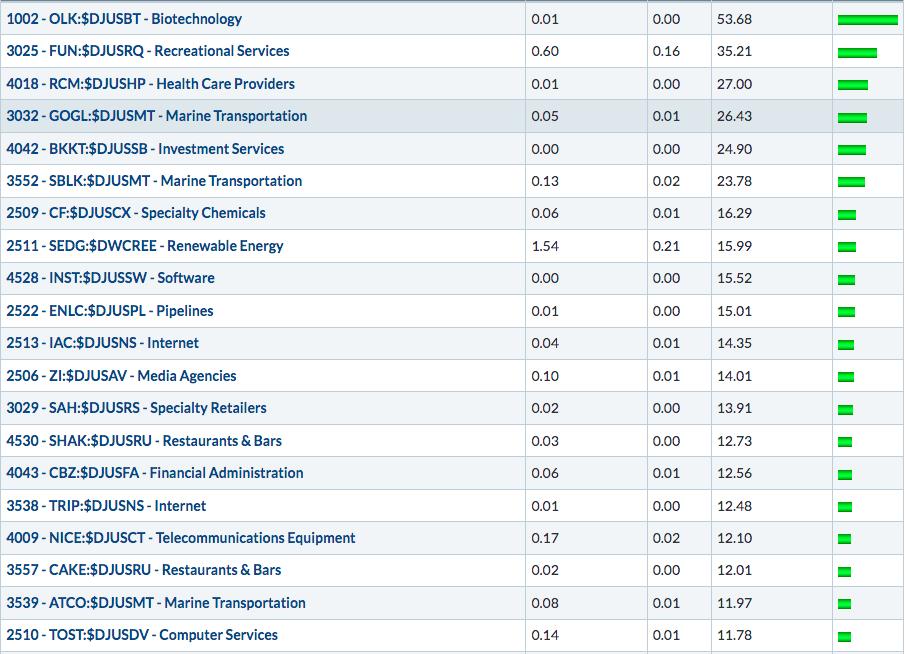
Here's a quick look at several of the companies showing excellent relative strength (vs. their industry peers), followed by several that have not been so fortunate, as they prepare to release quarterly results this week:
Best 1-Month Performers:
Worst 1-Month Performers
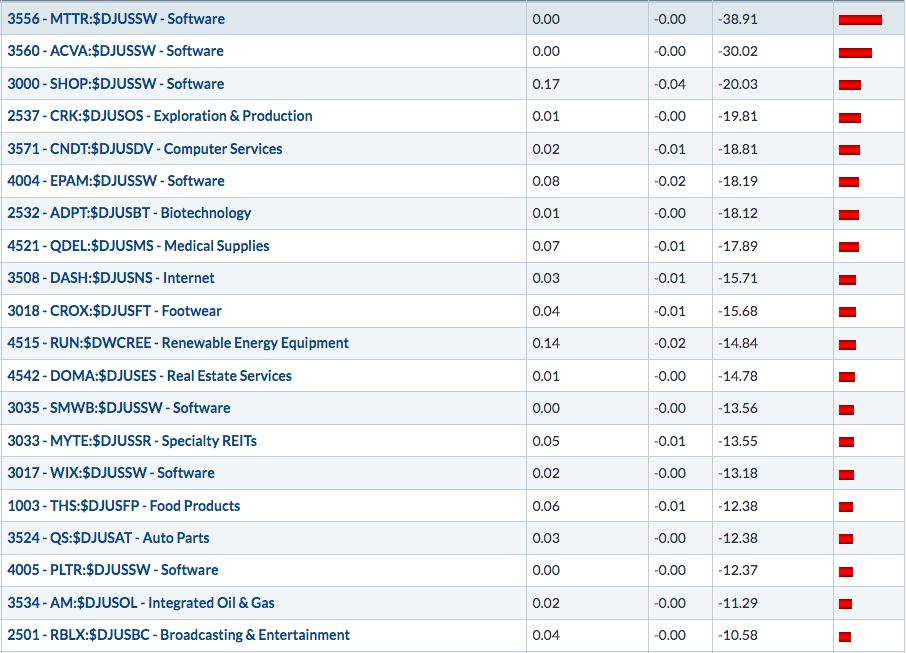
Shopify (SHOP) and Crox (CROX) are among the worst relative performers heading into their earnings reports this week. Both of these stocks have been long-term leaders in their respective industries, but Wall Street clearly has some reservations right now. Here are both charts on an absolute basis:
SHOP:
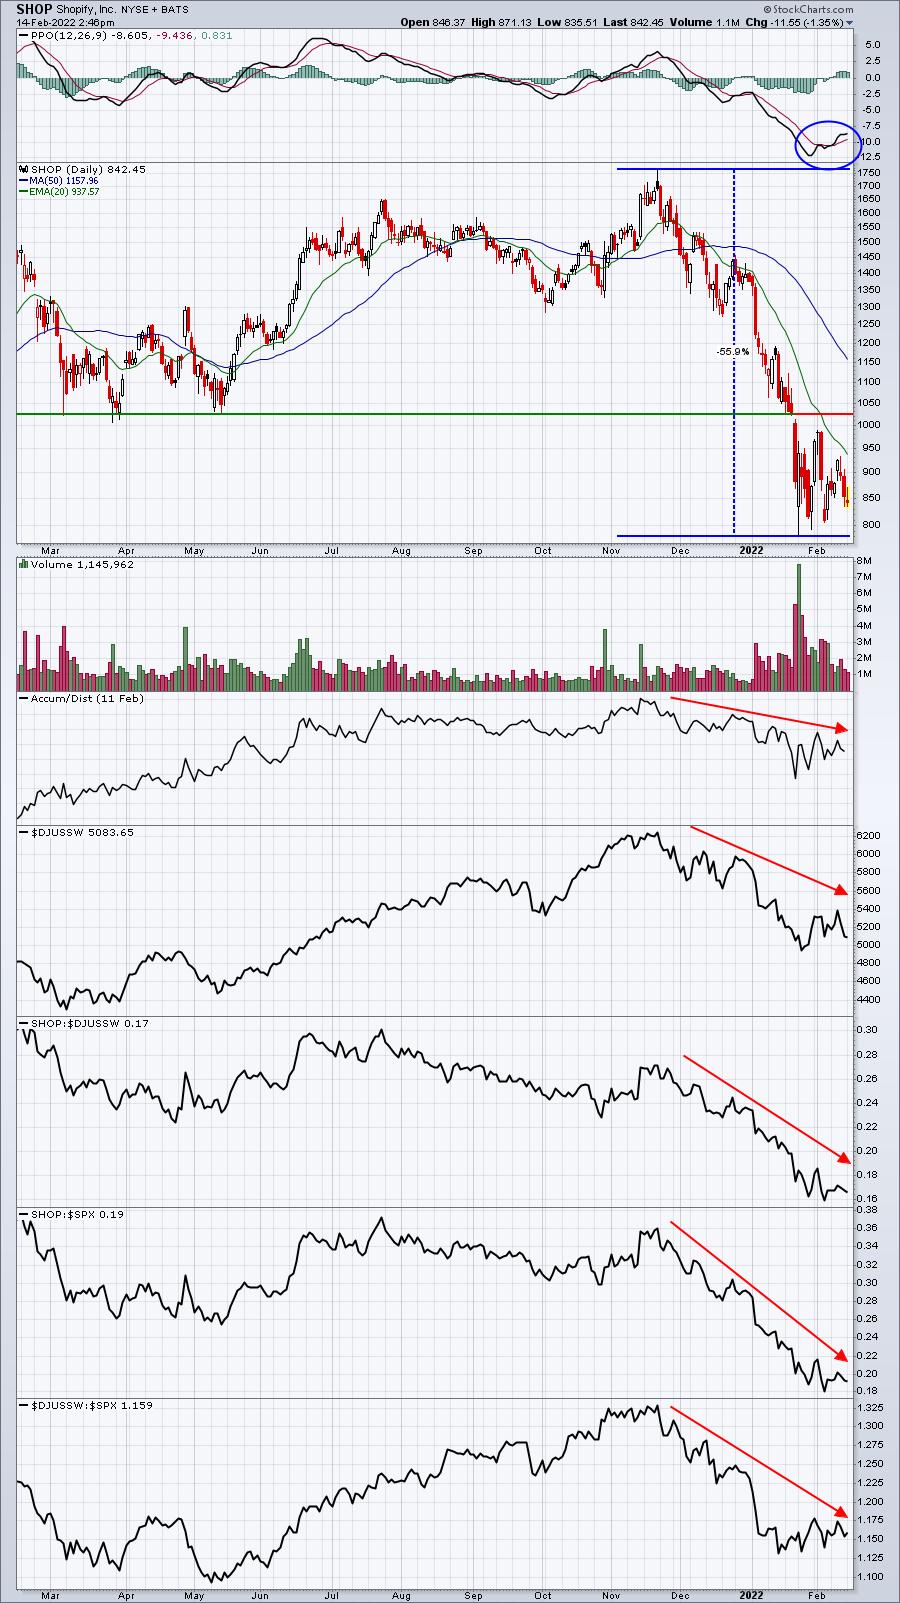
I see mixed signals here. First, there's clearly something wrong with the stock. It fell more than 55% in 2 months. That doesn't happen for no reason. Wall Street is not impressed with SHOP right now, so we shouldn't be either. There is a positive divergence, though, suggesting that maybe this drop has been too severe too fast. SHOP is not a stock I'd be comfortable being long right now, despite the massive selloff. I'd be looking for perhaps an oversold bounce with earnings to consider a short position. Holding into earnings on either side - long or short - is incredibly risky.
CROX:
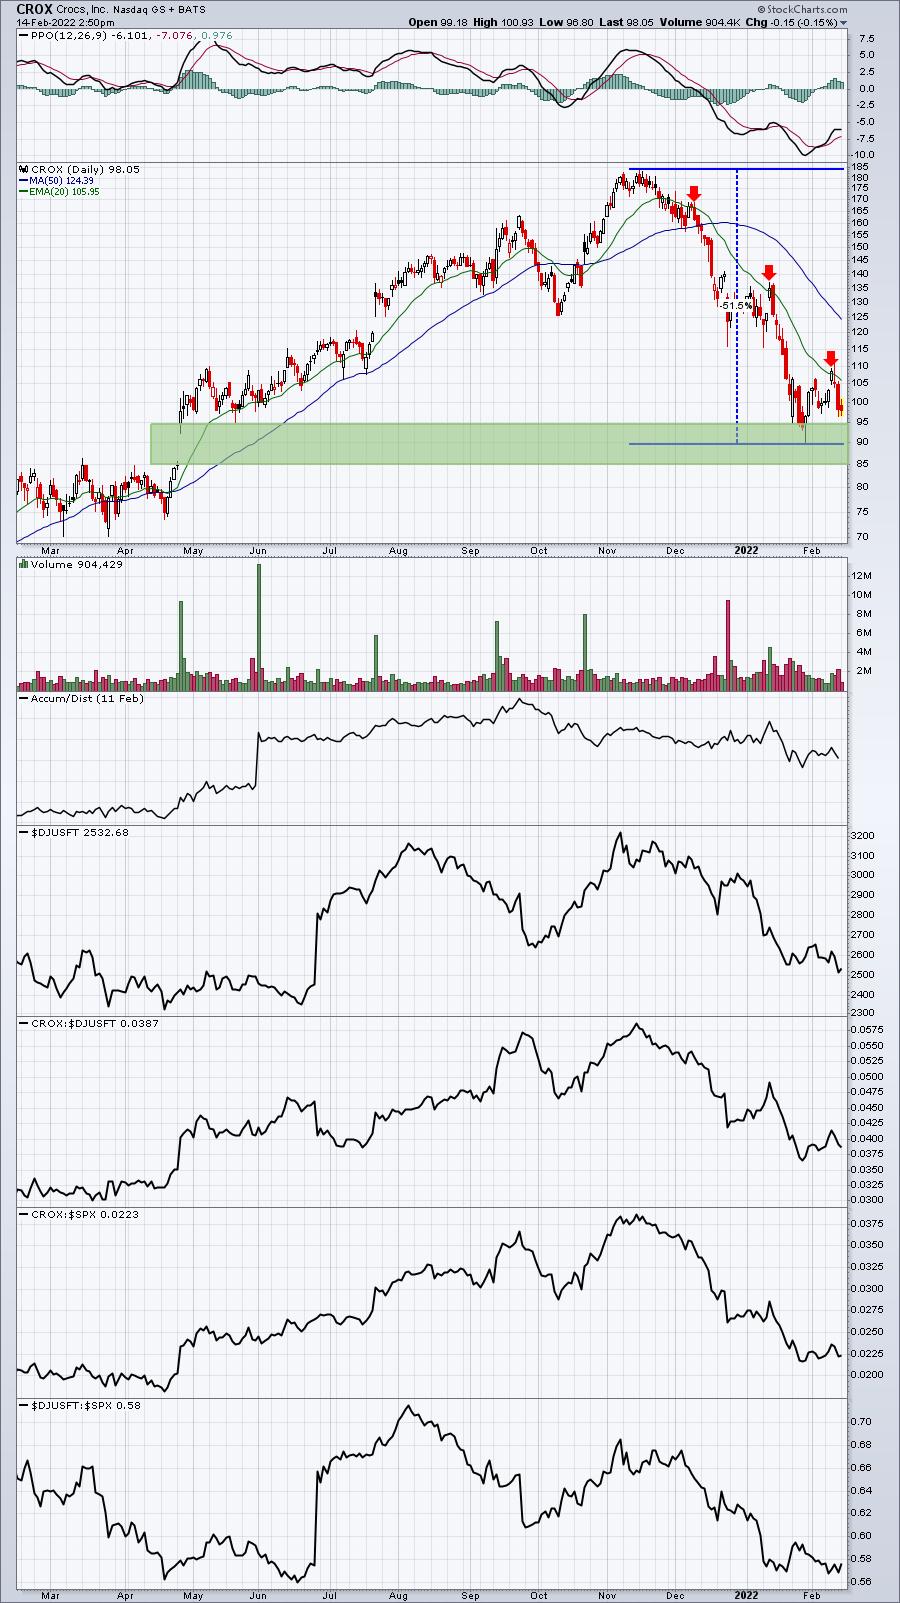
CROX has also seen a very big drop. It does, however, have significant gap support in the 85-95 area. If CROX reaches the upper 80s, it'll likely be accompanied by a massive positive divergence. A gap lower after disappointing news could actually set a bottom in here - at least in the short-term. I wouldn't be surprised to see a big gap down and a hollow candle (close above open) print. This one too is very risky if you plan to hold it into earnings as a long or short. I didn't annotate it, but CROX has been a terrible relative performer, suggesting that Wall Street has been bailing on it for several weeks now.
Earnings Reports
Here are the key earnings reports for the next two days, featuring stocks with market caps of more than $10 billion. I also include a few select companies with market caps below $10 billion. Finally, any portfolio stocks that will be reporting results are highlighted in BOLD. If you decide to hold a stock into earnings, please understand the significant short-term risk that you are taking. Please be sure to check for earnings dates for any companies you own or are considering owning.
Monday, February 14:
ANET, CLR, AAP, CAR, SCI, VNO, OMCL, MEDP, PRI, TNET
Tuesday, February 15:
ABNB, ZTS, FIS, MAR, ECL, TRP, IQV, RBLX, DVN, WELL, INVH, RPRX, VIAC, ZI, CINF, AKAM, YNDX, QSR, CF, TOST, SEDG, MASI, LDOS, IAC, WYNN, ALLE, BKI, HSIC, BWA, WFG, TX, UPST, WH, IPGP, LSCC, HUN, ANGI, AYX, ATRC, SABR, LGIH, LZB, DENN
Economic Reports
None
Happy trading!
Tom