
EB Daily Market Report - Tuesday, February 15, 2022
Max Pain Event Today
Our monthly Max Pain event will be held at 4:30pm ET today as I discuss last month's max pain results, along with plenty of trading candidates for this month. Options expire Friday and after a few days of impulsive selling, there are TONS of in-the-money puts right now. This morning, out of nowhere, the stock market gapped significantly higher. Coincidence? You be the judge. I know I've seen this plenty of times before, so I view ANYTHING as possible during options expiration week and over a few days into the following week.
If you'd like to join me for today's session, you can do so by clicking on the following link any time after 4:00pm ET:
https://earningsbeats.zoom.us/j/84629459743
I hope to see you there! If for some reason you can't make it, we'll record the session for your later review.
Executive Market Summary
- Futures soared overnight as word spread that Russia was pulling back troops from the Ukraine border
- Cryptocurrencies are significantly higher today as the environment has become much more "risk on"; etherium ($ETHUSD) has spiked nearly 8% at last check
- Commodities, which have been strong of late, are tumbling today
- Crude oil ($WTIC, -4.09%) and silver ($SILVER, -2.40%) are both suffering; gold ($GOLD, -0.90%) is down as well
- The 10-year treasury yield ($TNX) is up 4 basis points after another very hot inflation report this morning
- January producer prices (PPI) jumped 1.0%, well ahead of the 0.5% increase expected; Core CPI also was well above expectations; December PPI and Core PPI was also revised higher
- Consumer discretionary (XLY, +1.74%) and technology (XLK, +1.65%) are the top two sectors today and market makers are benefiting from both moving higher
- Energy (XLE, -1.16%), the strongest sector in 2022, has a ton of net in-the money call premium, so we shouldn't be surprised to see this group lagging
Market Outlook
The craziness that is max pain week has begun. The long-term (1+ years) picture remains very bullish, in my view. The intermediate term (3-6 months), however, remains cloudy at best as I expect a cyclical bear market to confirm, which requires a 20% drop. The very near-term (less than a week) is bullish based on the net in-the-money put premium on both the SPY and QQQ, two ETFs that track the S&P 500 and NASDAQ 100, respectively. Looking at the S&P 500, if we do see a rally to wipe out BILLIONS of net put premium, here are a couple levels to potentially watch:
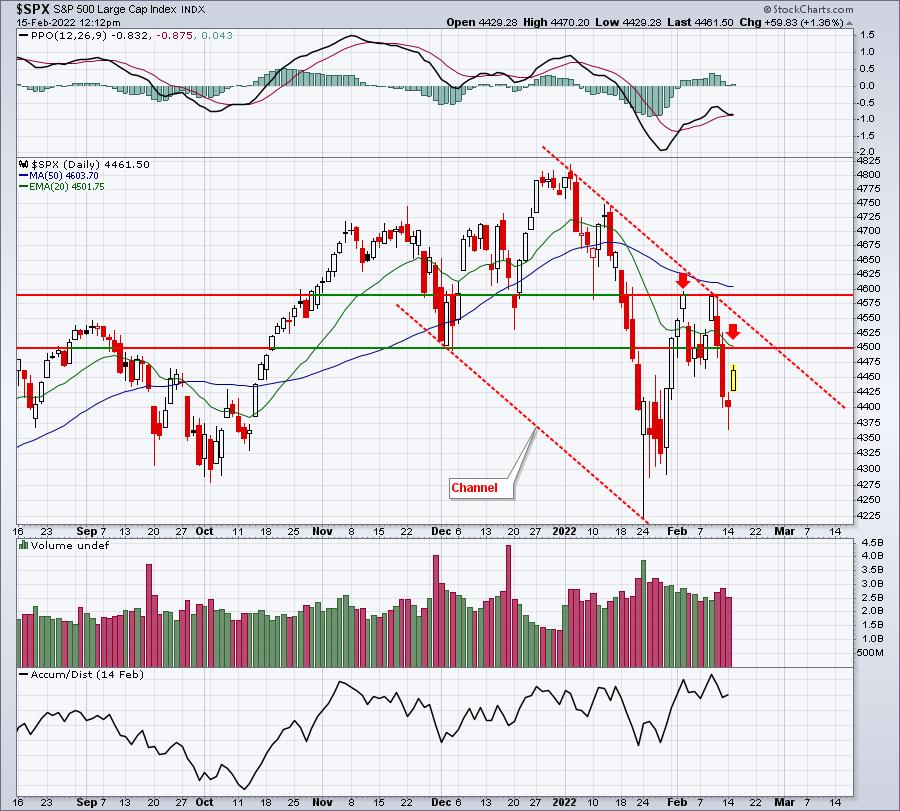
I don't have the actual max pain point calculated yet on the SPY, but I will have it later today at the webinar. We'll see how that fits into the chart above.
Sector/Industry Focus
One specific area of the market that will be very interesting to watch this week will be retail. The XRT is a well-diversified retail ETF that isn't traded too heavily in the options area, but still, what has been traded suggests we could see further upside here. Tomorrow morning, we'll get the latest monthly retail sales report (for January). After a couple of very negative retail sales reports, the January report is calling for +2.0%. The consensus range is anywhere from +0.9% to +5.5%. A stronger-than-expected report could result in a very strong day for retail tomorrow.
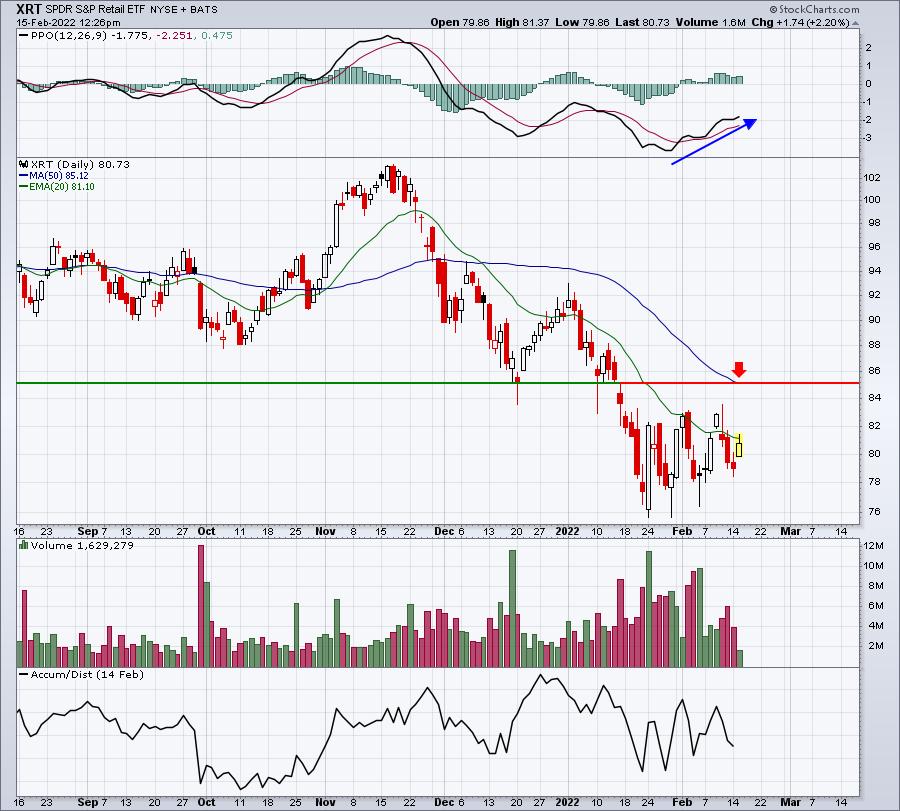
The PPO has been strengthening and the XRT has been trying to clear its 20-day EMA. Key price resistance and the 50-day SMA both reside near the 85 level. If the 20-day EMA is cleared and the January retail sales report doesn't disappoint, I could see a quick rally to that 85 area - or at least a directional move toward 85.
Carvana (CVNA) is a specialty retailer that has come under intense selling pressure. A quick 10% rebound to test its 20-day EMA would provide market makers some relief, though CVNA is not heavily traded in options. Still, there is net in-the-money put premium that a quick rally could wipe out.
ChartLists/Strategies
It's Max Pain week, so for those of you that are very aggressive traders, there will be plenty of trading opportunities based on the current state of options. Last month, one stock that we featured as a potential short, because of its massive net in-the-money call premium, was Ford (F). Right on cue, F tanked into options expiration as millions of call premium vanished in the span of a few days:
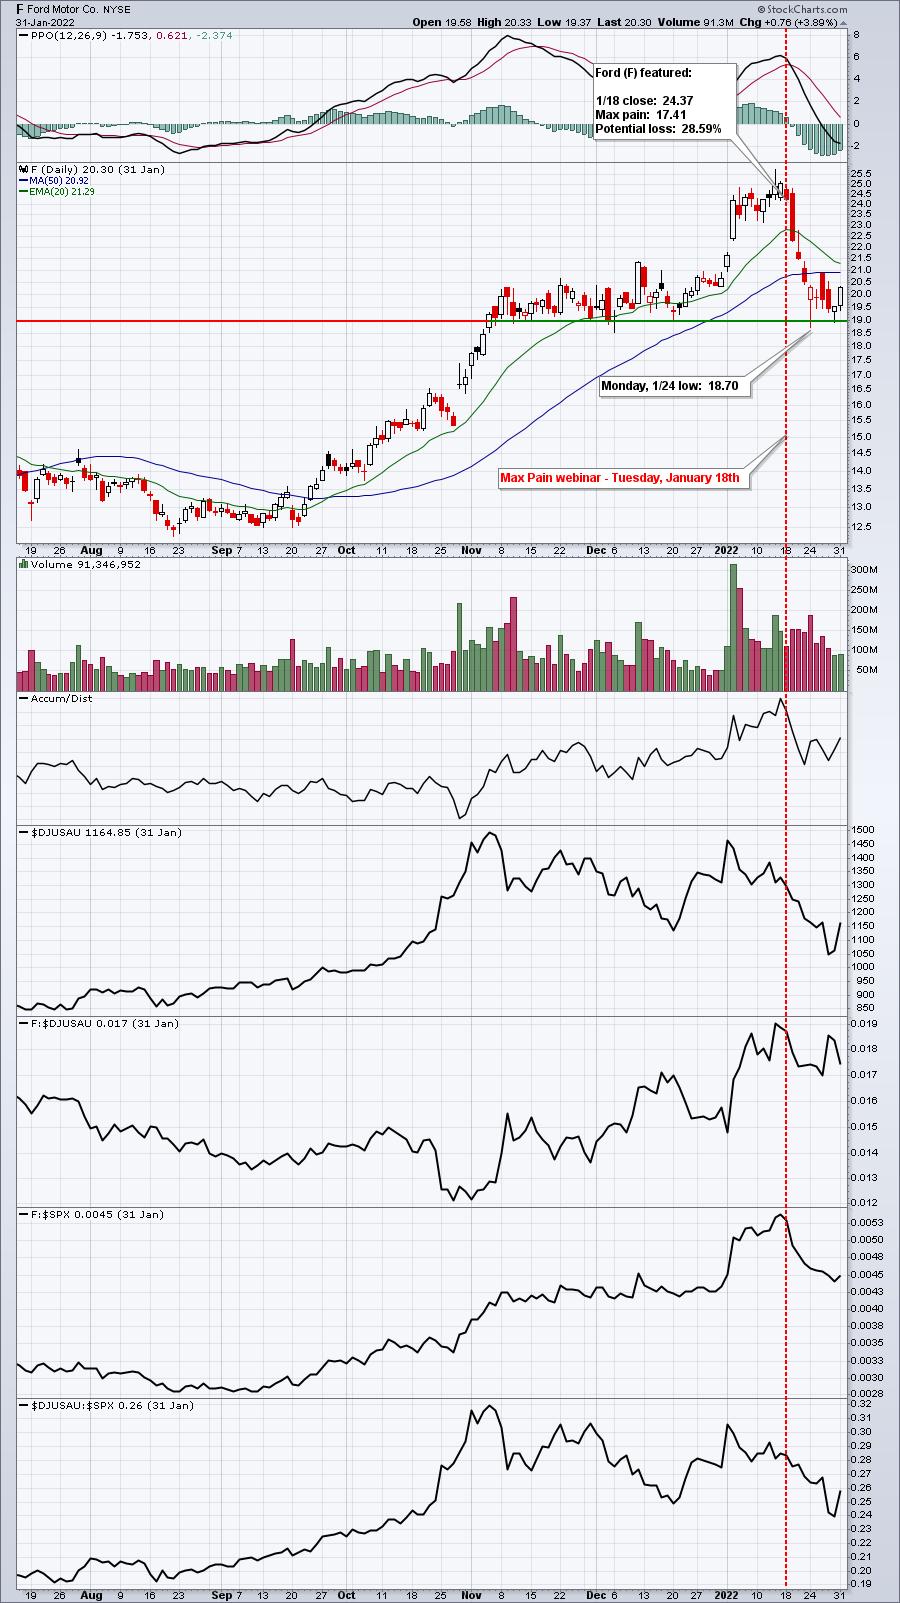
Abracadabra! It's MAGIC! Listen, max pain doesn't always work, just like the PPO doesn't always work and patterns don't always work. But it's a signal that I would not ignore as it helps to analyze risk in a particular trade. Think of it as a "path of least resistance", not a guaranteed path.
I mention F, because I've gone long the stock for the opposite reason in February. F now has a ton of net in-the-money put premium, suggesting an advance later this week could be in the cards. Our max pain calculation shows F's max pain as 20.54, more than 15% higher than current price. Here's the current chart and a couple areas to watch to the upside and downside:
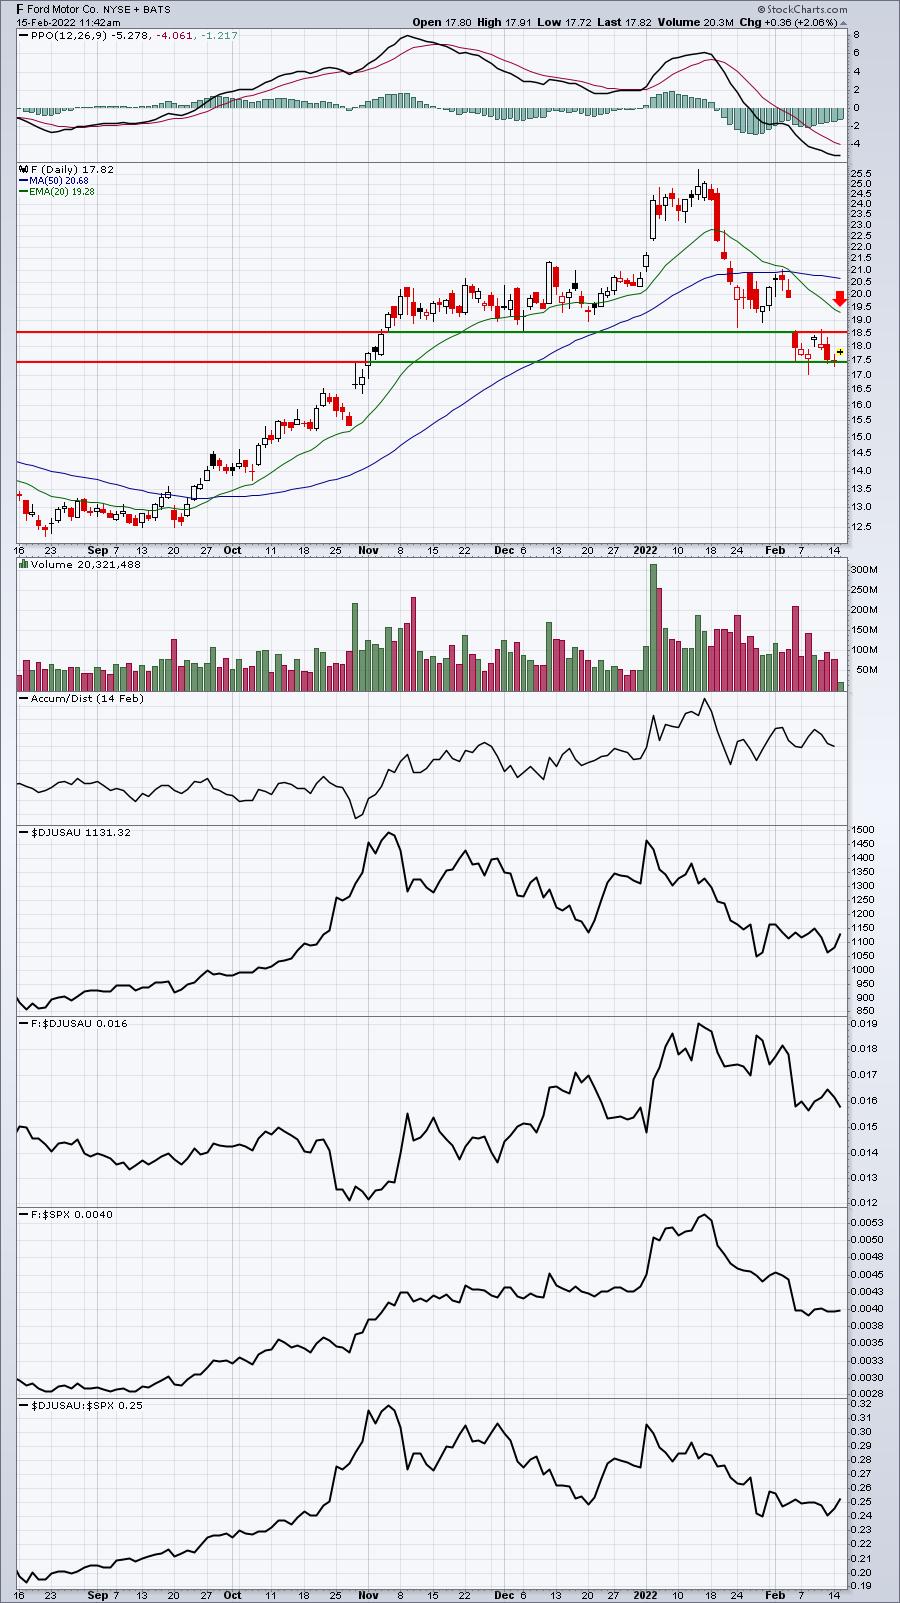
I didn't look at options activity until near the close on Monday and I didn't see F specifically until after the market had closed. Otherwise, I probably would have jumped in yesterday. Instead, I bought this morning. A close below 17.46 (gap support) would likely take me out of this trade as max pain does not provide a guarantee of higher prices, so please consider stops for any trades placed. To the upside, gap resistance at 18.52 would be one key resistance level, while the declining 20-day EMA, currently at 19.28, would be another level to consider for taking profits.
I also bought Unity Software (U) as a short-term max pain trade. U shows max pain at 128.62 and is currently trading just beneath 110. After trading recently with lower daily highs and lower daily lows, U gapped higher this morning and printed a higher intraday high, so I plan to use Monday's intraday low at 105.71 as my intraday stop. I may raise it each day to the prior day's low. U is typically much more volatile than F, so the risk here is greater, in my opinion, though the risk is high for both.
Earnings Reports
Here are the key earnings reports for the next two days, featuring stocks with market caps of more than $10 billion. I also include a few select companies with market caps below $10 billion. Finally, any portfolio stocks that will be reporting results are highlighted in BOLD. If you decide to hold a stock into earnings, please understand the significant short-term risk that you are taking. Please be sure to check for earnings dates for any companies you own or are considering owning.
Tuesday, February 15:
ABNB, ZTS, FIS, MAR, ECL, TRP, IQV, RBLX, DVN, WELL, INVH, RPRX, VIAC, ZI, CINF, AKAM, YNDX, QSR, CF, TOST, SEDG, MASI, LDOS, IAC, WYNN, ALLE, BKI, HSIC, BWA, WFG, TX, UPST, WH, IPGP, LSCC, HUN, ANGI, AYX, ATRC, SABR, LGIH, LZB, DENN
Wednesday, February 16:
NVDA, CSCO, AMAT, SHOP, ADI, EQIX, PXD, AIG, SNPS, KHC, NTR, HLT, GOLD, TTD, ET, DASH, WCN, ES, CPRT, AWK, ALB, APP, VMC, GRMN, GMAB, TYL, GNRC, MRO, CRL, WAB, TS, HST, CONE, H, TXG, OC, CHH, DNB, PEGA, BFAM, SITE, INFA, DAVA, KGC, RGLD, STAG, CROX, AM, WING, VMI, SUN, ALSN, TRIP, R, FSR, FSLY, SPWR, CAKE, INFN, KAR, VECO, PLMR
Economic Reports
January PPI: +1.0% (actual) vs. +0.5% (estimate)
January Core PPI: +0.8% (actual) vs. +0.5% (estimate)
February empire state manufacturing index: 3.1 (actual) vs. 10.0 (estimate)
Happy trading!
Tom